Monte Carlo simulation of active scanning proton therapy system with Gate/Geant4:
|
|
|
- Mathilde Léonard
- il y a 10 ans
- Total affichages :
Transcription
1 Institut National des Sciences Appliquées de Lyon Ecole Doctorale : Electronique, Electrotechnique et Automatique THESE DE DOCTORAT Présentée et soutenue publiquement par : M. Loïc Grevillot le 14 Octobre 2011 Monte Carlo simulation of active scanning proton therapy system with Gate/Geant4: Towards a better patient dose quality assurance Simulation Monte Carlo d'un système de protonthérapie à balayage actif avec Gate/Geant4 : Vers une meilleure assurance qualité de la dose délivrée au patient COMPOSITION DU JURY Pr. Frank Verhaegen Professor, MAASTRO, Maastricht (Nl) Rapporteur Dr. Harald Paganetti Associate Professor, MGH, Boston (US) Rapporteur Dr. Irène Buvat Directeur de Recherche, CNRS, Paris (Fr) Examinateur Dr. Katia Parodi Associate Professor, HIT, Heidelberg (De) Examinateur Pr. Jacques Balosso Professeur, ETOILE, Lyon (Fr) Examinateur Dr. David Sarrut Chargé de Recherche, CNRS, Lyon (Fr) Directeur de thèse Dr. Nicolas Freud Maître de Conférence, INSA, Lyon (Fr) Co-Directeur de thèse Dr. Damien Bertrand Physicien, IBA, Louvain-la-Neuve (Be) Co-Encadrant
 Rapporteur Dr. Harald Paganetti Associate Professor, MGH, Boston (US) Rapporteur Dr.")
2

3 Abstract Hadron Therapy is an advanced radiotherapy technique for cancer treatment. It oers a better irradiation ballistic than conventional techniques and therefore requires appropriate quality assurance procedures. In this work, we upgraded the GEANT4-based GATE Monte Carlo platform in order to recalculate the TPS dose distributions in view of further benchmarking. In a rst step, we selected an appropriate simulation environment (physics models and parameters) in order to produce accurate and ecient simulations. GATE simulations were validated using measurements and other Monte Carlo codes for depth-dose and transverse proles. While a good agreement was found for depth-dose proles, larger discrepancies were pointed out for transverse proles. In a second step, we developed a modeling method to simulate active scanning beam delivery systems, which does not require to simulate the components of the treatment nozzle. The method has been successfully applied to an IBA proton therapy system and validated against measurements for complex treatment plans. Interfaces have also been developed in order to link DICOM RT ION PLAN and DICOM RT DOSE with GATE. Finally, we compared in a third step the TPS and Monte Carlo dose distributions in homogeneous and heterogeneous congurations. The beam models of both dose engines were in satisfactory agreement, allowing further evaluation of clinical treatment plans. A two-eld prostate plan has been evaluated, showing a satisfactory agreement between the TPS and Monte Carlo, and demonstrating the novel capabilities of the platform for the evaluation of the TPS. To summarize, we selected an appropriate simulation environment for proton therapy, proposed a modeling method for active scanning systems and presented a method to compare the TPS and Monte Carlo dose distributions. All tools developed in GATE were or will be publicly released. A detailed validation stage of the system including absolute dosimetry is still necessary, in order to quantitatively evaluate its accuracy in various homogeneous and heterogeneous congurations. In this thesis, we have demonstrated that the GATE Monte Carlo platform is a good candidate for the simulation of active scanning delivery systems, allowing further TPS benchmarking. Moreover, the GATE platform also handles imaging applications, such as PET or prompt-gamma imaging towards online treatment monitoring and paves the way of interdisciplinary research advances. III
 in order to produce accurate and ecient simulations.")
4 IV

5 Acknowledgments I did not include a list of names in this section, however if you recognize yourself elsewhere in this paper, then you are all acknowledged herein... I had the opportunity of working in a very exciting international environment during three years, with passionate people, who have been able to organize and manage such a project at a European level. The team of PARTNER friends has been wonderful and I do believe that I have been a lucky PhD student, to have been involved in such a special environment. Meeting my friends from all around the world several times a year was really open-mining. We attended many interesting trainings, followed by entertaining evenings, nights and sometimes even mornings... A strong connexion between all of us has been created and I will never forget the rst meeting in Valencia, which was the start of the adventure for many of us. A special thanks also to you, my PARTNER friend who visited us on July, 24th, To achieve this project, I interacted with many specialists in cyclotrons, beam lines, Monte Carlo, particle matter interactions, image processing, computer science, etc. and I would not have accomplished half of what you will soon explore without their help. The European context, funding possibilities and large number of events to which I attended greatly contributed to my scientic development. It gave me the opportunity to meet and network with key specialists from the beginning of the project. My supervisors from both institutions have obviously signicantly contributed to this project, as they created it, performed a great deal of proof reading and helped me to take key decisions. I smile when remembering the day my master thesis advisor asked me to send a resume for a project I did not know the background to and later that morning call in Paris when I explained that I declined this position... I spent my time in between Lyon and louvain-la-neuve, within two very dierent worlds. I will keep a very good memory of the morning coee breaks, the brain-storming on the white board and the Japanese bath in Gunma... with this funny, friendly, but also serious atmosphere in the algeco, so warm and cold, but unfortunately not in the good season. By chance, we had the possibility to move to another building, with many friendly clinicians, so called the watertank warmers. At IBA, I will remember the BBQ and the mini-foot between 12 and 14 every Tuesday, which every week was the long-awaited day! Finally, to all the people who still have not recognized themselves in these lines and to my wife for her support and all these other things, which are, as we say in science, out of the scope of this report... V

6 VI

7 Foreword This manuscript is organized in seven chapters. The rst chapter presents the overall context of the project and starts with a brief introduction from cancer incidence to the research subject investigated in this thesis. Then, the European context (PARTNER and ENLIGHT) is underlined and the rationale for hadrontherapy in cancer treatment is defended. Finally, the remainder of the chapter deals with the prerequisites necessary to understand the following chapters and ends with a detailed presentation of the objectives of this thesis. The second chapter intends to present the main aspects of the physics and biology of hadrontherapy, with a strong focus on the physics of proton therapy. A two-level description is given, including key concepts and a detailed level of description. The third, fourth and fth chapters of the manuscript are the main contributions and each of them corresponds to a scientic article. Chapter 3 describes the physics and parameters of GATE/GEANT4 for proton therapy, chapter 4 presents a Monte Carlo beam model of an IBA proton therapy system and chapter 5 compares TPS and Monte Carlo dose distributions for typical test cases and for a prostate treatment plan. Each paper is encapsulated with a general introduction and conclusion, but also with additional perspectives relative to the chapter. Extra results, not included in the papers are also proposed. The sixth chapter concludes the manuscript. It recalls the context, objectives and achievements, with further perspectives. It is followed by a list of scientic contributions. Finally, the seventh chapter is a summary of the thesis in French. VII

8 Contents 1 Project context Introduction Hadron Therapy in Europe: ENLIGHT & PARTNER Rationale for hadron therapy Cost eectiveness of hadrontherapy GEANT4 & GATE Monte Carlo codes Proton beam delivery techniques Cyclotron-based proton beam production Passive scattering Pencil Beam Scanning (PBS) Treatment Planning Systems (TPS) Objective of the project Physics and Biology of hadrontherapy Physics of hadrontherapy Stopping power Linear energy transfer (LET) Range/Energy relationship Range straggling Nuclear stopping power Multiple Coulomb scattering Nuclear interactions Biology of hadrontherapy DNA damages The Linear Quadratic Model (LQM): The Relative Biological Eectiveness (RBE): Clinical implementation of radiobiological models Physics settings for proton therapy Introduction Article Conclusion & Perspectives PBS model Introduction Article Conclusion & Perspectives Additional investigations On inuence of non-elastic nuclear models Dierences between GEANT4.9.2 and GEANT VIII
.")
9 4.4.3 Particularities of the PBS modality TPS comparisons Introduction Article Conclusion & Perspectives Conclusion & Perspectives 103 List of scientic contributions Résumé en français Contexte Introduction L'hadronthérapie en Europe: ENLIGHT & le projet PARTNER Rationnel pour l'hadronthérapie Le code Monte Carlo GATE Balayage actif de faisceau étroit (PBS) Système de plannication de traitement (TPS) Objectif du projet Environnement de simulation Monte Carlo Modèle PBS Monte Carlo Comparaisons TPS et Monte Carlo Conclusion IX
..................... 112 7.1.6 Système de plannication de traitement (TPS)................ 112 7.1.7 Objectif du projet.")
10 X

11 Chapter 1 Project context 1.1 Introduction Cancer incidence Cancer is a major concern worldwide. It is considered to be responsible for 25% of all deaths in Europe and it is the biggest killer of people aged between [1]. In 2008, the number of new cases and deaths were estimated to 3.2 million and 1.7 million, respectively [2]. The most frequent cases are colorectal (13.6%), breast (13.1%), lung (12.2%) and prostate cancers (11.9%) [2]. Respiratory cancers (larynx, trachea, bronchus and lung) are the most lethal. They account for 5% of all mortality causes and for 20% of all deaths from cancer [1]. It has been estimated that about 45% of all cancer patients can be cured [3]. Detailed statistics about cancer incidence and mortality worldwide can be found in [4]. As an example, the situation in Europe is presented in Figure 1.1. The number of new cancers detected in 2008 and the estimated gures Figure 1.1: This graph presents the age-standardised rates of cancer incidence and mortality in Europe per person at risk, as dened in [4]. for 2015 are presented in Figure
![2 million and 1.7 million, respectively [2]. The most frequent cases are colorectal (13.6%), breast (13.1%), lung (12.2%) and prostate cancers (11.9%) [2].](/docs-images/44/9620868/images/page_11.jpg "Respiratory cancers (larynx, trachea, bronchus and lung) are the most lethal. They account for 5% of all mortality causes and for 20% of all deaths from cancer [1].")
![CHAPTER 1. PROJECT CONTEXT Figure 1.2: This graph presents the number of new cancers detected in 2008 and the expected number in 2015 in Europe [4].](/docs-images/27/9620868/images/12-0.png "Cancer treatment Cancer is a term used for diseases in which abnormal cells divide without control and are able to invade other tissues.")
12 CHAPTER 1. PROJECT CONTEXT Figure 1.2: This graph presents the number of new cancers detected in 2008 and the expected number in 2015 in Europe [4]. Cancer treatment Cancer is a term used for diseases in which abnormal cells divide without control and are able to invade other tissues. Cancer cells can spread to other parts of the body through the blood and lymphatic systems. One can summarize the cancer treatment possibilities in three main families: surgery, drugs and radiation. Most of the time, the various treatment possibilities are combined. The choice of the treatment depends on the tumor type, location, stage of the disease and general state of the patient. At present, in industrialized countries, radiation therapy is used in about 70% of all cancer treatments [3]. Useful information about cancer denition and treatment possibilities can be found online [5, 6]. When treating patients, the ultimate goal is to eradicate the disease, without damaging the surrounding healthy tissues. In practice, the medical decision is always a trade-o between Tumor Control Probability (TCP) and Normal Tissue Complication Probability (NTCP). Surgery makes it possible to remove the tumor, but adjacent healthy tissue constraints and risks of distant metastases limit its eectiveness. When metastases are present, the use of drugs as chemotherapy is necessary. Radiation therapy allows killing tumor cells, by depositing a high dose of radiation within the tumor. Conventional radiation therapy There are two types of radiation treatments: internal (brachytherapy) and external radiation therapy. Brachytherapy consists in applying radioactive seeds directly in contact with the tumor, while external therapy is a non-invasive way of delivering high energy particle beams to the tumor. Conventional external radiation therapy uses electron and photon beams. The evolution of photon delivery techniques using conventional linear accelerator equipped with multi-leaf collimators (as IMRT 1 or Arc-therapy) or new delivery devices (such as Cyberknife or Tomotherapy) have allowed to signicantly improve the treatment conformality over the last decade [3]. Hadrontherapy Ballistics of radiation is also strongly dependent on the particle used. Hadrontherapy is an advanced technique of external radiation therapy, using either low-let 2 ions such as protons or high-let particles such as carbon ions. In contrast with photons, ions have the advantage to stop at a given depth and to deliver a maximum dose in the distal part, called Bragg-peak, where the tumor is located. Moreover, high-let ions have enhanced radiobiological properties, which allow treating radio resistant tumors. Dose distributions for dierent treatment modalities are illustrated in Figure 1.3. More details about the LET concept and the radiobiological properties of ions are given in Chapter IMRT stand for Intensity Modulated Radiation Therapy 2. LET stands for Linear Energy Transfer and is described in section

13 1.2. HADRON THERAPY IN EUROPE: ENLIGHT & PARTNER (a) (b) Figure 1.3: (a) depicts the physical dose deposition of dierent particles in water (From GSI). The red circle points the dose deposited in the Bragg peak tail by secondary fragments produced with a carbon ion beam. (b) depicts a dose comparison between a proton Spread Out Bragg Peak (SOBP) and a photon beam. It illustrates the improved ballistic of protons over photons (From [7]). Objective The main task of a medical physicist is to make sure the right dose is delivered in the right place. Treatment planning systems (TPS) used to plan radiotherapy treatments are fast, but with limited dose accuracy in some particular cases. On the other hand, Monte Carlo simulations are slower, but considered to be the reference for dose calculation accuracy. Therefore, Monte Carlo is a valuable tool to benchmark TPS. In this thesis, we simulated a proton active beam scanning delivery system and recalculated treatment plans generated by a TPS in view of assessing the dosimetric accuracy of the TPS. A detailed presentation of the objectives is presented at the end of this chapter, in section Hadron Therapy in Europe: ENLIGHT & PARTNER The very promising results demonstrated over the last decade in Japan and Germany using carbon ion therapy yield a strong motivation in Europe [8]. Development of hadron therapy facilities have been promoted by the European Network for Light Ion Therapy (ENLIGHT 3 ) community, which have gathered together a large number of European institutes since 2002 [8]. ENLIGHT consists of more than 150 researchers, belonging to over 50 European Universities and research Institutes from 16 countries. Under the umbrella of ENLIGHT, several projects have been funded in order to develop, establish and optimize hadron therapy in Europe. This PhD is part of a four-year project called PARticle Training Network for European Radiotherapy (PARTNER), which started in November Early Stage Researchers (ESR) and Experienced Researchers (ER) have been hired in the various elds of hadron therapy (as for instance in physics, TPS, radiobiology or clinical trials). A very important focus on networking and training has been covered by the organization of 12 courses during the project. This thesis has been performed in collaboration with IBA 4 (Louvain-la-Neuve, Belgium) and the CREATIS 5 laboratory linked to
![(b) depicts a dose comparison between a proton Spread Out Bragg Peak (SOBP) and a photon beam. It illustrates the improved ballistic of protons over photons (From [7]).](/docs-images/44/9620868/images/page_13.jpg "Objective The main task of a medical physicist is to make sure the right dose is delivered in the right place.")
14 CHAPTER 1. PROJECT CONTEXT the ETOILE 6 hadron therapy center project (Lyon, France). A brief historical diagram of the emergence of particle therapy over the last century is presented in Figure 1.4. Figure 1.4: Particle therapy evolution over the last century (From ENLIGHT). 1.3 Rationale for hadron therapy The better ballistic of ions over photons allow decreasing the dose to surrounding tissues by a factor 2-10 [8]. It has been shown that the total energy deposited 7 by proton therapy is about half that of photon IMRT [9]. High LET particles like carbon ions have additional advantages: they produce more damages in the tumor located in Bragg peak and they allow to treat tumors radio resistant to low-let particles like photons and protons [3]. These two eects called Relative Biological Eectiveness (RBE) and Oxygen Enhancement Ratio (OER), respectively, are presented later in section 2.2. Despite a clear advantage in terms of dose conformation and based on [10], there is currently no obvious evidence of improved survival rate using protons instead of photons. In [11], the superiority of protons over photons has been shown for children based on late toxicities. For pediatric tumors, photons lead to a larger volume of normal tissues exposed to low doses (Figure 1.5) and to an increased total body exposure [7], which are both known to increase the risk of radiation-induced secondary cancer [11]. The shorter follow-up of carbon ion therapy does not allow drawing conclusions regarding long-term toxicities, but there is clearly a place for ion therapy where tumor radiation resistance is an issue with protons [11]. The initial experience with ions started at Berkeley in 1954 with high-let neon ions [3], as summarized in table 1.1. Care has to be taken when examining this data, as it is not based on randomized trials and photon technology was a lot less ecient than it is nowadays. Survival The total energy deposited is also often referred to as integral dose deposited in literature, despite it is not the correct expression. 4
![It has been shown that the total energy deposited 7 by proton therapy is about half that of photon IMRT [9].](/docs-images/44/9620868/images/page_14.jpg "High LET particles like carbon ions have additional advantages: they produce more damages in the tumor located in Bragg peak and they allow to treat tumors radio resistant to low-let particles like")
15 1.3. RATIONALE FOR HADRON THERAPY Figure 1.5: Meduloblastome irradiation: This gure depicts the larger total energy deposited by photons when compared to protons for the body (From IBA). Neutrons Neon ions Conventional (%) (%) (%) Salavary gland (local control) Paranasal sinus (survival) Sarcoma (local control) Prostate (local control) Table 1.1: Local control and survival rates obtained using neutrons, neon ions and photons (From [3]). Details about data estimation can be found in [3]. rate improvement has been demonstrated more recently in Japan (NIRS) based on a review of clinical experience for 1601 patients treated between 1994 and 2003 using carbon ions, with an acceptable morbidity [12]. As of March 2010, 5196 patients have been registered at NIRS [13]. In Germany, similar encouraging results have been obtained in a pilot study using carbon ions, but with a lower number of patients [14, 15]. The clinical results obtained have been particularly promising for some radio resistant, inoperable and usually incurable cancers. Carbon ions (compared to photons) have been shown to improve patient outcomes for locally advanced head and neck tumors, early stage non-small cell lung cancer, locally advanced bone and soft tissue sarcomas not suited for surgical resection, locally advanced hepatocellular carcinomas, locally advanced prostate carcinomas, chordoma and chondrosarcoma of the skull base and cervical spine and post-operative pelvic recurrence of rectal cancer [12]. Of major concern is also the selection of the most suited ion modality between protons and carbon ions, as discussed in [16]. The discussion is rather complicated, as it depends on the protocol, dose, dose per fraction, number of fractions, etc. Based on [16], we selected a few signicant results showing the superiority of ions (either protons or carbon ions) over photons. For skull base chordoma, ve-year local control rates were reported to be 50-53% for photons (64 Gy (BED 8 )) and up to % using ions (72-96 Gy (BED)). In the case of uveal melanoma, survival rates are equivalent, but ions result in a drastic reduction of enucleations: about 13% with photons and 5-8% with ions. For head and neck cancers, four year local control rates obtained using either photons alone or a combination photons/carbon ions were 25% and 78%, respectively. For hepatocellular carcinoma, control rates of 19-25% at 2.4 years using photons (66 Gy (BED)) and 81-96% at 5 years using ions (67-84 Gy 8. BED: Biologically Eective Dose [16, 3], corresponding to D IsoE, as dened in section
![Table 1.1: Local control and survival rates obtained using neutrons, neon ions and photons (From [3]). Details about data estimation can be found in [3].](/docs-images/44/9620868/images/page_15.jpg "rate improvement has been demonstrated more recently in Japan (NIRS) based on a review of clinical experience for 1601 patients treated between 1994 and 2003 using carbon ions, with an acceptable")
16 CHAPTER 1. PROJECT CONTEXT (BED)) were reported. In summary, hadron therapy using proton or carbon ion beams can drastically improve patient outcomes for some specic tumor sites. Their physical characteristics allow reducing the dose to healthy tissues, increasing the dose to the tumor and lowering the risk of secondary induced cancers. Moreover, the high-let characteristics of carbon ions lead to a higher RBE in the cancerous area, allowing treating tumors radio resistant to low-let radiations. In Europe, epidemiological studies have evaluated that ion beam therapy could benet patients in about % of all radiotherapy treatments (about 6% of all cancer treatments) [17, 18]. 1.4 Cost eectiveness of hadrontherapy A very important point to bring novel and promising techniques such as hadrontherapy in clinical practice is the cost, which is very complex to evaluate. Radiation therapy (RT) costs only 5% of the overall oncology budget [19], which is an important number to keep in mind. If the running costs are clearly higher in hadrontherapy than in conventional radiotherapy, it was stated since 1998 that ions can be cost eective if we consider the global cost, including the cost of failure from less eective treatments [20]. In 2007, it was presented in a systematic literature review of hadron therapy centers [21], that there were little reliable evidence-based data available concerning the cost-eectiveness of hadrontherapy. In 2008, proton therapy was estimated to be about 2.4 more costly than conventional RT, with an average cost of 25,000 e per treatment [19]. This cost depends on the treatment protocol used, as well as the aspects of service delivery, e.g. number of fractions, number of beams per fraction, operating hours per day, number of treatment rooms, quality assurance modalities and technical equipment required [19]. In 2010, a detailed estimation of the costs for carbon, proton and conventional RT was proposed in [22], for combined proton/carbon, proton-only and photon facilities. General costs are presented in Table 1.2 and treatment costs for some specic locations are presented in Table 1.3. Table 1.2 Combined Proton-only Photon Capital costs (million e) Total cost per year (million e) Mean cost per fraction (e) Table 1.2: Cost estimation of radiation therapy for combined (proton and carbon), proton-only and photon facilities. Numbers taken from [22]. Tumor site Carbon Proton Photon Cost (e) Fractions Cost (e) Fractions Cost (e) Fractions Prostate 12, , , (IMRT) Lung 10, , ,720 4 (SBRT) 8, (3DRT) Head &neck 30, , , (IMRT) Skull-base chordoma 25, , , (FSRT) Table 1.3: Treatment costs for four dierent tumor sites using carbon ions, protons delivered in proton-only facilities and photons. Dierent photon techniques exist: IMRT (Intensity Modulated RT), SBRT (Stereotactic body RT), 3DRT (3 dimensional RT), FSRT (Fractionated stereotactic RT). Numbers taken from [22]. 6

17 1.5. GEANT4 & GATE MONTE CARLO CODES shows that the capital costs, yearly costs and mean costs per fraction are the most expensive using carbon ions, then using protons and the cheapest using photons. However, Table 1.3 shows that for some cases, proton and carbon ion treatments can be cheaper than photon treatments, e.g. for prostate cancer. For the tumor sites presented, carbon treatments are cheaper than proton treatments, mainly because of a reduced number of fractions (Table 1.3). This study presents the costs from RT treatments, but does not take into account the treatment ecacy [22]. The full cancer treatment costs includes also surgery and drug delivery, which can cost much more than RT (more than 60,000 e for some chemotherapy treatments). The full cost of cancer treatment, including surgery, hospitalization, radiation therapy and also the cost of recurrence (pondered by the probability of recurrence) has been presented for skull-base chordoma in [23]. The results of the analysis for the best achievable treatments using photon therapy and carbon therapy are presented in Table 1.4. The cost of the primary treatment includes the cost of surgery (11,000 e) 5 year local control rate Cost of primary treatment Cost of recurrence Total cost (e) (e) (e) 50% (photon therapy) 27,100 40,735 67,835 70% (carbon therapy) 43,600 24,441 68,041 Table 1.4: Overall treatment costs for skull-base chordoma, including the cost of recurrence. Numbers taken from [23]. and hospitalization (12,600 e), i.e. 23,600 e in total. For information, the mean overall cost for patients with recurrent chordomas was estimated to about 121,710 e using medical records from 10 patients [23]. This analysis provides some evidences that hadrontherapy can be cost eective for some treatments using a combination of surgery and radiations and for which a clear increase of the control rate exists. It shows that the overall treatment costs have to be evaluated and not only the costs of hadrontherapy versus photon therapy. Other very important aspects, which can not be quantied in terms of money, are the invaluable benets for the patients in terms of reduced side eects and increased control rates, when using hadrontherapy. 1.5 GEANT4 & GATE Monte Carlo codes GEANT4 (GEometry ANd Tracking 4) [24, 25, 26] is a versatile C++ Monte Carlo simulation toolkit developed at CERN 9. It has been initially created for high energy appications up to about 100 TeV and now allows for very low energy applications down to a few ev. As a particle physics simulation toolkit, GEANT4 simulates all kind of particles, including exotic particles. A large number of processes, models, cross-sections and simulation parameters are available and they have to be carefully selected depending on the application. Available models are growing continuously [27] and are historically divided into three categories: data-driven, parameterized and theory-based models. The data-driven approach is considered to be the optimal way of modeling [27], but models are not strictly data-driven, theory-based or parameterized: for instance, a data-driven model can be parameterized for some parts if data is missing. For medical applications, various validation studies have been proposed, covering the validation of the photon and electron physics for conventional radiotherapy and the validation of electromagnetic and nuclear interactions for carbon ion and proton therapy applications [27, 28, 29, 30, 31, 32, 33, 34, 35, 36]. GATE (Geant4 Application for Emission Tomography) is an advanced open source software developed by the international OpenGate 10 collaboration and is dedicated to numerical simula


18 CHAPTER 1. PROJECT CONTEXT tions in medical imaging and radiotherapy. The GATE Monte Carlo software has been initiated in 2001 to facilitate the use of the GEANT4 Monte Carlo code for imaging simulations and was rst released in 2004 [37]. It currently supports simulations of Positron Emission Tomography (PET), Single Photon Emission Computed Tomography (SPECT), Computed Tomography (CT) and Radiotherapy experiments [38] (Figure 1.6). Developments for radiotherapy applications have been rst initiated within the SimCa2 ANR project ( ) by researcher from CRE- ATIS 11 [39, 40]. Later, they have been merged within the GATE framework and rst released in 2010 [38]. As it is based on the GEANT4 toolkit, GATE benets from its exibility and al- Figure 1.6: Dose distribution simulated of a 12 C irradiation inside a thorax (a), with the corresponding simulated PET image of the resulting 11 C (b) and 15 O (c) isotope distributions (From [38]). lows dening complex geometries. It includes the management of time during simulations and remains compatible with the latest GEANT4 releases each year. It uses an easy-to-learn macro mechanism allowing conguring simple or highly sophisticated experimental settings. The macro les describe the physics specications, geometries, source of primary particles and management of outputs in various formats. Faster Monte Carlo codes exist, as for instance VMCpro, which is dedicated to proton treatment plan simulation [41]. The main interest of a slower and detailed Monte Carlo simulation such as GATE/GEANT4 is its versatility: it can be used as a reference Monte Carlo code for validation purposes, it allows combined imaging and dose simulations, micro-dosimetric applications, radiotherapy simulations using dierent particles such as photons, electrons, protons or carbon ions. From a practical stand point, having a common platform handling various medical physics applications is of great interest, especially with the progress of image-guided radiotherapy and requirements of high precision patient dose calculation. 1.6 Proton beam delivery techniques Cyclotron-based proton beam production This section briey describes how to produce a clinical proton beam based on the IBA speci- cities. The proton beam is produced with a xed energy cyclotron of 230 MeV. At the cyclotron exit, an Energy Selection System (ESS) is used to degrade the beam energy to lower energies. The ESS is a carbon wedge of variable thickness, with associated momentum and divergence slits. The carbon wedge allows for degrading the beam energy from 230 MeV down to 70 MeV, while
![It currently supports simulations of Positron Emission Tomography (PET), Single Photon Emission Computed Tomography (SPECT), Computed Tomography (CT) and Radiotherapy experiments [38] (Figure 1.6).](/docs-images/44/9620868/images/page_18.jpg "Developments for radiotherapy applications have been rst initiated within the SimCa2 ANR project (2007-2010) by researcher from CRE- ATIS 11 [39, 40].")
 using several quadrupoles. An overview of the system is given in Figure 1.7.")
19 1.6. PROTON BEAM DELIVERY TECHNIQUES the associated slits maintain the beam energy spread and divergence (spot size) within clinical requirements. The beam is then transported into the treatment rooms thanks to the Beam Transport System (BTS) using several quadrupoles. An overview of the system is given in Figure 1.7. Other accelerators called synchrotrons, produce beams of variable energy are also used in some Figure 1.7: Schematic view of an IBA delivery system. (From IBA) clinical centers Passive scattering There are two main families of beam delivery, namely passive scattering and active scanning. Passive scattering consists in producing a broad beam, which is further collimated transversally to conform to the tumor shape. The distal part of the tumor is conformed thanks to a range compensator, at the expense of the proximal part. Collimators and range compensators are produced specically for each patient and each eld using milling machines. To deliver a homogeneous in-depth dose distribution in the tumor, a SOBP is produced by a range modulator, which is basically a wheel with steps of variable thicknesses. By combining beam current modulation and range modulator rotation, various modulations (SOBP thicknesses) can be obtained. For large elds the double scattering technique is used, while for small elds the single scattering technique is also available, with an advantage of sharper penumbra. The double scattering technique is currently the most commonly used worldwide and is illustrated in Figure Pencil Beam Scanning (PBS) Active scanning systems typically do not include any scattering device in the nozzle. Pristine Bragg peaks of a few millimeters in diameter (about 3-7 mm standard deviation) are scanned transversally in two lateral directions at average speeds of 1-10 mm/ms, depending on the axis 12. To conform the dose to the tumor in depth (longitudinal direction), the beam energy is modied 12. The parameters given correspond to the IBA system and might be dierent for other systems. 9

20 CHAPTER 1. PROJECT CONTEXT Figure 1.8: Schematic view of the IBA double scattering system. Transversal (blue) and logitudinal (red) view of the beam at the nozzle entrance (a), after the rst scatterer (S1) and the Range Modulator (RM) wheel (b), after the second scatterer (c) and nally at the patient level after the collimator and range compensator (d). (From IBA) at the ESS level (Figure 1.9). This irradiation technique is currently the most advanced and allows Figure 1.9: Schematic view of the active beam scanning treatment modality. The tumor is treated by scanning transversally the beam in dierent iso-energy layers (From GSI). conforming better to the tumor shape and sparing healthy tissues [9]. IBA uses the spot-scanning technique, for which the beam is turned o between two spot irradiations, as opposed to the continuous-scanning technique, for which the beam is turned-o only between two layers. The PBS delivery technique has been used since the end of 1996 at the Paul Scherrer Institute (PSI) in Switzerland for proton therapy [42] and since 1997 at the Gesellschaft für Schwerionenforschung (GSI) in Germany with carbon ions [43]. An alternative to passive scattering and PBS techniques is called uniform scanning (or wobbling). It consists in producing a broad beam using scanning magnets. The tumor is then irradiated layer by layer by changing the energy using the range modulator wheel in static mode and by using appropriate collimators. 10
.")
21 1.7 Treatment Planning Systems (TPS) 1.7. TREATMENT PLANNING SYSTEMS (TPS) The radiotherapy treatment of a patient is prescribed by oncologists. The prescription corresponds to a dose of radiation to be delivered in the tumor using a given type of particles and appropriate dose constraints to the surrounding tissues and organs at risks (OARs). The dose constraints, number of elds and eld positions are entered manually by the medical team into the TPS, based on the clinical experience. Further, the TPS calculates and optimizes iteratively the dose delivered by each eld in the tumor and in the various OARs. The optimization is an iterative process, which consists in minimizing a cost function. Methods based on gradient algorithms are commonly used, but dierent approaches exist [44, 45, 46, 47, 48]. For the PBS modality, the optimization consists in adjusting the uence of several thousands of pencil beams [42]. This iterative process is called inverse planning [49]. The dose calculation accuracy depends on the physical interaction modeling in the patient. In order to correctly account for heterogeneities this a critical point. The most common dose calculation algorithm currently used is called Pencil Beam and has to be clearly distinguished from the PBS delivery technique. It has been developed based on a previous algorithm called Ray Tracing (or Ray Casting or Broad Beam). Dose calculations in patients are based on measured data, which are further rescaled based on water equivalent path length approximations. The water equivalent depth of a point corresponds to the thickness of water leading to the same energy loss. It is calculated from the integration of the electronic densities or stopping powers along the direction of an innitesimal photon or ion beam, respectively [50]. Ray tracing algorithms neglect the surrounding heterogeneities around the ray and can lead to misleading results [50]. The pencil beam algorithm consists in representing the initial beam as a collection of innitesimal pencil beams (also called beamlets) and superimposing their contributions. This technique has been proved to take better into account heterogeneities and is still the method of reference in current practice for protons and carbon ions [51, 52, 53, 54, 46], as demonstrated in Figure The number of beamlets used is a trade-o between precision and time. Improving the calculation time is still under current investigations [55, 56]. 1.8 Objective of the project Our project was to develop a Monte Carlo platform for hadron therapy simulations of active scanning systems, with a further objective of TPS benchmarking. Monte Carlo simulation is considered to be the reference in medical physics and is therefore a relevant tool to evaluate TPSs. Limitations of anaytical algorithms as currently implemented in TPSs have been pointed out in the previous section. While electromagnetic interactions are rather well understood, nuclear interactions are complex and dicult to model analytically. At the maximum therapeutic energies, nuclear interactions are responsible for about 10-15% of the dose delivered in proton [57] treatments and for about 40% of the dose delivered in the region before the Bragg peak for carbon ion therapy [35]. The biological eective dose computation is more complex for carbon ions than for proton therapy, because of nuclear fragmentation. It depends on the 3D particle, dose and LET spectra distributed throughout the volume [3, 58]. Obviously, it also depends on the biological model used [3]. From a dose quality assurance stand point, it seems very attractive to recompute clinical treatment plans and revisit clinical decisions based on Monte Carlo simulations. In the case of proton passive spreading systems, an extensive use of GEANT4 has been performed at the Massachusetts General Hospital in Boston for several years [59]. Simulation of proton active scanning systems is of growing interest with the recent progresses of this new delivery technique [60, 61]. Beside dose calculations, Monte Carlo oers the possibility of simulating very complex setups in order to better understand the role played by the various physical processes and to improve TPS dose 11
22 CHAPTER 1. PROJECT CONTEXT Set-up Ray tracing Pencil beam Figure 1.10: Proton integral depth-dose distributions (a,b) at 3 energies in a heterogenous phantom described on the top: between 3 and 5 cm adjacent lung and bone tissue, rest is soft tissue. TPS calculations are compared to reference Monte Carlo simulations. (a) corresponds to a ray tracing algorithm and (b) to a pencil beam algorithm using 49 sub-spots per original spot (From [46]). calculation algorithms. The power of such codes makes it possible to investigate other research areas, as for instance the production of β + emitters (such as 11 C or 15 O) [62, 63, 64] following proton or carbon irradiations, the prompt emission of γ-rays or secondary protons occurring during non-elastic nuclear collisions [65, 66, 67, 68] and their correlations with the Bragg peak position in the patient. Despite the fact that several Monte Carlo codes and applications are available (such as MCNPX [69], PHITS [70], SHIELD-HIT [71], FLUKA [72], GEANT4 [26]), they are currently not easy-to-use platform for hadron therapy simulations. This crucial point was of major concern in our project. In this work, we choose to upgrade the GATE Monte Carlo platform, because not only does it take advantage of the exibility and power of GEANT4, it also supports imaging simulations and simplies the use of Monte Carlo for medical physics applications. We focused on the simulation of an IBA proton PBS system and compared dose distributions with those given by the XiO (Elekta) TPS. All developments were performed with the further objective of being adaptable to ion beam therapy and compatible with the DICOM standard. 12
23 Chapter 2 Physics and Biology of hadrontherapy In this chapter, key concepts relative to the physics and biology of hadrontherapy are presented, with a strong focus on the physics of proton therapy. 2.1 Physics of hadrontherapy Stopping power The main advantage of ions over photons is that ions stop within matter at a known depth, with a maximum energy deposition in the Bragg peak. This eect is characterized by the stopping power, dened in [73] as the average energy loss per unit path length, resulting from Coulomb interactions with electrons and atom nuclei. A detailed review of this eect has been proposed in [74]. The electronic stopping power (or collision stopping power) has a predominant contribution, while the nuclear stopping power has only a minor eect, as illustrated in Figure 2.1. The energy loss of ions within matter can be almost fully attributed to the electromagnetic stopping power. In comparison, elastic nuclear collisions contribute very little to the energy loss above 1 MeV and represent less than 0.1% of the total energy loss [75]. Radiative stopping power is also completely negligible at therapeutic energies and its contribution is even lower than elastic nuclear interactions [75]. Nuclear interactions are discussed separately and will be presented in section The electronic stopping power depends on the interaction distance between the primary ion and the target electron, called impact parameter (b). Depending on the impact parameter, the target atom can be either excited by launching the electron to a higher orbital or be ionized by ejecting the electron. Maximum energy electrons, which are able to ionize other atoms are called δ electrons. The mass collision stopping power can be written as follows (Bethe-Bloch equation) [73]: S col ρ = 1 ρ ( ) de = 4πr2 emc 2 1 dx el β 2 u Z A z2 L(β) (2.1) where r e = e 2 /mc 2 is the classical electron radius, mc 2 is the electron rest mass energy, u is the atomic mass unit, β is the particle speed in units of light speed, Z and A are the atomic number and relative atomic mass of the target atom, and z the charge number of the projectile. This equation is also referred to as non-restricted stopping power, as opposed to the concept of restricted stopping power, which includes only energy loss due to collisions with an energy transfer lower than a given energy threshold. The concept of restricted stopping power has dierent applications: it is a useful quantity for instance in Monte Carlo simulation, in order to split the 13
24 CHAPTER 2. PHYSICS AND BIOLOGY OF HADRONTHERAPY Figure 2.1: Total, electronic and nuclear stopping power of protons in water (From NIST, PSTAR [76]). continuous energy loss attributed to the primary ion with energy transfers lower than and the discrete energy loss due to the explicit production of secondary electrons with energy transfers larger than. Other applications are discusssed in section One strong assumption of the Bethe-Bloch equation is that the ion is much faster than the electron [74]. At low speed, the particle may capture electrons from the target and partially neutralize its nuclear charge [74]. The Bethe-Bloch equation is assumed to hold for energies larger than 1 MeV/u [74]. The gross features of the energy-loss precede the quantity L, called stopping number, which accounts for ne corrections. with the rst term L = L 0 (β) + zl 1 (β) + z 2 L 2 (β) (2.2) L 0 (β) = 1 ( 2mc 2 2 ln β 2 ) W m 1 β 2 β 2 ln(i) C Z δ 2 where I is the mean excitation energy of the medium, C/Z the shell correction and δ/2 the density-eect correction. Shell eects are due to the assumption of much larger ion speed compared with electron speed and breaks down in the low-energy region. At 100 and 10 MeV/u, the shell correction modies the stopping power by about 1 and 6%, respectively [74]. Density eect corrections only play a role for very high energy relativistic particles, due to the dielectric properties of the medium and polarization eects. At 1 GeV, the correction only accounts for about 1% [74]. L 1 and L 2, also called Barakas and Bloch corrections, account for charge sign and large impact parameter eects, respectively. To illustrate the relative contribution of each stopping number, in the case of a 10 MeV proton beam in silver, the terms L 0, L 1 and L 2 contribute by about 98.8%, 1.1% and 0.1%, respectively [74]. At therapeutic energies, the Bloch, Barakas, (2.3) 14
25 2.1. PHYSICS OF HADRONTHERAPY density and shell eect corrections can be neglected, as their corrections are small [77]. As the quantity 4πremc 2 2 /u = MeV cm 2 g 1 [74], equation 2.1 can be simplied as follows: S col ρ = [ ( Z 1 2mc 2 β 2 A z2 2 ln β 2 ) ] W m 1 β 2 β 2 ln(i) (MeV cm 2 g 1 ) (2.4) The main source of range uncertainty comes by far from the ionization potential I [77, 78]. In theory, it can be calculated from atomic structure, but it is not suciently accurate. In practice, it is adjusted to agree with experimental data for elements where data exists [75, 77]. The assumption of additivity, as proposed by Bragg [79], raises more complicated issues for compounds of several elements. In [75], inconsistent results concerning the additivity rule were found. In [73], dierences between experimental I-values and approximated I-values from the additivity rule were found to be smaller than experimental uncertainties in most of cases. When experimental data are lacking, the stopping power of compounds are calculated using the additivity rule. This approximation can lead to errors of about 15% or more, especially at low energies near the Bragg peak [73]. These errors are related to chemical binding eects from the dierent constituents and material phase (as gas or solids) [73]. The range uncertainty associated with I is estimated to be about 1-2% in compounds [77]. Uncertainties of tabulated stopping power for elements and compounds are stated to be within 1-2% and 1-4%, respectively [73]. To illustrate these uncertainties, the currently used I values are 75 ev [73] and 81 ev [75]. Of interest also is the calculation of the maximum energy (T max ) transfered to secondary electrons: T max = 2mc2 (γ 2 1) 1 + 2γ m M + ( ) m 2 (2.5) M where M is the ion mass (at rest) and γ the Lorentz factor. For illustration, the range-energy relationship for a few clinical proton energies and the associated maximum δ electron energies are presented in Table 2.1. Protons Energy 230 MeV 200 MeV 150 MeV 100 MeV 50 MeV CSDA range cm cm cm 7.72 cm 2.23 cm Projected range cm cm cm 7.71 cm 2.22 cm Electrons T max 562 kev 482 kev 353 kev 229 kev 112 kev CSDA range 2.0 mm 1.7 mm 1.1 mm 0.6 mm 0.2 mm Table 2.1: Proton CSDA and projected ranges, as dened in section 2.1.3, in water. They are calculated according to the NIST PSTAR database [76]. The maximum energy transfered to the electrons is calculated using equation 2.5 and the associated CSDA range in water relies on the NIST ESTAR database [80] Linear energy transfer (LET) The radiation quality refers to the features that inuence the eectiveness of an irradiation. For constant physical factors such as dose, dose rate and fractionation, the eectiveness of an irradiation may vary, because of changes in the spatial dose distribution and energy transfers along and within the particle tracks [81]. In 1947, Gray introduced the concept of mean linear ion density [81]. However, ionization is dicult or impossible to measure or even to dene in solids and liquids. In 1952, Zirkle et al introduced the concept of Linear Energy Transfer (LET) [81], 15
26 CHAPTER 2. PHYSICS AND BIOLOGY OF HADRONTHERAPY which is also related to radiation quality and is easier to measure. The LET is often expressed in MeV/mm (or kev/µm). In ICRU'16 [81], the LET is dened as follows: ( ) de L = (2.6) dl where L is the LET, de is the mean energy loss due to collisions with energy transfer less than some specied value and dl is the distance traversed by the particle. For instance, L 100 designates the LET when = 100 ev and the symbol L designates the LET when all possible energy transfers are included [81]. Therefore, L and L correspond to the restricted and nonrestricted collision stopping powers, respectively, as dened in section For mixed radiation elds, distributions of LET occur and two denitions of average LET values have been proposed: dose average LET (L D ) and track average LET (L T ) [81]. The dose average LET (L D ) is dened as follows: L D = 0 d(l)ldl (2.7) where d(l) is the distribution of dose in unit of LET, so that d(l)dl corresponds to the fraction of the total dose having a LET L. The track average LET (L T ) is dened as follows: L T = 0 t(l)ldl (2.8) where t(l) is the distribution of track length in unit of LET, so that t(l)dl corresponds to the fraction of the total track length having a LET L. Dierences occur between these two denitions and they also depend on the cut-o selected. Therefore, it is important to specify which LET denition is used [81]. For radiation protection, the International Commission on Radiological Protection (ICRP) and the Internal Commission on Radiation Units (ICRU) specied Quality Factors (QF) for radiations as a function of LET (L ) [81]. Of course, the eectiveness of radiations depends not only on the LET, but also on the particle type, cell type, endpoint and dose. Therefore, the QF are rough estimations, which deliberately overestimate the real eects of radiations. A few values are summarized in Table 2.2: L in water QF kev/µm Table 2.2: Radiation eectiveness (QF) as a function of LET [81]. For mixed radiation elds, the average QF factor can be estimated as follows: QF = where d is the distribution of absorbed dose as a funtion of LET. 0 QF (L)d (L)dL (2.9) 16
27 2.1. PHYSICS OF HADRONTHERAPY The LET is also a useful quantity in radiobiology, which strongly inuence the RBE of ion beams, as dened later in section Dierent radiations having the same d will not necessarily have the same biological eects; however, the possibility exists that this would be the case for some values of, with depending upon the circumstances [81]. The LET is approximatively proportional to z 2 /v 2, with z and v being the ion charge and speed, respectively. As ions lose energy, their speeds (v) decrease, which results in an increased ionizing density, more specically in the Bragg Peak. Moreover, as heavier ions such as 12 C have a larger z than protons, they have a higher LET. Clinicians distinguish high-let particles like carbon ions from low-let particles like protons, because they have a higher RBE, as discussed in section Range/Energy relationship The penetration depth of ions in matter is characterized by the range (or the mean range), dened as the depth for which half of the primary ions that did not undergo a non-elastic nuclear interaction stop [77]. Range measurements are possible using a uence meter such as a Faraday cup. As depth-dose proles are routinely measured, it was necessary to link the range with a specic dose point. It has been shown that the range corresponds to the distal 80% dose point [77], as illustrated in Figure 2.2 (a) for protons. This point is almost independent of the energy spread, which makes it very useful. When treating patients, physicians want to adjust the Bragg Peak range dened as the distal 90% dose point (clinical range), for safety. Therefore, one has to be careful when talking about range, as two dierent denitions are used. (a) (b) Figure 2.2: This gure presents the correlation between particle uence and dose (a). (a) Top: depth-uence measurement for a proton beam of xed mean energy, using 3 dierent energy standard deviations. (a) Bottom: corresponding depth-dose proles. (From [77]). (b) Rangeenergy relationship (From [82]). The proton average path length S av is dicult to measure, in contrary to the average penetration depth z av, which corresponds to the mean range [73]. In fact, protons undergo scattering interactions and S av is always larger than z av. The ratio S av /z av is called the detour factor [73]. A common range-energy relationship used in ICRU [73] or NIST [76] tables is based on the Continuous-Slowing-Down Approximation (CSDA). CSDA ranges are given by integrating the reciprocal of the total stopping power (collision plus nuclear) with respect to energy [76]. In these tables, projected ranges and detour factors are also available. It is shown in [73], that dierences 17
28 CHAPTER 2. PHYSICS AND BIOLOGY OF HADRONTHERAPY between CSDA range and S av, and between projected range and z av can be disregarded for all practical purposes. Therefore, the CSDA approximation can be considered as exact. Dierences between CSDA and projected ranges are presented in Table 2.1. A logarithmic relationship between the proton energy and range has been established in [82], based on the ICRU'49 tables [73], so that ln(energy) ln(range) (Figure 2.2 (b)) Range straggling As physical interactions are stochastic, the number of collisions along the ion range varies, so that all ions do not stop at exactly the same depth. This eect is known as range straggling (or energy straggling). The most probable proton energy loss in individual collisions is of the order of 20 ev [73]. In light elements and gases, 4/5 of all losses are lower than 100 ev [73]. Straggling depends almost only upon the inelastic Coulomb interaction with atomic electrons. However, at low energies below about 1 MeV, elastic nuclear collisions and charge exchanges start to signicantly contribute to the range straggling [75]. The total energy loss, in a track segment of length s, is a stochastic quantity, whose distribution is described in terms of Straggling function F (, s). The straggling distribution is often modeled using a Gaussian, considered as a good approximation [73, 82]. For long track sections, the straggling function is described in [73] as follows: F (, s) = 1 2π Ω exp ( ( av ) 2 ) (2.10) 2 Ω 2 with Ω 2 being the variance, which is proportional to the inelastic Coulomb scattering cross-section, av the mean energy loss, which is equal to the product of the path length s and the stopping power. Several expressions for the variance are available. We choose to present the following [73]: Ω 2 = ksw m (2.11) where W m is the maximum energy loss in a single collision, k=2πr 2 emc 2 z 2 NZ/β 2 and N is the number of target atoms per unit volume. Range straggling increases with the particle path length and has an impact on the Bragg peak width. Its standard deviation is material dependent and depends almost linearly on the range, as illustrated in Figure 2.3. In water, the range straggling is approximatively equal to 1.2% of the mean range [77]. Figure 2.3: Proton range straggling in various materials, with R 0 the mean range and σ s the range straggling standard deviation (From [77]). 18
29 2.1. PHYSICS OF HADRONTHERAPY Nuclear stopping power It is noteworthy that the term nuclear stopping power is customarily used in literature, even though it pertains on energy loss due to electromagnetic interactions [73]. The nuclear stopping power deals with Coulomb scattering interactions with atom nuclei screened by atomic electrons. It has to be dierentiated from nuclear (elastic and non-elastic) interactions, which are presented in section Usually, the nuclear stopping power is obtained by calculating the elastic Coulomb scattering cross-section and then the energy transfer to recoil nuclei [73]. The elastic scattering cross-section is a function of the center-of-mass deection angle θ and impact parameter p [73]. Such interactions are described by a potential function, which takes into account the Coulomb potential for two bare nuclei (nucleus free of orbital electrons) and the screening potential from atomic electrons [73]. The screening is characterized by a universal screening function, which depends on the screening length r s [73]. Interactions within the electromagnetic eld of nuclei screened by atomic electrons are responsible for most of the scattering undergone by incident particles, as described in section Relativistically, the maximum energy that can be transferred from an incident ion to the recoiling atom corresponds to equation (2.5), with appropriate ion and target nucleus masses replacing the electron and proton masses, respectively [75]. A simplied formula is given in ICRU'49 [73]. W m = 4T M t M (M t + M) 2 (2.12) where W m is the maximum energy transfered, T the projectile energy, M and M t the projectile and target atom masses, respectively Multiple Coulomb scattering Proton scattering is mainly the result of deections by atomic nuclei [75]. Indeed, as the electron mass ( 511 kev/c 2 ) is about times lower than that of protons ( 938 MeV/c 2 ), they hardly deect primary protons [77]. This is also the reason why heavier ions like carbon ions are deected much less than protons, which results in a better penumbra for clinical practice. The mass ratio also explains why electrons suer much more from range straggling and transverse spreading than ions. Center-of-mass deection angle θ presented previously in section corresponds to single scattering interactions. Multiple Coulomb Scattering (MCS) theories allow computing the mean scattering angle resulting from many single scattering collisions. They are derived from elastic scattering cross-sections by means of numerical integrations [75]. The main contribution to multiple Coulomb scattering theories was developed by Molière in His theory was found to be accurate to better than 1% on average for protons [83] and is now considered as a denitive solution [77]. Multiple Coulomb scattering theory describes the shape of the particle angular distribution and its characteristic width. The shape is known to be nearly Gaussian for small angles (<10 ) and to deviate markedly from a Gaussian shape for larger angles [83]. Other scattering theories were also developed as for instance by Hanson, Highland, Lynch or Rossi, as presented in the review from B. Gottschalk [83]. Molière's theory directly gives the rms 1 multiple Coulomb scattering angle, at any incident energy, for homogeneous slabs of any element, compound or mixture, from very thin to near stopping thicknesses [84]. For practical purposes, as for instance patient dose calculation, it is of interest to be able to compute the mean scattering angle or transverse dose spreading of a proton beam at every depth in heterogeneous geometries. This approach is not directly available in multiple Coulomb scattering theories and step-size dependent approximations were developed. Similarly to the 1. rms stands for root mean square and corresponds to the standard deviation. 19
30 CHAPTER 2. PHYSICS AND BIOLOGY OF HADRONTHERAPY stopping power (S de/dx), the scattering power (T < θ 2 > /dx) of ion and proton beams have been investigated recently in [55, 84], in order to compute multiple Coulomb scattering angle variations at every depth without step-size dependence. As the calculation details of Molière's theory are quite long and complex, they will not be detailed here, but useful information can be found for instance in [83, 84, 55]. Instead, the Lynch and Dahl's formula, which has the same form as Highland's equation and recognized to be simple and accurate is presented [77]. θ L = 13.6 MeV pv z L L R [ log 10 ( LLR )] (2.13) where θ L is the mean scattering angle, p and v the particle momentum and speed, z the projectile charge number and L and L R the target thickness and radiation length expressed with the same unit (for instance g/cm 2 ). This formula is valid in the case of thin slabs. To compute the mean scattering angle at any depth in a thick target, one can apply the Lynch and Dahl's formula over innitesimal targets and integrate the contributions in quadrature, as proposed in [83]. Interestingly, it was shown that the proton beam spreading can be expressed as a universal law, by expressing σ/σ R0 as a function of T/R 0, with σ and σ R0 being the beam standard deviations at depth T and R 0, and T/R 0 being a fraction of the initial range R 0 [77] (Figure 2.4). Figure 2.4: Universal relationship between proton range and transverse dose spreading. Open triangles, solid triangles and open circles are experimental results for 112 MeV protons on aluminum, 158 MeV protons on aluminum and 127 MeV protons on water, respectively (From [77]) Nuclear interactions In contrast with the nuclear stopping power, which results from interactions in the electromagnetic eld of the target nuclei screened by atomic electrons (section 2.1.5), nuclear interactions are due to nucleus-nucleus collisions and deal with the strong interaction force. Nuclear reactions can be split into two main categories according to ICRU'63 [85]: elastic: the incident projectile scatter o the target nucleus with the total kinetic energy conserved (the internal state of the target nucleus and projectile are unchanged). non-elastic: as opposed to elastic, the total kinetic energy is not conserved. The target nucleus may undergo break-up, excitation to a higher quantum state or particle transfer. In the case of ions heavier than protons, the projectile may also be fragmented. 20
31 2.1. PHYSICS OF HADRONTHERAPY A third category called inelastic has been dened as a special type of non-elastic reaction, in which the nal nucleus is the same as the bombarded nucleus. The term nuclear interaction is customarily used in literature to designate non-elastic nuclear interactions, because it is the most important nuclear process. The main eect of nuclear interactions is due to non-elastic collisions, which reduce the primary uence of particles with depth [85]. For protons, a mean uence reduction in the order of 1.2%/(g/cm 2 ) is given in [82], as illustrated in Figure 2.2. The probability that a stopping proton undergoes a non-elastic nuclear interaction increases with beam energy and about 25% of the incident protons undergo nuclear interaction, assuming an incident energy of 230 MeV (32 g/cm 2 ), as illustrated in Figure 2.5 (b). However, the maximum non-elastic nuclear cross-section occurs at about MeV (Figure 2.5 (a)). At 230 MeV, proton non-elastic nuclear interactions ac- Total non-elastic nuclear cross-section (mb) C (Z=6) (a) O (Z=8) Proton energy (MeV) (b) Figure 2.5: (a) Total non-elastic nuclear cross-sections for protons incident on carbon and oxygen target nuclei, using data from ICRU'63 report [85]. (b) Proton non-elastic nuclear interaction probability (From [85]). count for about 10-15% of the total energy deposited [57]. The secondary ejectiles (or fragments) depose their energy either at short distances (mainly charged secondaries) or at large distances (mainly neutrons and gammas) [75, 77, 73, 86]. In [57], it is considered that 1/3 of the incident particle energy is deposited locally, 1/3 belongs to long range products and 1/3 escapes (neutral secondaries). Proton non-elastic nuclear interactions are responsible for nuclear build-up at the phantom entrance [77]. This build-up is assumed to take about 2-4 g/cm 2 at energies of MeV to reach its longitudinal equilibrium [77]. As is the case for photons, an electronic build-up also exists. The electronic equilibrium is estimated at a depth of about 0.1 g/cm 2, much smaller than for photons, because of a much higher probability of electronic interaction [77]. Unlike electromagnetic interactions, nuclear interactions are less well understood and suer from larger uncertainties. Several models have been proposed to describe non-elastic nuclear interactions as for instance: the compound nucleus theory with pre-equilibrium de-excitation stage, the Intra-Nuclear Cascade (INC) with evaporation or Fermi-break-up equilibrium decay and the quantum mechanical multi-step approach [85]. An important part of nuclear interaction models is the de-excitation stage, including secondary fragments and isotope production. In carbon ion therapy, these interactions are more important than for protons and account for up to 40% of the energy loss in the region before the Bragg peak for the highest energies (400 MeV/u) [35]. The accuracy of the nuclear models is very important for therapy, because it impacts on particle and LET spectra distributions in the patient and therefore on the RBE. Light 21
32 CHAPTER 2. PHYSICS AND BIOLOGY OF HADRONTHERAPY secondary fragments (such as 4 2H e, 6 3Li or 1 1H) can deposit energy far behind the initial carbon ion Bragg-peak, as illustrated in Figure 2.6. Figure 2.6: Top: Measured depth-dose prole of a 200 MeV/u 12 C ion beam, with the associated contribution of primary ions and fragments as calculated with PHITS. Bottom: Magnied ordinate of the dose contribution from various fragments (From of [87]). Nuclear cross sections uncertainties for proton-induced reactions at therapeutic energies have been estimated in [85]. Total non-elastic cross sections are accurate to 5-10%. Angle-integrated emission spectra 2 are accurate to 20-30%. Double-dierential emission spectra 3 are accurate to 20-40% where the cross sections are large. As angular distributions are forward-peaked, backward cross sections can be lower by several orders of magnitude and uncertainties are much larger. For carbon ions, nuclear cross sections uncertainties are a bit larger [35]. This is also related to missing data, making both the development of accurate models and their evaluations dicult. 2. particle emission spectra as a function of ejectile and projectile energy 3. particle emission spectra as a function of ejectile angle and energy, and projectile energy 22
33 2.2. BIOLOGY OF HADRONTHERAPY 2.2 Biology of hadrontherapy DNA damages Radiation eects are mainly attributed to DNA damages at the cell nucleus level. The DNA represents roughly 5% of the cell nucleus volume and its size is around 10 µm in diameter. Radiations yield DNA single strand breaks (SSB) and double strand breaks (DSB). DSB are related to the number of lethal events and cell inactivation [88]. Two main eects can damage DNA: direct and indirect eects. A direct eect is a DNA break due to the incident particle, while an indirect eect is a DNA break due to free radicals produced by the incident particle in the cell environment. Photon irradiations yield mainly indirect eects, while the opposit is observed for ions. To deposit 1 Gy within a cell, about 1000 photons or 10 α particles are necessary and yield respectively or 40 DSB. The increased ionizing density around the ion track, with a transverse dose following a 1/r 2 rule [89] is responsible for this eect [88]. Dose deposit from low versus high-let particles is illustrated in Figure 2.7 (a). The track structure of ions can produce clustered DNA damages, which are more lethal than isolated damages (Figure 2.7 (b)). (a) (b) Figure 2.7: (a) Ionization density from photon-like low-let particles (left) and neutron-like high-let particles (right) (From [3]). (b) Illustration of clustered and isolated DNA damages. The production of free radicals is related to the oxygen rate in the medium. Hypoxic cells are about three times more radio resistant than well oxygenated cells [3]. The presence of 0.1-1% of hypoxic cells is sucient to make the tumor radioresistant [3]. This eect called Oxygen Enhancement Ratio (OER), is dened as the ratio of doses required to produce a given eect in hypoxic (D hypoxic ) and aerobic (D aerobic ) conditions: OER = D hypoxic D aerobic (2.14) High LET particles present the advantage of a reduced OER [90]. Historically, a reduced OER was the rationale for the introduction of high-let neutrons in radiation therapy [3]. Similar eects are produced with high-let ions (such as carbon), but with the advantage of a better irradiation ballistic The Linear Quadratic Model (LQM): Radiation eects on tissues are characterized by the cell survival rate, which is not linear with the dose (Figure 2.8). The linear quadratic (α/β) model has been commonly adopted to describe 23
34 CHAPTER 2. PHYSICS AND BIOLOGY OF HADRONTHERAPY Figure 2.8: (From [91]). Denition of the relative biological eectiveness RBE using cell survival curves the cell survival rate as a function of the dose delivered, using the following equation [3]: S(D) = exp( αd βd 2 ) (2.15) where S is the survival probability of the cells for a macroscopic dose D (in Gy). α (in Gy 1 ) and β (in Gy 2 ) are related to the probability of cell inactivation after a single hit and after two consecutive hits, respectively. They are specic to the tissue type and depend on the particle nature and energy [3]. α represents the slope at the start of the survival curve, while β explains the increased eects for higher doses. In photon therapy, the fractionation technique takes advantage of this dose response by repeating daily low dose irradiations. This allows healthy tissues to repair better than tumors. Fractionation eects are lower with high-let particles, as illustrated in Figure 2.9. However, as the LET is low in the plateau region, where healthy tissues are located Figure 2.9: Eect of fractionation on the dose-response curve for photons and ions (From [3]). 24
35 2.2. BIOLOGY OF HADRONTHERAPY and high in the SOBP, where the tumor is present, there might be some advantages of fractionation even with carbon ions, in order to decrease the NTCP [3]. The α/β ratio is an important cell parameter which describes the sensitivity of tissues to radiations: a small α/β ratio predicts radioresistant cells and vice versa. This ratio is known for most tissues irradiated with photons, even if the absolute values of α and β are not always known [3]. This also plays an important role for the prediction of late eects. In absence of precise information, α/β ratios of 3 and 10 are used to describe late and early responding tissues, respectively [3] The Relative Biological Eectiveness (RBE): RBE is a simple and unambiguous concept. Unfortunately, it cannot be uniquely dened for a given radiation, as it varies with the particle type and energy, dose, cell type, oxygenation, end-point, etc [3]. In [3], the RBE is dened as a ratio between two absorbed doses delivered with two radiation qualities, one of which is a reference radiation, that results in the same eect in a given biological system under identical conditions (Figure 2.8). Predominately, 60 Co γ rays are taken as the reference radiation quality. The RBE is usually dened as the dose required to reach a 10% survival rate, but it depends on the end-point selected, as illustrated in Figure A Figure 2.10: (From [91]). RBE as function of the LET for 3 dierent end-points: 1, 10 and 80% survival rates general rule is that the RBE increases with decreasing dose. It is sometimes higher for late eects than for acute eects, especially at low doses [3]. Clinical experience has been acquired using photons for many years. Therefore, it is mandatory to be able to convert ion doses into equally eective photon doses [3]. When prescribing the dose, oncologists have to weigh a number of factors in addition to the RBE, especially as the RBE varies with the position within the delivered eld. Therefore, the notion of weighting factor W ion has been developed in addition to the RBE [3] as follows: W ion = n xd x n ion d ion = α ion + β ion d ion α x + β x d x (2.16) the calculation is made for photon and ion irradiations leading to the same biological eect, where n and d refer respectively to the number of fractions and dose. When the same irradiation conditions are used (n x = n ion ), then W ion =RBE. When the same irradiation conditions (n x = n ion ) and the standard protocol (d x =2 Gy, 5 fractions a week) are used, then W ion =W IsoE. This factor allows characterizing the dose in terms of iso-eective dose D IsoE [3], often referred to as the Biologically Eective Dose (BED): D IsoE = D ion W IsoE (2.17) Depending on the institution, the notion of RBE is not always rigorously used and confusions between RBE and W ion occur: the RBE denition strictly corresponds to the dose ratio between 25
36 CHAPTER 2. PHYSICS AND BIOLOGY OF HADRONTHERAPY two single irradiations as presented earlier and weighting factors such as W IsoE are further used to include other clinical parameters such as fractionation, dose per fraction and total dose. When a non-conventional fractionation is applied, the iso-eective dose D IsoE (α/β) can be estimated using the following formula [3]: D IsoE [1 + d/(α/β)] = D [ 1 + d /(α/β) ] (2.18) where D IsoE and D are the total doses, and d and d are the doses per fraction, for the reference and the non-conventional fractionations, respectively. The α/β ratio is often taken to be equal to 10 or 3 Gy for early or late responding tissues, respectively [3]. This calculation accounts for dierent fractionation schemes. Additional corrections accounting for dierences in the total treatment times have to be further used. It is noteworthy to remark that the highest RBE is observed for protons and not for heavier ions [91]. In fact, the height of the maximum RBE decreases with increasing particle atomic number and is shifted towards higher LET values, as illustrated in Figure Therefore, the biological response cannot be determined solely with the particle LET: its depends also on the particle type. For protons, the maximum RBE is very localized in the distal part of the Bragg peak and the overall RBE of a treatment is lower than with heavier ions (this will be discussed later in this section). This high proton RBE occurs for a small LET (more or less 25 kev/µm) Figure 2.11: (From [91]). Schematic comparison of RBE values for various ions as a function of particle LET and is currently neglected. In the current practice, an average RBE of 1.1 is used for protons (except for some Japanese centers that use 1.0) [3]. While there is evidence of an increased proton RBE which varies with depth [92], there are still too many uncertainties in the RBE values for human tissues to propose RBE values specic to dierent tissues, dose per fraction or proton energy [93]. In [89], the high RBE of neutrons was attributed to the predominance of protons in the slowing-down spectra, as low-energy protons have very high RBE. For heavier ions, the RBE increases gradually with higher LET from the plateau to the Bragg peak region and hence has to be taken into account all along the ion path. It has been demonstrated in [89] using a 195 MeV/u (about 8 cm range) carbon ion beam, that the biological eect is mainly due to primary ions, while the secondary fragments account only for about 10-20% of the eect. Current clinical RBE conversion schemes applied to proton and carbon ions are illustrated in Figure In this gure, one can see that for carbon ions an RBE of 2.1 is calculated in the plateau region, while its values vary between 2.7 and 3.4 in the SOBP region, with a maximum RBE value in the distal part. As a consequence and in order to produce a homogeneous "biological dose" (BED) in the target, the "physical dose" calculated in the SOBP region is not at, but decreases with increasing depth. 26
37 2.2. BIOLOGY OF HADRONTHERAPY Fig. 13 Fig. 14 Figure 2.12: Biological dose modeling for carbon ions (a) and protons (b) (From [3]). RBE values shown in the left gure are only examples and do not represent generic numbers. For protons, the highest RBE value occurs in the distal part of the Bragg peak (the last microns), while for carbon ions it coincides with the Bragg maximum [94]. For heavier ions, this maximum occurs in the proximal part of the peak and consequently also aects the healthy tissues before the tumor. Therefore, carbon ions allow maximizing the RBE dierence between the tumor and the healthy tissues, in order to reduce side eects. It was for this reason that in the 1990's the Japanese and German groups choose this ion for radiotherapy applications [94]. The RBE increase is related to an increased ionization density, producing more lethal DNA damages. Above a given ionization density threshold, corresponding to a maximum RBE, an over killing eect of the cells lead to an RBE decrease (Figure 2.10). Together with the ionization density increase, high-let particles have a lower OER (as explained in section 2.2.1). Therefore, maximum RBE values occur for the most radioresistant tumors [95] and carbon ions reach RBE values of about 2-5, depending on the tumor [43] Clinical implementation of radiobiological models There are currently 2 dierent ways of prescribing biological doses to patients for carbon ion therapy [3]. The rst one has been developed in Japan and is an experimental method. The National Institute of Radiobiological Sciences (NIRS) has used a method combining radiobiological data obtained from cell survival and animal tissue response, coupled with a large clinical neutron experience, in order to predict RBE values at various positions in the carbon beam [3]. Alternatively, a theoretical approach based on biophysical modeling has been developed at the Helmholtzzentrum für Schwerionenforschung GmbH (GSI) in Germany. This model called Local Eect Model (LEM), is based on the assumption that biological damages are entirely determined by the local dose distribution (at the nm scale) inside the cell nucleus and mainly result from δ electrons [88]. As δ electrons are produced by photons as well as ions, the integration of the local damages over the entire cell nucleus allows to extrapolate ion biological eects based on photon experience (without high-let experiments) [88]. While more experience has been acquired at NIRS, the LEM model developed at GSI is claimed to be more rened and the latest version (LEM IV) allows predicting RBE values even for low-let particles like protons [3]. In a similar way, the Japanese model is evolving towards the Micro Kinetic Model (MKM), which is more 27
38 CHAPTER 2. PHYSICS AND BIOLOGY OF HADRONTHERAPY theoretically motivated and allows predicting RBE values for various types of particles, from protons to carbon ions [96]. Dierences between the Japanese and German approaches are of major concern and attempts are made in order to compare both approaches [97] and in order to report BED prescriptions in a standardized manner [3]. 28
39 Chapter 3 Setting an appropriate simulation environment for proton therapy 3.1 Introduction The GEANT4 Monte Carlo code is a versatile toolkit, allowing the simulation of particle interactions at very high energy from 100 TeV down to a very low energy of a few ev. It allows various applications such as space research (TeV), LHC 1 experiments (TeV), medical physics (kev- MeV) or microdosimetric applications (ev). Therefore, it is very important to dene a correct simulation environment corresponding to the range of energies of the application. The rst three basic questions I focused on were the following: 1. What physics processes, models and cross-sections describe a proton beam best? 2. What is the relative importance of each process relatively to the others and how can they be evaluated? 3. What parameters inuence the dose deposition of a proton beam? It rapidly appears that before being able to evaluate any simulation over measurements, it is rst mandatory to set-up a robust simulation environment with appropriate parameters. The only reference in our laboratory in regards to simulation parameters was the work performed by my colleague Nabil Zahra with carbon ions [98]. In his work, he pointed-out that the two main parameters are the low-energy production threshold of secondary electrons called cut and maximum step size determined with the steplimiter function. There are plenty of other functionalities and parameters available for users concerning electromagnetic interactions [99]. There are also many hidden parameters, for instance the low-energy tracking threshold of recoil nuclei. It is very tricky as a user to obtain a complete picture of the relevant or irrelevant parameters. Therefore, I decided that a meeting with the GEANT4 developers from CERN would be the best way of moving forward. This meeting with GEANT4 experts allowed me to understand better the GEANT4 code, in order to restrict the various investigation possibilities to a sub-set of models and parameters relevant at therapeutic energies (0-230 MeV). In a second step, I ne-tuned a physics-list and a parameters-list via comparisons with measurements. Whilst many scientists have evaluated the range of ions, few of them have investigated scattering. Therefore, we also made an attempt in that direction. Comparisons with other Monte Carlo codes were also of interest. The investigation details of the best GEANT4 physics-list and parameters-list have been published in Nuclear Instruments and Methods in Physics - section B journal, in
40 Article 1 L. Grevillot, T. Frisson, N. Zahra, D. Bertrand, F. Stichelbaut, N. Freud, and D. Sarrut. Optimization of GEANT4 settings for Proton Pencil Beam Scanning simulations using GATE Nuclear Instruments and Methods in Physics Research B, 268, ,
41 Nuclear Instruments and Methods in Physics Research B 268 (2010) Contents lists available at ScienceDirect Nuclear Instruments and Methods in Physics Research B journal homepage: Optimization of GEANT4 settings for Proton Pencil Beam Scanning simulations using GATE Loïc Grevillot a,b,c,f, *, Thibault Frisson a,b,c, Nabil Zahra a,d,c, Damien Bertrand f, Frédéric Stichelbaut f, Nicolas Freud a,e, David Sarrut a,b,c a Université de Lyon, F Lyon, France b Creatis, CNRS UMR 5220, F Villeurbanne, France c Centre de Lutte Contre le Cancer Léon Bérard, F Lyon, France d IPNL, CNRS UMR 5822, F Villeurbanne, France e CNDRI, INSA-Lyon, F Villeurbanne Cedex, France f IBA, B-1348 Louvain-la-Neuve, Belgium article info abstract Article history: Received 3 May 2010 Received in revised form 16 July 2010 Available online 5 August 2010 Keywords: Monte Carlo GATE GEANT4 MCNPX PHITS Proton Pencil beam Active scanning Spot Range TPS benchmarking Dose distribution Profiles Radiochromic films Bragg-peak This study reports the investigation of different GEANT4 settings for proton therapy applications in the context of Treatment Planning System comparisons. The GEANT4.9.2 release was used through the GATE platform. We focused on the Pencil Beam Scanning delivery technique, which allows for intensity modulated proton therapy applications. The most relevant options and parameters (range cut, step size, database binning) for the simulation that influence the dose deposition were investigated, in order to determine a robust, accurate and efficient simulation environment. In this perspective, simulations of depth-dose profiles and transverse profiles at different depths and energies between 100 and 230 MeV have been assessed against reference measurements in water and PMMA. These measurements were performed in Essen, Germany, with the IBA dedicated Pencil Beam Scanning system, using Bragg-peak chambers and radiochromic films. GEANT4 simulations were also compared to the PHITS.2.14 and MCNPX Monte Carlo codes. Depth-dose simulations reached 0.3 mm range accuracy compared to NIST CSDA ranges, with a dose agreement of about 1% over a set of five different energies. The transverse profiles simulated using the different Monte Carlo codes showed discrepancies, with up to 15% difference in beam widening between GEANT4 and MCNPX in water. A 8% difference between the GEANT4 multiple scattering and single scattering algorithms was observed. The simulations showed the inability of reproducing the measured transverse dose spreading with depth in PMMA, corroborating the fact that GEANT4 underestimates the lateral dose spreading. GATE was found to be a very convenient simulation environment to perform this study. A reference physics-list and an optimized parameters-list have been proposed. Satisfactory agreement against depth-dose profiles measurements was obtained. The simulation of transverse profiles using different Monte Carlo codes showed significant deviations. This point is crucial for Pencil Beam Scanning delivery simulations and suggests that the GEANT4 multiple scattering algorithm should be revised. Ó 2010 Elsevier B.V. All rights reserved. 1. Introduction The main advantage of using ions over photons in radiation therapy is due to their inverse depth-dose profiles, allowing higher doses to tumors, while better sparing healthy tissues. Currently, the most attractive and advanced technique in hadron-therapy consists in irradiating patients with a small pencil beam of a few millimeters in diameter. The pencil beam is scanned transversally in the patient using scanning magnets, while in the longitudinal * Corresponding author at: Université de Lyon, F Lyon, France. address: [email protected] (L. Grevillot). direction several iso-energy layers are used to cover the whole tumor volume. Paul Scherrer Institute (PSI) in Switzerland for proton therapy and Helmholtzzentrum für Schwerionenforschung (GSI) in Germany for carbon-ion therapy used for the first time an active beam scanning system in 1997 [1]. When computing dose distributions with ions, one critical point is the Bragg-peak range uncertainty. Moreover, for active beam scanning technique, the lateral spreading of each single pencil beam also needs to be correctly accounted for. In this setting, Monte Carlo (MC) simulations became increasingly important for evaluating treatment plans and dose distributions in patients. The dose accuracy reached with analytical algorithms X/$ - see front matter Ó 2010 Elsevier B.V. All rights reserved. doi: /j.nimb
42 3296 L. Grevillot et al. / Nuclear Instruments and Methods in Physics Research B 268 (2010) implemented in Treatment Planning Systems (TPS) is limited, for instance near heterogeneities. Therefore, MC simulations can be considered as a powerful Quality Assurance (QA) tool. MC has been extensively used at the Massachusetts General Hospital in Boston for TPS comparisons, mostly for passive scattering irradiation techniques, using the GEANT4 toolkit [2]. MC simulations allow for a better understanding of the dose deposition mechanisms in the patient and open many research areas. In this study, we used GEANT4 version 9.2 through the GATE simulation environment [3]. This study was conducted in order to analyze the physics implemented in GEANT4 and to select the appropriate settings for patient dose calculation, with an ultimate objective of treatment planning benchmarking [2,4]. This work dedicated to proton therapy applications builds upon a previous study oriented toward carbon-ion simulations using older GEANT4 releases [5]. Firstly, a short review of the relevant physics models and parameters available in GEANT4 is presented in Section 2. Secondly, the influence of different settings on dose calculation is investigated in Section 3. A reference physics-list and an optimized parameters-list are proposed afterwards. Comparisons with two other MC codes: MCNPX2.5.0 [6] and PHITS2.14 [7] are presented in Section 4. Experimental measurements in water and PMMA are described and compared to GEANT4 simulations in Sections 5 and Simulation settings 2.1. Pencil beam model In this study, a simple pencil beam model was used in order to reproduce the nozzle output beam based on reference measurements. The energetic spectrum was assumed Gaussian and adjusted over depth-dose measurements, as presented in Section 6.1. The 2D probability density function (PDF) of protons was considered normal (Gaussian distribution) and adjusted over transverse profile measurements performed at the isocenter (Section 6.2). By convention, Cartesian coordinates were used, with z the beam direction, x and y the lateral directions. In this paper, the expression spot size will refer to the PDF parameters r x and r y : the standard deviation in the x- and y-directions at the isocenter. The role of the beam divergence on the lateral dose spreading in water was estimated to be negligible compared to the effect of multiple Coulomb scattering. This assumption has been proven by simulating a realistic beam divergence of r ¼ 3 mrad. Thus, the intrinsic beam divergence was neglected Physics-list selection For medical physics applications the electromagnetic (EM) standard package with the Option 3 (Opt3) parameters-list is recommended by the GEANT4 Electromagnetic Standard working group [8]. Opt3 refers to options/processes which are described in the next sections and recommends reference parameters to reach a high level of accuracy. Our physics-list is mainly based on a reference paper dedicated to proton therapy applications [9], using the standard package for EM interactions and a recently implemented process (G4UHadronElasticProcess) combined with the G4Hadron- Elastic model for elastic hadronic (HAD) interactions. Details about available models have been discussed elsewhere [9 12]. The only difference in our physics-list compared to the one proposed in [9], is the choice of the inelastic HAD model. By comparing the Bertini, binary cascade, precompound and QMD models against depthdose measurements in water, the precompound model was found to best match the measurements. No significant difference between the different models was observed for the transverse dose profile Full Width at Half Maximum (FWHM). Therefore, the precompound model was selected for the rest of the study. The satisfactory agreement obtained with the precompound model has been pointed out in two recent studies investigating a model of a proton magnetic beam scanning delivery nozzle [14] and the prompt-gamma production during proton irradiation [15] Multiple scattering (MS) and single scattering (SS) Charged particles while transported through matter are scattered by electromagnetic fields which are produced by the nucleus and orbiting electrons encountered. The simulation of each single interaction (SS algorithm) increases significantly the number of steps and simulation time, but is considered as the reference, since it is based on cross-section measurements. It is shown in Section 4 that SS increases the simulation time by a factor of To overcome this issue, condensed algorithms (MS theories) have been developed in order to simulate the mean effect of numerous collisions (SS algorithm) at the end of each step. This mean effect encloses the net displacement, energy loss and change of direction [13]. MS algorithms are considered as exact if they reproduce the SS behavior. Most of the MC codes implemented the MS theories of Molière, Goudsmit-Saunderson or Lewis [13]. Besides the angular distribution after a step, the advantage of the Lewis theory over the others is the computation of the moment of the spatial distribution as well [13]. The computation of the spatial displacement is not part of those theories and each MC code has to incorporate its own algorithm. MS theories are subjects of interest and recent investigations on the scattering power, considered as a key quantity for beam transport in matter, may improve the accuracy of the MS algorithms implemented in MC codes [16,17]. It was shown that the MS algorithm implemented in GEANT4 release 9.1 depends on the step size [17]. Improvements of the scattering power calculation may avoid this dependence in the future. The management of geometrical boundaries is also a complex task, because particles are not allowed to cross a boundary without performing a step. In GEANT4, several stepping algorithms [13], which are included in the MS model can be selected: simple, safety and distancetoboundary, depending on the accuracy required. The MS model implemented in GEANT4 is based on the Lewis theory and is detailed in [13] Relationship between simulation parameters The two main parameters in a GEANT4 simulation are the step, which corresponds to the distance to the next interaction, and the range cut, which corresponds to the production threshold for secondary particles (gammas, electrons and positrons) after EM interactions. The energy loss of ions in matter is governed by EM and HAD processes. Below the range cut threshold, the energy loss occurs continuously along the ion track (at each step), while above the threshold, it is caused by the explicit production of secondary particles (discrete component) [12,13]. All the particles generated are then tracked until no energy is left (see [13] for implementation details). The range of charged particles can be calculated in the Continuous-Slowing-Down Approximation (CSDA range) by integrating the reciprocal of the total stopping power (collision plus nuclear) with respect to energy [18]. The complexity of the stopping power calculation has been detailed in [19]. The continuous energy loss of charged particles is calculated by the restricted stopping power equation, defined in GEANT4 as the Bethe-Bloch formula integrated between 0 and the range cut value [13]. Before starting a simulation, GEANT4 initializes tables to describe EM processes: lambda (mean free path), de (restricted stopping power), range and inverse range tables [12]. These tables dx are 32
43 L. Grevillot et al. / Nuclear Instruments and Methods in Physics Research B 268 (2010) pre-calculated according to the simulation parameters defined by the user, in order to save time during the simulation. By default, 84 bins are stored between 100 ev and 100 TeV, corresponding to a resolution of 7 bins/decade for each material, but the binning parameter can be adjusted by the user. In fact, the lambda table should be called cross-section ðrþ table, because it stores the cross-sections and indirectly indicates the mean free path ðkþ values via Eq. (1): 1 kðz; EÞ ¼ n at rðz; EÞ ð1þ where n at is the number of atoms per unit volume, Z is the target atomic number and Eisthe incident particle energy. Range and inverse range tables show the correspondence between range cut and energy. The step length is sampled at each step using the lambda table for EM processes and directly in the database for the HAD processes. Hence, a sufficient number of bins in the different tables is mandatory to accurately describe EM interactions. In the GEANT4 Opt3 parameters-list, 220 bins between 100 ev and 10 TeV, i.e 20 bins/decade, are advised. It is important to note that the range cut threshold influences the values stored in both the lambda and de tables. Hence, the step lengths sampled, continuous energy loss dx along the steps and d e production of charged particles depend on the range cut threshold Dealing with the continuous energy loss The continuous energy loss imposes a limit on the step length, because of the energy dependence of the cross-sections [13]. It is assumed in many MC codes that the cross-section is constant during a step and the continuous energy loss is computed via Eq. (2) [20]: Continuous Energy Loss ¼ Steplength de ð2þ dx with de the restricted stopping power of the charged particle at the dx beginning of the step. In high-gradient cross-section regions, the approximation of constant cross-sections along the step may lead to an inaccurate dose deposit. This point is very significant in hadron-therapy in the Bragg-peak region. The step length can be limited by two user-defined limits: maximum allowed step [20] and stepping function [12]. The maximum allowed step is managed like a process in competition with the other processes and limits the maximum step length according to a user-given value. The stepping function described in Eq. (3) is a dynamic step limitation which decreases the particle step limit ðds lim Þ parallel to the particle decreasing range (Fig. 1). The stepping function is defined by two parameters: droverrange and finalrange. The droverrange ða R Þ parameter defines the maximum step size allowed as a step ratio. As the particle travels, the maximum step allowed decreases range until the particle range (R) becomes lower than the finalrange ðq R Þ parameter. DS lim ¼ a R R þ q R ð1 a R Þ 2 q R ð3þ R Instead of limiting the step, one can also integrate the mean cross-section and the mean energy loss along the step, so that Eq. (2) becomes Eq. (4) Z steplength de Continuous Energy Loss ¼ dx dx ð4þ Fig. 1. This figure shows the maximum step length allowed for a 230 MeV proton beam in water, with the stepping function and default parameter ðar ¼ 0:2 and q R ¼ 1mmÞ in green (StepFunction2); with the stepping function and ar ¼ 0:01 and q R ¼ 10 lm in blue (StepFunction1); with a 1 mm maximum allowed step in red (StepLimiter). The left scale corresponds to the step limit and the right scale corresponds to the normalized dose of the proton beam in black (dose). (For interpretation of the references to colour in this figure legend, the reader is referred to the web version of this article.) This solution enables to sample the exact cross-section and mean energy loss via a MC technique [12]. This function is used when the E loss ratio is larger than the user-defined linear loss limit [20], with E E loss and E the particle continuous energy loss and particle kinetic energy. A low threshold can lead to a significant calculation time increase, respectively. Differences between GEANT4.9.2 default options and Opt3 are summarized in Table Influence of GEANT4 parameters on dose computing The first objective of our study was to understand the influence of the different parameters and functions presented in Table 1 on proton dose simulation, with a focus on the proton range, the simulation time and the dose fluctuations. For all simulations, the geometry was a single volume of water. Proton ranges were defined as the position of 80% of the maximum dose in the distal fall-off region of the Bragg peak. We evaluated the simulation times by comparing the proton source rate (in protons s 1 ) for different configurations Influence of the range cut and maximum allowed step values A 230 MeV mono-energetic proton beam was simulated in a cm 3 water tank and the depth-dose profiles were integrated along the z-axis with a 1 mm step. For a 230 MeV proton beam, the NIST [18] CSDA range is mm, while the GEANT4 ranges vary from mm for a 1 lm range cut to mm for a 0.1 mm range cut without fixed step limitation. Results are depicted in Fig. 2. Simulations were performed for different range cut values between 1 lm and 1 mm, using different maximum allowed step values, while other parameters were set to default values. The proton range converges towards the NIST range when the range cut value decreases. This is observed without step limitation, but introducing such a constraint brings more consistency in the convergence. Indeed, since the step size is related to the range cut value, the range convergence observed for decreasing range cut values is in fact indirectly due to step size limitation. The relationship between the two parameters has been checked by varying the maximum allowed step for different range cut values. Not surprisingly, the increased accuracy at a very low range cut yields a significant simulation time increase, as also reported in [5] for carbon ions. The simulation time increase is also related to the step size limitation associated with decreasing range cut value. Consequently, both the proton range and the computation time are strongly related to the step size, while the similar effects observed with low range cut values are mainly due to the step short- 33
44 3298 L. Grevillot et al. / Nuclear Instruments and Methods in Physics Research B 268 (2010) Table 1 Summary of the GEANT4.9.2 default and Opt3 parameters. e =e þ Proton GenericIon Default values Range cut 1 mm Stepping function finalrange 1 mm 1 mm 0.1 mm Stepping function droverrange Binning (bins/decade) Linear loss limit Stepping algorithm Safety Minimal Minimal GEANT4 Opt3 Stepping function finalrange 0.1 mm 0.05 mm 0.02 mm Binning (bins/decade) Stepping algorithm DistanceToBoundary a b Fig. 2. This figure illustrates the influence of the range cut value on the range of 230 MeV protons in water (a) and simulation time (b) for different maximum allowed step values. Ranges converge to the NIST reference value for sufficiently low range cut and step. Low range cut and step values decrease the proton rate drastically. ening effect. Part of the time increase is also due to the electron tracking process, which increases with low range cut values. The influence of the range cut and hence indirectly of the step limitation on dose computing artifacts is presented in Fig. 3. No fixed step limitation was used. When the range cut is sufficiently low, fluctuations become negligible. The worst case occurs with a range cut value of 0.1 mm (highest fluctuations and range shift). Ideally, the range cut value should neither affect the proton range, nor the dose fluctuations. In theory, the electron range cut should only define the accuracy of the electronic dose distribution in the medium Influence of the pre-calculated table binning In a second stage, the influence of the binning parameter on the dose deposition for several simulations initialized between 7 and 50 bins/decade was examined. We set the binning energy range between 100 ev and 1 GeV to decrease the total number of bins. The range cut was set to 0.1 mm, without limiting the step, which was the worst case observed previously (Section 3.1). Dose calculation deviations were evaluated using Eq. (5) ¼ 1 X N jd i d refi j ð5þ N d refi i¼1 where is the mean point-to-point deviation calculated, i corresponds to a given curve point, N is the number of points in a curve, d i is the dose computed and d refi is the dose computed for the reference simulation. Deviations were calculated between 0 and the Bragg-peak range ð 80 Þ to discard Bragg-peak tail deviations. The influence of EM table binning on dose computing is presented in Fig. 4 (a) and (b). Fluctuations decreased as the number of bins per decade increased. Based on this result, the 50 bins/dec- a b Fig. 3. Influence of the range cut threshold and hence of the step size on dose computing of 230 MeV protons in water. When a sufficiently low range cut is used, the proton range becomes stable and the dose fluctuations negligible. Influence of high range cuts is presented in (a) and low range cut in (b). 34
45 L. Grevillot et al. / Nuclear Instruments and Methods in Physics Research B 268 (2010) a b c d Fig. 4. (a,b) The influence of the binning parameters on dose computing with a range cut of 0.1 mm and no step limitation. When a sufficient number of bins is used, the proton range becomes stable and the dose fluctuations negligible. The influence of a 1 lm range cut (c) and GEANT4 Opt3 (d) on a simulation using 50 bins/decade is also presented. ade simulation was considered as the reference. We simulated protons, leading to a statistical uncertainty of about 0.5% from the water tank entrance up to the Bragg-peak distal fall-off. Above 15 bins/decade, the fluctuations became irrelevant, indicating that the 20 bins/decade resolution recommended by the GEANT4 Electromagnetic Standard working group is sufficient. The number of bins increased slightly the initialization time, but this was negligible even with a large number of materials (the initialization time was, respectively, 3 and 3.5 min with 7 and 20 bins/decade, for 1000 materials). Additionally, the influence of the previously studied parameters (range cut and step size) was assessed by comparing dose deposits in the reference simulation described above and in the same simulation with a 1 lm range cut (Fig. 4(c)). No significant difference was observed. Finally, we checked the influence of the Opt3 (Fig. 4(d)). Results are summarized in Table 2. If only a few bins are used, the tables do not accurately describe EM processes. Hence, the interpolated cross-sections are no longer constant, leading to incorrect step and continuous energy loss sampling. When limiting the step, the dose sampling along the ion track is more frequent. When a sufficient number of bins is used, the proton range and dose fluctuations are independent of the range cut and step parameters. Consequently, the range cut parameter can be used as intended, i.e. to define the accuracy of the electronic dose distribution along the ion track. For safety, it is suggested to set the range cut and maximum allowed step equal or lower than the voxel size, around 1 mm for clinical applications. The Opt3 parameters-list did not modify the results, however, the simulation was performed using a simple homogeneous geometry and both the stepping function and stepping algorithm may play a role in heterogeneous and voxelized media like patient CT data Efficiency-based parameter selection Regarding the previous investigations and in the context of the clinical implementation of dose calculation, simulation efficiencies were compared between the following four simulation settings: bins/decade, range cut and maximum allowed step at 1 mm bins/decade, range cut and maximum allowed step at 0.1 mm bins/decade, range cut at 1 lm bins/decade, range cut and maximum allowed step at 1 mm, Opt3. The simulation efficiency ðgþ was calculated using Eq. (6), as defined in [21], taking into account the simulation time (T) and the simulation statistical uncertainty which was calculated using Eq. (2) from [22] for each dosel (dose scoring voxel [23]). The simulation statistical uncertainty ðrþ was defined as the mean uncertainty of all dosels between the entrance and the proton range. Table 2 Influence of the number of bins used to initialize the pre-calculated EM tables on dose computation and proton range. Above 15 bins/decade, simulations lie within 0.3 mm in range and 0.7% of 80 deviations with the reference. The use of a 1 lm range cut and Opt3 did not affect the simulations. Bins/decade (Opt3) 50 (range cut 1 lm) 50 (ref) 80 ð%þ Range (mm)
46 3300 L. Grevillot et al. / Nuclear Instruments and Methods in Physics Research B 268 (2010) g ¼ 1 r 2 T Simulations were performed on a single 1.66 GHz CPU. Results are summarized in Table 3. Settings (i) and (iv) had a comparable efficiency, while settings (ii) and (iii) were about 7 and 430 times lower, respectively. In settings (iv), Opt3 parameters were added to settings (i) and could only increase the simulation accuracy. Therefore, settings (iv) were selected as the reference parameters-list, in order to perform robust and fast simulations Ionization potential of water The proton range depends mainly on the mean ionization potential (I) of the medium. The I value of water is a subject of growing interest and values between 67.2 and 85 ev are reported in Table 1 from Soltani-Nabipour et al. [24]. A recent study has also evidenced the uncertainty related to the I values of human tissues, stating that this could lead to the use of sub-centimeter clinical margins [25]. When the ionization potential of a medium is not known, Bragg s additivity rule [26] is used to compute it, by weighting the I values of the different constituents. In GEANT4, the ionization potential is calculated following Bragg s additivity rule by default for all user-defined media and is 70.9 ev for water. However, the user has the possibility of changing this value. We tested different values of I: 70.9, 75 and 80 ev, which moved the proton range, respectively, to 324.9, and mm, while the CSDA range given by NIST is mm. Based on these results, we set the ionization potential of water to 75 ev, which is the value recommended by ICRU reports 37 and 49 [27,28]. This value was also used in MCNPX and PHITS codes. Table 3 Simulation efficiency for four different settings. Simulation index i ii iii iv Statistical uncertainty (%) Time (s) 1: : : : Efficiency 4: : ð6þ 4. GEANT4 comparison with PHITS and MCNPX Simulation time, depth-dose profiles and transverse profiles at 10, 30 and 32 cm depth simulated with GEANT4, were compared to PHITS and MCNPX for a 230 MeV proton beam, using a circular Gaussian spot of 3 mm sigma. Furthermore, we assessed the impact of the MS algorithm on the lateral dose spreading compared to the SS algorithm implemented in GEANT4. Depth-dose profiles were integrated along the z-axis with a 1 mm step and transverse profiles were scored in dosels of 2 2 1mm 3,inx, y and z (the beam direction), respectively. Default parameters were used for PHITS and MCNPX, using a MS model and the ATIMA cross-section database for PHITS. A summary of the relevant simulation parameters used for all three MC codes is given in Table 4. Transverse profiles are presented in absolute dose (Fig. 5(b)). As regards depth-dose profiles, MCNPX and PHITS are in close agreement. Differences in the plateau and in the Bragg-peak regions compared to GEANT4 may be explained by different HAD and EM models. A detailed investigation of these differences is out of the scope of this paper, but it is worthwhile to note that the integral energy deposited by a 230 MeV mono-energetic proton beam between 0 and 40 cm is on average MeV/proton with GEANT4, MeV/proton with PHITS and MeV/proton with MCNPX. The integral dose deposited by GEANT4 is 5.3% higher than PHITS and 4.8% higher than MCNPX. In the transverse profiles one can observe differences in the maximum dose deposited in the profile centers and differences in the profile FWHM. The maximum dose of a profile calculated at a depth d depends on both the integral dose deposited at depth d (Fig. 5(a)) and on the lateral dose spreading. Simulations performed without the proton MS process yield almost no beam spreading, suggesting that proton scattering is mainly due to the MS process, even if HAD collisions may affect the profiles. Thus, the profile FWHM value is well representative of the multiple Coulomb scattering process. Regarding transverse profile FWHM, the proton beam spreading with depth in GEANT4 is narrower than in MCNPX and PHITS. Two recent studies presented a significative overestimation of the MCNPX MS algorithm compared to measurements [29,30]. Differences up to 34% in polystyrene and up to 15% in bone were reported in [29]. In[30], a modified MS algorithm is proposed to improve the accuracy of MCNPX. Dose spreading was Table 4 This table summaries the physical, geometrical and chemical parameters used for MC calculations using GATE, PHITS and MCNPX. Beam description Phantom description Dosel dimensions ðx; y; zþ E MeV Dimensions cm 3 Depth-Dose mm 3 r E 0 MeV Composition H 2 O Profiles 2 2 1mm 3 r x;y 3mm I Water 75 ev a b Fig. 5. Comparison of depth-dose and transverse profiles at 32 cm depth using GEANT4, MCNPX and PHITS, for a 230 MeV proton beam in water. 36
47 L. Grevillot et al. / Nuclear Instruments and Methods in Physics Research B 268 (2010) Table 5 Comparison of the transverse profile spreading ðrþ at 10, 30 and 32 cm depth for a 230 MeV proton beam in water using the GEANT4 MS algorithm, GEANT4 SS algorithm, MCNPX, PHITS and an analytical model (Szymanowski). The uncertainty on the r values was estimated 0.15 mm using ROOT. GEANT4 beam spreading is significantly lower than in MCNPX, PHITS and Szymanowski s model, even if it gets close to the PHITS results using the SS algorithm. MCNPX shows the widest beam spreading. r 10 cm (mm) r 30 cm (mm) r 32 cm (mm) GEANT4 (MS) GEANT4 (SS) MCNPX PHITS Szymanowski a Table 6 Pristine Bragg peak measurements for five energies. The settings at the nozzle exit ðrnoz and ENozÞ were estimated from the nozzle entrance parameters ðress and EESSÞ and then measured in water (measured ranges). At the time of the measurements, the nozzle energy was not yet calibrated. This explains the discrepancies between set ranges and measured ranges. R ESS (g/ cm 2 ) E ESS (MeV) also estimated due to an analytical formula based on measurements using Eq. (4) from [31]. Significant differences in terms of dose spreading were observed between MS and SS models of GEANT4 (8% difference in FWHM). It is noteworthy that MS algorithms should reproduce the detailed simulation results obtained with SS models. In the case of GEANT4 MS and SS models comparison, one can directly observe the overall profile difference (Fig. 5(b)), which is specific to the Coulomb scattering model selected. Results are presented in Table 5. From this table, it seems that GEANT4 SS and PHITS MS models are in close agreement, while the dose level difference observed in Fig. 5(b) may be due to different EM and HAD modelization. The comparisons between the different MC codes and Szymanowski s analytical model showed inconsistencies, with up to 15% difference (2.8 mm in FWHM) in the lateral dose spreading simulated with GEANT4 and with MCNPX, at 32 cm depth in water. Using a SS instead of a MS model increases the number of steps and the simulation time by three orders of magnitude (330 steps per incident proton were recorded using the MS model and more than with the SS). As the computation of the spatial displacement is not part of the MS theories, each MC code has to develop its own algorithm [13], which may explain part of the discrepancies. Our first suggestion is that the proton MS process used in GEANT4.9.2 should be revised. Regarding computation time, MCNPX and PHITS proton rates were estimated to 127 and 29 protons s 1, respectively, on a single 3.06 GHz CPU using detailed simulation settings. On a comparable machine with a 2.33 GHz CPU, the GATE/GEANT4 proton rate was estimated to 263 protons s 1 using optimized settings. These simulation times have only an indicative purpose, since the simulations were performed on different machines, using different MC parameters. 5. Experimental measurements Measurements were performed in Essen, Germany, with the new IBA Pencil Beam Scanning (PBS) dedicated nozzle mounted on a rotating gantry. This nozzle allows for delivering circular spots of a few millimeters in diameter at the treatment isocenter. The Nozzle water Equivalent Thickness (NET) was estimated to 1.7 mm. The Water Equivalent Thickness (WET) of the different media within the nozzle were estimated using Eq. (7): WET m ¼ L q m q w S m S w R Noz (g/ cm 2 ) E Noz (MeV) where the index m stand for medium and w for water. S and q are the mass stopping powers (in MeV cm 2 g 1 ) and densities (in gcm 3 ), respectively. WET m is the medium WET (in cm) and L its thickness (in cm). The Energy Selection System (ESS) is designed to provide one given beam of range rmr ESS and energy E ESS at the nozzle entrance. The corresponding range R Noz and energy E Noz at the nozzle output were therefore obtained by subtracting the NET. The R ESS and R Noz given correspond to ranges in water. Range to energy conversion was determined with a fit from the NIST PSTAR database [18]. The ESS was tuned to achieve energy spreads lower than 1% of the mean energies. Beam optic simulations suggest an increase in energy spread when decreasing the mean energy of the beam Reference pristine Bragg peak in water Measured ranges (cm) Reference pristine Bragg peaks were measured in a cm 3 water phantom (Blue Phantom Ò, IBA-Dosimetry) for five energies, as presented in Table 6. Two large Bragg-peak b ð7þ Fig. 6. Illustration of the measurement set-up of depth-dose profiles in water (A) and transverse profiles in PMMA (B). (A) The nozzle (1), the proton beam direction (2) and the water phantom (3), with the reference Bragg-peak chamber (a), the sensitive Bragg-peak chamber (c) and the phantom entrance wall (b). (B) The transverse profile set-up of the MeV proton beam, with four radiochromic films (in blue) inserted between the PMMA slabs (3). (For interpretation of the references to colour in this figure legend, the reader is referred to the web version of this article.) 37
48 3302 L. Grevillot et al. / Nuclear Instruments and Methods in Physics Research B 268 (2010) Table 7 Positions of the transverse profiles measured with EBT radiochromic films inserted in a PMMA phantom. Four films were used at the lowest and medium energies and five at the highest energy. E Noz (MeV) R Noz (g/cm 2 ) Range in PMMA (cm) Pos 1 (mm) Pos 2 (mm) Pos 3 (mm) Pos 4 (mm) Pos 5 (mm) chambers (PTW type 34070) with a 10:5cm 3 sensitive volume were used, so that the proton beams were always fully integrated within the sensitive volume of the chamber (Fig. 6(a)). The first chamber was placed at the phantom entrance and used as a reference chamber to eliminate beam fluctuations. The second chamber was placed in the phantom and moved along the z-axis with a 1 mm increment. Measured depth-dose profiles were shifted by 44.1 mm to account for the total set-up WET to the effective measurement point. The uncertainty on the measured energy deposited depends mainly on the signal level and was estimated to be about 1% Reference transverse profiles in PMMA Reference transverse profiles were measured with ISP selfdeveloping EBT Gafchromic Ò films inserted between uncalibrated PMMA slabs of 1 cm thickness (Fig. 6(b)) and 1:19 g cm 3 density. The exact positions of the films between the slabs were recorded. Transverse profiles were measured for three different energies, with four or five films inserted between the slabs as summarized in Table 7. The film optical densities (OD) were recorded using a Vidar VXR-16 DosimetryPRO Film Digitizer (Vidar Corporation, Herndon, Virginia) at the Centre Lèon Berard (Lyon, France). For each film, the mean OD of a non-irradiated film, considered as the background, was subtracted before normalization to the maximum OD. Transverse profiles were measured with a grid resolution of 1 1mm 2, to mimick the simulated matrix of dosels. At the time of the measurements, only a preliminary version of the PBS system was available and the monitor units were not yet available. Therefore, it was not possible to perform a calibration curve between the film OD and doses. These preliminary measurements were used only qualitatively to illustrate the beam widening increase with depth. mean point-to-point dose deviation. Simulated and measured depth-dose profiles were normalized to the integral dose deposited. There was a discrepancy between measured ranges and system ranges, because the nozzle had not been yet properly calibrated at the time of the measurements: the energies were slightly higher than the set values, leading to measured ranges increased by mm (Table 6). To further assess the dose deposited, we shifted the measurements to compensate for the range difference with the simulations. Then, we adjusted the energy spread of the incident beams in the simulation for the five energies to match the measurements as closely as possible. The tuning stage of the energy spread was done with an energy step of % of the mean energy. The energy spread was adjusted according to two criteria: the peak dose deviation and the mean point-to-point dose deviation ð 80 Þ calculated using Eq. (5). Results obtained at the lowest and highest energies are presented in Fig. 7. We simulated 10 5 protons. Lower peak dose deviations were associated with lower mean point-to-point dose deviations, as presented for E Noz ¼ 168:63 MeV in Fig. 8. For absolute range comparison, the simulated range accuracy depends on the nozzle WET 6. GEANT4 comparison with measurements 6.1. Depth-dose in water The evaluation of depth-dose profile simulations was based on three criteria: the proton range, the peak dose deviation and the a Fig. 8. Tuning of the MeV proton beam, by adjusting the energy spread of the simulation. The lowest peak deviation and 80 deviation ( mean dose error ) correspond to a sigma energy spread of 0.5% of the mean energy of initial beam. b Fig. 7. Comparison between measured and simulated depth-dose profiles in water for the highest and lowest energies, MeV (b) and MeV (a). The left and right axes correspond to normalized doses and point-to-point deviations, respectively. 38
49 L. Grevillot et al. / Nuclear Instruments and Methods in Physics Research B 268 (2010) Table 8 Assessment of depth-dose profiles in water, in terms of peak dose deviation ð peakþ, mean point-to-point dose deviation ð80þ and range accuracy.the energy spread (re in %) adjusted in the simulations increased with decreasing energy within %, as expected from the system (ESS). R Noz (g/ cm 2 ) E Noz (MeV) r E simulation (%) estimation, the ionization potential uncertainty of the different element crossed (nozzle component, water phantom) and the scoring resolution. In this study, we did not simulate the nozzle, but we compared simulated ranges in a water phantom to NIST values. The ionizaton potential was used as a free parameter, as discussed in Section 3.4. Thus, the simulated range accuracy depends mainly on the scoring grid resolution. As millimetric dosels were used along the beam axis, we assumed that a 0.5 mm range accuracy could be achieved, or better. In Fig. 7(a), one can observe that the resolution of 1 mm for calculations and measurements was too small, because the peak was not correctly covered. At higher energy however, the peak width was larger and better covered, hence, one could expect a better range estimation. Simulated ranges laid within 0.3 mm of set ranges. Peak dose deviations and mean point-to-point dose deviations were about 1%. Results are summarized in Table 8. The dose statistical uncertainty of our MC calculation was about 0.8% in the plateau region and about 0.4% in the Bragg-peak region. Consequently, these results were in good agreement with the measurements Transverse dose profiles in PMMA 80 (%) peak (%) R simu (cm) The simulation of the lateral dose spreading of individual pencil beams was assessed against measurements for three energies (98.71, and MeV). Transverse profiles were measured at several depths in a PMMA phantom using radiochromic films, as presented in Fig. 6(b). The beam energy parameters were determined from the previous depth-dose profile simulations. The dose response mechanism of radiochromic films is not linear with dose and depends on the particle s Linear Energy Transfer (LET) [32,33]. Radiochromic films show a significant under-response in the Bragg-peak region, because of quenching effects due to high-let particles [32,33]. The radiochromic film s dose response has been modeled following a logarithmic relation in [32], as shown in Eq. (8): OD net ðd eff Þ¼logða 0 D eff þ 1Þ ð8þ with a 0 the film s response parameter, OD net ðd eff Þ the net optical density after irradiation with an effective dose D eff, which depends on the particle LET and dose deposit D. For low LET, D eff D. As the LET increases, D eff becomes lower than D, illustrating the film s under-response. The particle LET increases as its remaining range decreases with penetration in water. Hence, for depth-dose profile measurements, the film s response dependence on LET has to be accounted for. Since our measurements were transverse to the beam direction, the LET lateral variations were neglected in first approximation. Additional tests using MC showed that, as the depth of calculation increased, the mean LET value was slightly higher on the side of the transverse profiles compared to the center. This suggests a lower dose response on the side of the transverse profiles compared to the center (due to quenching effect), which may lead to an underestimation of the FWHM in depth. However, it has been stated in [34], that radiographic films and diodes, which are detectors that are also sensitive to the energy spectrum of protons, can be safely used to measure distributions perpendicular to the proton beam direction. We compared the film s OD FWHM ðfwhm OD Þ increase to the simulated transverse dose profile FWHM ðfwhm simu Þ increase with depth. A Gaussian fit on the radiochromic film OD measured at the beam entrance was performed using the ROOT software [35] for the three energies. The spot FWHM in the x- and y-directions were then used as input parameters in the simulations, so that FWHM simu ¼ FWHM OD at the phantom entrance. The measured spot widths (sigma in OD) were between 3 and 6 mm depending on the energy. The uncertainty of radiochromic film measurements was estimated to 5% for MD-55-2 films in [36]. The FWHM uncertainty of the fit was estimated to be 0.1 mm. Assuming FWHM dose the true dose FWHM, it follows from the logarithmic relationship between OD and dose (Eq. (8)), that for a fixed FWHM dose, the FWHM OD decreases while the dose decreases (Fig. 9(b)). Hence, the true dose spreading increase with depth should be even higher than the OD spreading increase with depth, because the dose at the beam axis decreases with depth (contrary to the integral dose). This is illustrated in Fig. 9. a b Fig. 9. (a) Simulated dose spreading with depth in PMMA of a 211 MeV proton beam with a circular spot of 3 mm sigma. While the integral depth-dose increases continuously with depth, the depth-dose at the beam axis decreases with depth with a factor about 2 between the entrance and the Bragg peak and increases again within the last 2 cm. (b) Illustration of the FWHMOD increase with increasing dose, compared to a constant FWHMdose of 3 mm, with a maximum dose varying between 1 and 8 Gy, for two different film parameters: a 0 = 1 and a 0 = 0.1. This comparison was only theoretical (without measurements), using the film s dose response model presented previously (Eq. (8)). 39
50 3304 L. Grevillot et al. / Nuclear Instruments and Methods in Physics Research B 268 (2010) a b c Fig. 10. Comparison between simulated transverse dose profiles and measured transverse OD profiles in PMMA, for a MeV proton beam at three depths: 0, 186 and 226 mm. It shows that the beam spreading with depth is not sufficiently accounted for in the simulation. Error bars are printed for the measurements and correspond to the measurement uncertainty of 5% [36]. For the simulations, error bars are very low, due to the low statistical uncertainty, thus they are not printed. Fig. 11. This figure illustrates the lack of lateral dose spreading with depth compared to measurements in PMMA, using the GEANT4 MS model. Comparisons are shown at three energies (210.56, , MeV). The black line shows the general trend of the transverse dose spreading underestimation with depth. Error bars are also printed. Results obtained using GEANT4 for x profiles with E Noz ¼ 210:56 MeV at three different depths are presented in Fig. 10. Similar results were obtained for the two other energies ( and MeV). The FWHM simu FWHM OD ratio at different depths for the three energies is presented in Fig. 11 and illustrates the lack of dose spreading with depth of the GEANT4 MC code compared to measurements. It is important to notice, that the previous discussions about the film LET and dose response dependences suggested that the qualitative measurements presented, also underestimate the true lateral dose spreading with depth. This study corroborates the fact that the MS model implemented in GEANT4.9.2 release underestimates the lateral dose spreading with depth, even though further comparisons with quantitative measurements are required to fix the dose spreading accuracy achievable by MC simulation with GEANT4. 7. Discussion and conclusion The objective of this study on proton PBS simulations was to get a better understanding of the GEANT4 settings. Two dominant simulation parameters are the maximum step size and the range cut, which should be defined in accordance to the voxel size. Another key parameter is the binning of the EM tables, which needs to be set to a value >15 bins/decade to ensure accurate interactions, independent of the range cut and maximum allowed step values. An optimized parameters-list has been proposed in order to perform robust and efficient simulations, that are competitive in term of simulation time with other MC codes like MCNPX and PHITS. A reference physics-list for proton therapy has been presented, using the EM standard package combined with the precompound model for inelastic HAD collisions. It is noteworthy that the absolute dose deposited for a 230 MeV proton beam simulated with GEANT4 was about 5% higher than with PHITS and MCNPX. When comparing simulated and measured ranges, not only the approximated WET of the nozzle accounts for range differences, but the ionization potential uncertainty of the different media influences the range as well. Therefore, it is necessary to know the correct WET of the nozzle to make any conclusion on absolute ranges. As the beam energy of the nozzle was not calibrated, we did not perform absolute range comparison. We used NIST values as a reference instead. The ionization potential of water was set to 75 ev, in accordance with ICRU reports 37 and 49, because it was found to best reproduce NIST CSDA ranges for 5 energies between 100 and 230 MeV (within 0.3 mm). Depth-dose profile simulations were in satisfactory agreement with reference measurements performed in water. Peak deviations were less than 1.1% and mean point-to-point deviations ð 80 Þ were about 1%. Dose differences between simulations and measurements are within the measurement and calculation uncertainties (about 1%). Range differences compared to NIST are within the simulation uncertainties (about 0.5 mm). Inconsistencies were pointed out for transverse profile simulations using different MC codes, with up to 15% difference in dose spreading between GEANT4 and MCNPX at 32 cm depth in water. Transverse dose profile simulation issues using GEANT4 were attributed to the MS algorithm, which was not able to reproduce the SS dose spreading with depth. Further comparisons against measurements in PMMA corroborated these results and showed that the lateral dose spreading with depth is not sufficiently accounted for in GEANT4. Radiochromic films have a very high spatial resolution, which is contrary to their associated reading uncertainty and dose response dependence. Therefore, radiochromic films may be not the most suited tool for the validation of transverse profile simulations. The significantly larger dose spreading simulated with MCNPX may suggest a better modeling of the MS process, but this conclusion is contrary to other investigations [29,30], which demonstrate that MCNPX overestimates the scattering with respect to measurements. As the PHITS MS model was in good agreement with the GEANT4 SS model, it could be a good candidate. However, the investigations performed in this study do not allow to firmly conclude on which code to prefer. The MS algorithm accuracy is currently the limiting factor for PBS simulations, since the dose spreading of each single beam is very important for patient dose calculation. Improvements of the MS algorithm are expected with the new GEANT4.9.3 release, which is being evaluated. Investigations using quantitative measurements are necessary to fully estimate the lateral dose spreading accuracy achievable by MC simulation. Further studies investigating the effects of patient heterogeneities, using a MC 40
51 L. Grevillot et al. / Nuclear Instruments and Methods in Physics Research B 268 (2010) pencil beam model of the new IBA PBS dedicated system and related TPS comparisons will follow. Acknowledgments This work was conducted in a collaboration between IBA and the Creatis laboratory. The research leading to these results has received funding from the [European Community s] Seventh Framework Programme [FP7/ ] under grant agreement no We also acknowledge the GEANT4 collaboration, especially Vladimir Ivantchenko for fruitful discussions. References [1] U. Amaldi, G. Kraft, Radiotherapy with beams of carbon ions, Rep. Prog. Phys. 68 (2005) [2] H. Paganetti, H. Jiang, K. Parodi, R. Slopsema, M. Engelsman, Clinical implementation of full Monte Carlo dose calculation in proton beam therapy, Phys. Med. Biol. 53 (2008) [3] S. Jan, G. Santin, D. Strul, S. Staelens, K. Assié, D. Autret, S. Avner, R. Barbier, M. Bardiès, P.M. Bloomfield, D. Brasse, V. Breton, P. Bruyndonckx, I. Buvat, A.F. Chatziioannou, Y. Choi, Y.H. Chung, C. Comtat, D. Donnarieix, L. Ferrer, S.J. Glick, C.J. Groiselle, D. Guez, P.-F. Honore, S. Kerhoas-Cavata, A.S. Kirov, V. Kohli, M. Koole, M. Krieguer, D.J. van der Laan, F. Lamare, G. Largeron, C. Lartizien, D. Lazaro, M.C. Maas, L. Maigne, F. Mayet, F. Melot, C. Merheb, E. Pennacchio, J. Perez, U. Pietrzyk, F.R. Rannou, M. Rey, D.R. Schaart, C.R. Schmidtlein, L. Simon, T.Y. Song, J.-M. Vieira, D. Visvikis, R.V. de Walle, E. Wieërs, C. Morel, Gate: a simulation toolkit for pet and spect, Phys. Med. Biol. 49 (2004) [4] J. Seco, H. Jiang, D. Herrup, H. Kooy, H. Paganetti, A Monte Carlo tool for combined photon and proton treatment planning verification, J. Phys.: Conf. Series 74 (2007) [5] N. Zahra, T. Frisson, L. Grevillot, P. Lautesse, D. Sarrut, Influence of Geant4 parameters on dose distribution and computation time for carbon ion therapy simulation, Phys. Med. (2010), doi: /j.emp [6] MCNPXTM User s Manual Version 2.5.0, Los Alamos National Laboratory Report LA-CP , [7] K. Niita, T. Sato, H. Iwase, H. Nose, H. Nakashima, L. Sihver, PHITS a particle and heavy ion transport code system, Space Radiation Transport, Shielding, and Risk Assessment Models, [8] Geant4 Electromagnetic Standard Working Group, [9] C.Z. Jarlskog, H. Paganetti, Physics settings for using the Geant4 toolkit in proton therapy, IEEE 55 (2008) [10] J. Wellisch, Geant4 hadronic physics status and validation for large HEP detectors, Computing in High Energy and Nuclear Physics, La Jolla, California, March 24 28, [11] L. Sihver, D. Matthiä, T. Koi, D. Mancusi, Dose calculations at high altitudes and in deep space with GEANT4 using BIC and JQMD models for nucleus nucleus reactions, New J. Phys. (2008). [12] J. Apostolakis, M. Asai, A. Bogdanov, H. Burkhardt, G. Cosmo, S. Elles, G. Folger, V. Grichine, P. Gumplinger, A. Heikkinen, I. Hrivnacova, V. Ivantchenko, J. Jacquemier, T. Koi, R. Kokoulin, M. Kossov, H. Kurashige, I. McLaren, O. Link, M. Maire, W. Pokorski, T. Sasaki, N. Starkov, L. Urban, D. Wright, Geometry and physics of the Geant4 toolkit for high and medium energy applications, Radiat. Phys. Chem. 78 (2009) (Workshop on Use of Monte Carlo Techniques for Design and Analysis of Radiation Detectors). [13] Geant4-Collaboration, Physics Reference Manual for Geant4, CERN, [14] S.W. Peterson, J. Polf, M. Bues, G. Ciangaru, L. Archambault, S. Beddar, A. Smith, Experimental validation of a Monte Carlo proton therapy nozzle model incorporating magnetically steered protons, Phys. Med. Biol. 54 (2009) [15] J.C. Polf, S. Peterson, M. McCleskey, B.T. Roeder, A. Spiridon, S. Beddar, L. Trache, Measurement and calculation of characteristic prompt gamma ray spectra emitted during proton irradiation, Phys. Med. Biol. 54 (2009) N519 N527. [16] N. Kanematsu, Alternative scattering power for gaussian beam model of heavy charged particles, Nucl. Instr. Methods Phys. Res. Sect. B: Beam Interact. Mater. Atoms 266 (2008) [17] B. Gottschalk, On the scattering power of radiotherapy protons, Med. Phys. 37 (2010) [18] M. Berger, J. Coursey, M. Zucker, J. Chang, Proton Stopping Power and Ranges, Nuclear Institute of Standards and Technology, Available from: < physics.nist.gov/physrefdata/star/text/pstar.html>. [19] J.F. Ziegler, The stopping of energetic light ions in elemental matter, J. Appl. Phys.: Rev. Appl. Phys. 85 (1999) [20] S. Agostinelli et al., Geant4 a simulation toolkit, Nucl. Instr. Methods Phys. Res. A (2003) [21] I.J. Chetty, B. Curran, J.E. Cygler, J.J. DeMarco, G. Ezzell, B.A. Faddegon, I. Kawrakow, P.J. Keall, H. Liu, C.M.C. Ma, D.W.O. Rogers, J. Seuntjens, D. Sheikh- Bagheri, J.V. Siebers, Report of the aapm task group no. 105: issues associated with clinical implementation of Monte Carlo-based photon and electron external beam treatment planning, Med. Phys. 34 (2007) [22] I.J. Chetty, M. Rosu, M.L. Kessler, B.A. Fraass, R.K.T. Haken, F.-M.S. Kong, D.L. McShan, Reporting and analyzing statistical uncertainties in Monte Carlobased treatment planning, Int. J. Radiat. Oncol. Biol. Phys. 65 (2006) [23] D. Sarrut, L. Guigues, Region-oriented CT image representation for reducing computing time of Monte Carlo simulations, Med. Phys. 35 (2008) [24] J. Soltani-Nabipour, D. Sardari, G. Cata-Danil, Sensitivity of the Bragg peak curve to the average ionization potential of the stopping power, Rom. J. Phys. 54 (2008) [25] P. Andreo, On the clinical spatial resolution achievable with protons and heavier charged particle radiotherapy beams, Phys. Med. Biol. 54 (2009) N205 N215. [26] W.H. Bragg, R. Kleeman, On the a particles of radium, and their loss of range in passing through various atoms and molecules, Philos. Mag. 10 (1905) [27] Bethesda, MD: ICRU Report 37: Stopping Powers for Electrons and Positrons, [28] Bethesda, MD: ICRU Report 49: Stopping Powers and Ranges for Protons and Alpha Particles, [29] C.J. Mertens, M.F. Moyers, S.A. Walker, J. Tweed, Proton lateral broadening distribution comparisons between GRNTRN, MCNPX, and laboratory beam measurements, Adv. Space Res. 45 (2010) (Life Sci. Space). [30] A. Stankovskiy, S. Kerhoas-Cavata, R. Ferrand, C. Nauraye, L. Demarzi, Monte Carlo modelling of the treatment line of the Proton Therapy Center in Orsay, Phys. Med. Biol. 54 (2009) [31] H. Szymanowski, A. Mazal, C. Nauraye, S. Biensan, R. Ferrand, M.C. Murillo, S. Caneva, G. Gaboriaud, J.C. Rosenwald, Experimental determination and verification of the parameters used in a proton pencil beam algorithm, Med. Phys. 28 (2001) [32] T. Frisson, N. Zahra, P. Lautesse, D. Sarrut, Monte-carlo based prediction of radiochromic film response for hadrontherapy dosimetry, Nucl. Instr. Methods Phys. Res. Sect A: Accelerat. Spectr. Detect. Assoc. Equipm. 606 (2009) [33] D. Kirby, S. Green, H. Palmans, R. Hugtenburg, C. Wojnecki, D. Parker, LET dependence of GafChromic films and an ion chamber in low-energy proton dosimetry, Phys. Med. Biol. 55 (2010) [34] Prescribing, recording, and reporting proton-beam therapy: contents, J. ICRU 7 (2007). [35] F. Rademakers, R. Brun, Root: an object-oriented data analysis framework, Linux J. (51) (1998). [36] Radiation Therapy Committee Task Group No. 55, Radiochromic Film Dosimetry, Technical Report, AAPM Report No. 63,
52 CHAPTER 3. PHYSICS SETTINGS FOR PROTON THERAPY 3.3 Conclusion & Perspectives In this study, our goal was to better understand the GEANT4 code in order to dene a physics-list and a parameters-list suitable for proton therapy applications. This objective has been successfully achieved, together with a satisfactory level of knowledge and condence with the simulation environment. This overall conclusion aims at giving additional input and perspective complementary to the work presented. Monte Carlo is a computer implementation of physics theories (in C++ in the case of GEANT4). Therefore, the simulation accuracy is very dependent on the code implementation quality. Obviously, the accuracy of physics theories and availability of basic physics data like nuclear interaction cross-sections is also of primary importance [35]. Therefore, Monte Carlo it is not a holy grail, as sometimes believed in medical physics. I think for simple and specic applications, Monte Carlo would not be better than deterministic solutions. However, as the situation becomes more complex, the power of a detailed Monte Carlo simulation is expected to show-up, as for instance in patient geometries. Multiple Coulomb scattering theory as developed by Molière is very accurate, with a prediction better than 1% on average for protons [83]. Therefore, the dierences presented in our paper between Monte Carlo and measurements might be mainly due to programming language implementations. Unfortunately, the quality of our measurements did not allow properly quantifying the results, but the preliminary comparisons presented suggested that there is a room for improvement. The NASA performed a collection of transverse dose prole measurements in various media and at various depths for pristine Bragg peaks in order to benchmark their own deterministic code [100]. This could be a good starting point to benchmark current GEANT4 multiple Coulomb scattering models. The use of a common data base would also allow benchmarking the dierent Monte Carlo codes available. This was already the idea of the simple set-up presented in Figure 5 in our paper. In parallel, the development of a new multiple Coulomb scattering algorithm based on scattering powers would be an interesting alternative, avoiding step-size dependence artifacts, as suggested in [55, 84]. Concerning nuclear interactions, a very simple set-up using a multi-layer faraday cup (MLFC) has been proposed some years ago to benchmark nuclear models [101]. Such a set-up allows separating signal from electromagnetic and nuclear interactions. Data presented in [101] were used later to evaluate GEANT3/GEANT4 models [102], to evaluate the best physics settings for proton therapy using GEANT4 version 8.1 [34] and also to test the SHIELD-HIT and FLUKA Monte Carlo codes [103, 104]. Results from [34] motivated the Boston group to move from precompound to the binary cascade non-elastic nuclear model [59], however the precompound model was not evaluated. In the next chapter, we will show that binary cascade is not suited for proton pencil beam scanning simulations. Therefore, it would be interesting to re-evaluate the best physics settings for proton-therapy based on [34], including the precompound model, for both passive scattering and active scanning delivery systems. A MLFC allows for scoring charged secondaries along the beam axis. Ionization produced in the MLFC does not perturb the measurement, because the electron/hole pairs produced have no global charge. On the contrary, when nuclear interactions occur, the redistribution of charged secondaries is measured by the tool. To illustrate, let's assume the following non-elastic nuclear interaction: 1 H C 6 1 H B 5 +1 H + 1 (3.1) The integrated number of charges collected by the whole MLFC is +1, reecting the number of primary protons entering the MLFC, while the 1D charge distribution along the beam axis will reect the charged secondaries redistribution inside the MLFC. Therefore, such a tool is also valuable for absolute dosimetry[57]. In order to benchmark nuclear models in dierent media, the MLFC could be also used in combination with various phantoms. 42
53 3.3. CONCLUSION & PERSPECTIVES I wish also to correct one wrong number presented in this chapter: the absolute dose dierence between GEANT4, MCNPX and PHITS for a 230 MeV proton beam in water is not around 5%, but is around 2%. This issue has been detected when analyzing the data one more time. 43
54 CHAPTER 3. PHYSICS SETTINGS FOR PROTON THERAPY 44
55 Chapter 4 A Monte Carlo implementation of a clinical proton active scanning system 4.1 Introduction In this study, our goal was to implement a clinical beam model in GATE, with the objective of further comparison with TPSs. To achieve this task, I focused on the three following questions: 1. What are the main physical characteristics of a clinical pencil beam? 2. Should we provide a detailed model of the nozzle, or is it sucient to simulate the beam from the nozzle exit? 3. What is the relevant information in a treatment plan and how can it be integrated in a simulation? To solve the rst question, I had many discussions with IBA eld engineers and cyclotron specialists regarding beam optics. Beam optic theory allows characterizing the beam as a whole, with optical and energy properties. Relevant information was extracted from the manual of the TRANSPORT code used for beam optic simulations [105]. Active scanning delivery systems are currently less developed than passive scattering systems; consequently fewer references are available in literature. However, two main types of modeling have been developed: full Monte Carlo modeling of the treatment nozzle as described in [60, 59] or Monte Carlo modeling from the nozzle exit [106]. Having a detailed model of the nozzle allows taking into account interactions with every element of the nozzle, e.g. the ionization chambers, vacuum walls and magnetic elds. The main advantage of such a model for patient dose calculation is the simulation of beam scattering and secondary fragment production inside the nozzle, which could contribute to additional dose away from the beam axis. However, the number of scattering elements in a nozzle is very limited and the nozzle water equivalent thickness of the IBA system was estimated lower than 2 mm [107]. At the Paul Scherrer Institute (PSI) in Switzerland, a dedicated Monte Carlo code starting from the nozzle exit has been used for over 10 years [106] to evaluate deciencies of analytical calculations. I decided to simulate the beam from the nozzle exit for reasons of simplicity. The key advantage of this method is that it is based on the same measurement beam data library as used by TPS manufacturers. Beam time is always an important issue and this method presents the advantage of not disturbing clinical workow. To develop a clinical beam model, it is important to take into account the treatment planning information from start. As GATE does not support DICOM formats, we made the choice to use only GATE readable formats. To simulate a complex treatment plan, usually made of several 45
56 CHAPTER 4. PBS MODEL thousands of pencil beams, the source has to deliver each pencil beam in accordance with the treatment plan and in accordance with the physical properties of the delivery system. To guarantee the compatibility between our simulation environment and the clinical environment, external tools have been developed in order to allow reciprocal conversions between DICOM les and GATE formats. These tools allow converting a DICOM RT ION PLAN into a GATE input le and also to convert a GATE output dose le into a DICOM RT DOSE. They have been developed using a home made toolkit, which is based on the ITK library 1. The investigation details of the modeling method have been published in Physics in Medicine and Biology in
57 Article 2 L. Grevillot, D. Bertrand, F. Dessy, N. Freud, and D. Sarrut. A Monte Carlo pencil beam scanning model for proton treatment plan simulation using GATE/GEANT4. Physics in Medicine and Biology, 56(16), ,
58 IOP PUBLISHING Phys. Med. Biol. 56 (2011) PHYSICS IN MEDICINE AND BIOLOGY doi: / /56/16/008 A Monte Carlo pencil beam scanning model for proton treatment plan simulation using GATE/GEANT4 L Grevillot 1,2, D Bertrand 2, F Dessy 2, N Freud 1 and D Sarrut 1 1 Université de Lyon, CREATIS; CNRS UMR5220; Inserm U1044; INSA-Lyon; Université Lyon 1; Centre Léon Bérard, Lyon, France. 2 IBA, B-1348, Louvain-la Neuve, Belgium. [email protected] Received 28 February 2011, in final form 9 June 2011 Published 26 July 2011 Online at stacks.iop.org/pmb/56/5203 Abstract This work proposes a generic method for modeling scanned ion beam delivery systems, without simulation of the treatment nozzle and based exclusively on beam data library (BDL) measurements required for treatment planning systems (TPS). To this aim, new tools dedicated to treatment plan simulation were implemented in the Gate Monte Carlo platform. The method was applied to a dedicated nozzle from IBA for proton pencil beam scanning delivery. Optical and energy parameters of the system were modeled using a set of proton depth dose profiles and spot sizes measured at 27 therapeutic energies. For further validation of the beam model, specific 2D and 3D plans were produced and then measured with appropriate dosimetric tools. Dose contributions from secondary particles produced by nuclear interactions were also investigated using field size factor experiments. Pristine Bragg peaks were reproduced with 0.7 mm range and 0.2 mm spot size accuracy. A 32 cm range spreadout Bragg peak with 10 cm modulation was reproduced with 0.8 mm range accuracy and a maximum point-to-point dose difference of less than 2%. A 2D test pattern consisting of a combination of homogeneous and high-gradient dose regions passed a 2%/2 mm gamma index comparison for 97% of the points. In conclusion, the generic modeling method proposed for scanned ion beam delivery systems was applicable to an IBA proton therapy system. The key advantage of the method is that it only requires BDL measurements of the system. The validation tests performed so far demonstrated that the beam model achieves clinical performance, paving the way for further studies toward TPS benchmarking. The method involves new sources that are available in the new Gate release V6.1 and could be further applied to other particle therapy systems delivering protons or other types of ions like carbon. (Some figures in this article are in colour only in the electronic version) /11/ $ Institute of Physics and Engineering in Medicine Printed in the UK
59 5204 L Grevillot et al 1. Introduction The physical advantage of hadron therapy over conventional radiotherapy is better dose conformation to the tumor and a lower integral dose to healthy tissues (Suit et al 2010). It has been shown that the integral dose delivered by proton therapy is about half that of intensity modulated radiation therapy (Lomax et al 1999). In the case of heavier ions like carbon ions, an additional biological effect is produced in the tumorous area, allowing us to treat radio-resistant tumors (Amaldi and Kraft 2005). Pencil beam scanning (PBS) delivery (also called active scanning) is currently the most advanced technique for ion-beam therapy. It has been used since the end of 1996 at the Paul Scherrer Institute (PSI) in Switzerland for proton therapy (Lomax et al 2004) and since 1997 at the Gesellschaft für Schwerionenforschung (GSI) in Germany with carbon-ions (Amaldi and Kraft 2005). The superior ballisitic of dose distributions obtained with ions makes the treatment planning quality assurance process more complex. Monte Carlo codes have been used to benchmark treatment planning systems (TPS) for many years in conventional radiation therapy (Chetty et al 2007, Rogers 2006, Verhaegen and Seuntjens 2003). Some dedicated Monte Carlo codes have been developed for conventional radiotherapy (Kawrakow and Walters 2006) and proton therapy (Tourovsky et al 2005). Using a generalistic Monte Carlo code, like Geant4, makes it possible to evaluate combined treatment modalities such as, for instance, those using combinations of photon and proton beams (Seco et al 2007). Geant4 has been used extensively at the Massachusetts General Hospital in Boston for proton therapy applications using passive spreading techniques (Paganetti et al 2008). In this work, we used the Geant4-based Gate toolkit release V6.0 (Jan et al 2011) combined with Geant4.9.2p04 for active beam delivery simulations. Initially, Gate was developed to facilitate the use of Geant4 for TEP and SPECT simulations (Jan et al 2004). Later, the capabilities of the Gate platform have been extended to other type of medical applications, like radiation therapy (Grevillot et al 2011,Janet al 2011). For passive spreading irradiation, it was found necessary to simulate beam interactions throughout the nozzle, because the spreading, modulation and shaping of the beam are fully determined by the different elements encountered in the nozzle (Paganetti et al 2004, Cirrone et al 2005, Stankovskiy et al 2009). In contrast, for active beam delivery, only few elements are present in the nozzle. They do not actively participate in the shaping of the beam, even if they may slightly modify its physical properties. Recently, Monte Carlo models of an active beam scanning proton therapy nozzle have been proposed by the MD Anderson Cancer Center using Geant4 (Peterson et al 2009) and MCNPX (Sawakuchi et al 2010), by simulating the beam interactions inside the nozzle. The advantage of such a method is the detailed description of the beam interactions within each element of the nozzle that might contribute to the beam spreading and secondary particle production. In contrast, we propose an alternative and generic method allowing us to simulate active beam delivery systems for ion-therapy, without simulating the treatment nozzle. The key advantage of our method is that it only requires the beam data library (BDL) measurements of the system, which are used by TPS manufacturers to create the beam model. This modeling technique relies on the fact that the nozzle elements do not have a strong influence on the beam characteristics. Moreover, their impact will be somehow included in the BDL measurements and therefore indirectly taken into account in the modeling. The proposed method has been tested for an IBA s proton therapy active scanning system, but we believe that it could be applied to other types of ions and delivery systems. The tools presented in this paper have been released in the new Gate version V6.1, which is compatible with Geant4.9.3 and Geant4.9.4 releases. 49
60 Pencil beam scanning using GATE 5205 Figure 1. Treatment delivery system from the nozzle entrance. The main components of the nozzle are the quadrupoles (QUAD), the scanning magnets in the x andy directions (SMX, SMY), the ionizations chambers (ICs) and the vacuum windows. When leaving the nozzle, the beam can still encounter beam modifiers before it reaches the patient. The proposed source model starts right at the nozzle exit, allowing us to include such geometries in the simulation. 2. Materials and methods 2.1. Nozzle output beam modeling method In this section, we describe a generic method to determine the physical properties of the delivery system, based on a set of reference measurements (see section 2.2). BDL measurements characterize the beam at the nozzle exit, before it reaches the patient. In contrast, each single pencil beam of a DICOM RT PLAN is characterized by its energy at the nozzle entrance. A schematic view of the treatment delivery system is presented in figure 1. Therefore, it appears necessary to characterize the physical properties of the beam at the nozzle exit as a function of the beam energy at the nozzle entrance. To this aim, we have chosen to create a new source in Gate called GateSourcePencilBeamScanning, allowing us to define single pencil beams (section 2.1.1). A second source called GateSourceTPSPencilBeam was next developed in order to simulate bundles of single pencil beams such as used in clinical practice (section 2.1.2) GateSourcePencilBeamScanning. A pencil beam is characterized by its energy and optical properties (figure 2). The energy spectrum is considered Gaussian, with a mean energy E 0 and an energy spread σ E (standard deviation). Optical properties are independent of energy properties. Optical properties are described by the following three parameters in the x and y directions (+z being the default direction of the beam): spatial beam spread distribution (beam or spot size) σ x in x and σ y in y angular spread distribution (beam divergence) σ θ in x and σ φ in y beam emittance (beam size and divergence phase space area) ɛ x,θ in x and ɛ y,φ in y. The spatial and angular beam spread distributions are Gaussian and correlated. This correlation is described by the emittance parameter defined as the elliptic phase space area and is responsible for the rotation of the phase space, as presented in figures 2(b), (c) and (d). The pencil beam source proposed allows us to define non-symmetrical spot configurations. 50
61 5206 L Grevillot et al 10 (a) Beam extent σ x (mm) Position along the beam path z (mm) θ (mrad) (b) f(x,y) x (mm) θ (mrad) (c) f(x,y) x (mm) θ (mrad) (d) f(x,y) x (mm) Figure 2. Illustration of the beam optical properties in the XoZ plan. (a) Beam size variations (σ x ) along the beam axis z, due to the beam divergence (σ θ ). The correlation between beam size (σ x ) and divergence (σ θ ) is illustrated in figures (b), (c) and (d), showing the rotation of the elliptic phase space along the beam axis at three positions, 120, 0 and +120 mm, respectively. The colored scale refers to the normalized proton probability density function in the phase space. A similar relationship holds in the YoZ plan GateSourceTPSPencilBeam. To simulate a treatment plan, the GateSourceTPSPencil- Beam source requires two input files: the source description file and the plan description file. The source description file describes the beam delivery system by a collection of polynomial equations allowing us to compute the optical and energy properties of every single pencil beam at the nozzle exit, as a function of the beam energy at the nozzle entrance. Therefore, it contains eight equations: two equations describe energy properties (E 0 and σ E ) and six describe optical properties (σ x, σ θ, ɛ x,θ, σ y, σ φ, ɛ y,φ ), each equation being a function of the energy at the nozzle entrance. The user can define the polynomial order of each equation and then the corresponding coefficients. For instance, to define a N order polynomial equation for the energy spread σ E (E), the user must define the N coefficients a i, with E the beam energy (at the nozzle entrance) and i the coefficient order: N σ E (E) = a i E i. (1) i=0 The source description file also contains the position of the two scanning magnets relatively to the isocenter and the distance between the nozzle exit and the isocenter, in order to compute the position and direction of each pencil beam at the nozzle exit. The plan description file describing the treatment plan contains one or multiple fields, each being described by a gantry angle and a collection of pencil beams (section 2.1.1). Each pencil beam is characterized by its weight, its position in the isocenter plan and its energy at the nozzle entrance. Weights can be expressed as a number of protons, or as monitor units (MU), that are internally converted into a number of protons as a function of 51
62 Pencil beam scanning using GATE 5207 Figure 3. The proposed method allows for producing a source description file based on BDL measurements. This file together with a plan description file are then used as input in Gate for treatment plan simulation. The resulting simulated dose map is further compared with measurements using appropriate tools. the proton stopping power in air. A treatment plan can be evaluated either by simulating all fields simultaneously or by simulating each field separately. The goal of the proposed method is to produce a specific source description file for each delivery system. The source description file produced in this paper is a property of IBA, but is available upon direct request [email protected]. A schematic view of the global process allowing us to assess complex 3D treatment plans is presented in figure Modeling the beam optics. In this paper, spot size will always refer to one standard deviation of the Gaussian spots. From spot size measurements at the nozzle exit and around the treatment isocenter (figure 4(a)), it was found that variations of the beam size with depth could be modeled linearly as a function of the distance to the isocenter for every energy (figure 4(b)). The slope of the linear fit for each energy corresponds to the beam divergence and allows easy computation of the spot size at the nozzle exit. We further corrected the beam intrinsic divergence at the nozzle exit by eliminating any additional divergence due to scattering in air using a quadratic rule: σ 2 θ Noz = σ 2 θ Iso σ 2 θ Air, (2) where σ θnoz is the intrinsic beam divergence in the x direction at the nozzle exit, σ θiso is the beam divergence in the x direction estimated from the measurements in air at the isocenter and σ θair is the estimated divergence increase due to interactions in air between the nozzle exit and the isocenter. The same rule was applied in the y direction. The divergence increase in air was estimated by Monte Carlo simulation and fitted using a second-order polynomial as a function of the beam energy. As the beam at the nozzle exit was considered purely divergent, the beam emittance was set empirically to half the beam size (at the nozzle exit) times the beam divergence times π. The beam size (σ x and σ y ), divergence (σ θ and σ φ ) and emittance (ɛ x,θ and ɛ y,φ ) estimated at the nozzle exit for 27 energies were then fitted using six polynomial 52
63 5208 L Grevillot et al (a) (b) Figure 4. (a) Illustration of the measurement of the dose profiles around the treatment isocenter: one can see the nozzle exit on the left and the sliding scintillating screen mounted on lateral rods on the right part. (b) Sample of the measured spot sizes for three energies and six positions. The points represent the measured values with associated error bars and the lines correspond to the linear modeling. Figure 5. Sample of measured spots at the isocenter at three energies: 140, 180 and MeV. The color scale represents the dose. equations as a function of the energy at the nozzle entrance. The six equations obtained for the beam optical properties were inserted in the source description file. A sample of measured spots is presented in figure Modeling the energy spectrum. For each measured Bragg peak, we calculated the physical range in water, defined as the distal 80% dose point. A water equivalent path length was added to account for the energy loss in air between the nozzle exit and the patient. Conversion of ranges into energies was performed using the NIST PASTAR database (Berger et al 2009), as already presented in (Grevillot et al 2010). Finally, a third-order polynomial was used to fit the energy at the nozzle exit as a function of the energy at the nozzle entrance. The energy spread is a key parameter that influences the peak-to-plateau ratio and distal falloff slope. We knew that its value increases from about 0% at 230 MeV, up to about 0.7% at 100 MeV (Grevillot et al 2010). As the fraction of energy scored in the ionization chamber depends also on the optical properties of the beam, the beam optic parameters presented in the previous section were integrated in the simulations. The best energy spread was then selected 53

64 Pencil beam scanning using GATE 5209 Figure 6. Sample of measured and simulated depth dose profiles for four energies: 226.7, 180, 140 and 100 MeV. empirically by simulating different energy distributions around the estimated value with 0.1 MeV resolution. The best energy spread was determined by evaluating the dose-to-peak and mean point-to-point dose differences. The dose-to-peak difference corresponds to the percentage of difference between measurement and simulation for the maximum dose point. The mean point-to-point deviation was evaluated using the following equation: N ( di dref i ɛ = ) i, (3) dref i L i=1 where ɛ is the mean point-to-point dose deviation, i corresponds to a given curve point, N is the number of points evaluated, i is the distance between two consecutive points, L is the integration length and corresponds to the distance between the first measured point and the range, d i and dref i are the evaluated and reference doses, respectively. Eventually, a third-order polynomial function was used to fit the curve of energy spread at the nozzle exit as a function of energy at the nozzle entrance. The two equations obtained for the beam physical properties were inserted in the source description file. A sample of measured and simulated depth dose profiles is presented in figure 6. The method presented to model the beam optics and energy spectrum of the system has to be performed once, and the source description file obtained can then be used as input for all subsequent treatment plan simulations Reference measurements BDL measurements (depth dose profiles and spots) were performed at 27 energies between 100 and MeV, witha5mevincrement Spot sizes in air. Spot sizes were measured in air at five depths around the isocenter: 20 cm, 10 cm, isocenter, +10 cm, +15 cm, in order to evaluate beam size variations with depth. Additional measurements were performed close to the nozzle exit ( 39 cm), to better estimate the beam divergence (figure 4(b)). Measurements were performed using an electronic portal imaging device (Lynx, FIMEL) with a working area of mm 2 and a pixel resolution of 0.5 mm. The device was attached to the nozzle using two lateral rods, 54
65 5210 L Grevillot et al which allowed for sliding the scintillating screen at several predefined positions (figure 4(a)). The measurements were fitted automatically with a two-dimensional Gaussian function in order to accurately and reproducibly extract the spot sizes in the x and y directions. Spot size measurement accuracy was estimated to be within 0.1 mm Pristine Bragg peak in water. Pristine Bragg peaks were measured in a cm 3 water phantom (Blue Phantom R, IBA-Dosimetry). Two large Bragg peak chambers (PTW type 34070) with a 10.5 cm 3 sensitive volume and a collecting electrode of 81.6 mm in diameter were used, so that the proton beams were integrated within the sensitive volume of the chamber. The first chamber was placed at the phantom entrance and used as a reference chamber to eliminate beam fluctuations. The second chamber was placed in the phantom and moved along the beam axis with a step size between 0.3 mm in the Bragg peak region and 3 mm at high energy in the plateau region. The measured range accuracy was estimated to be within 0.5 mm and the measured dose fluctuations within 1%. It is noteworthy that pencil beams were not fully measured by the ionization chamber. It has been demonstrated using the MCNPX Monte Carlo code that scoring the energy in cylindrical tallies of radius 4.08 or 10 cm under-estimates the energy deposited in certain regions of the Bragg curve by up to 7.8% and 1.4%, respectively, when compared to energy scored in cuboid tallies with a resolution of cm 3 (Sawakuchi et al 2010). Cylindrical tallies with 4.08 cm radius represent the largest commercially available chambers. We performed similar comparisons using Geant4 for the highest system energy configuration, which delivers a MeV beam, with a spot size of about 3 mm in air at the isocenter. The maximum dose differences observed were 5% and 1%, respectively, when comparing cylindrical dosels 3 of radius 4.08 cm and 10 cm, with square dosels of cm 3 (figure 7). Assuming that the maximum spot size of a MeV proton beam in water is about 2.5 times that of the spot at the phantom entrance, the maximum spot size in this case is approximately 7.5 mm. We can consider that about 99.7% of the protons are located within three standard deviations, i.e. within 22.5 mm from the beam axis, while the chamber radius is 40.8 mm. Therefore, the missing energy is not likely to be associated to primary protons scattered outside the chamber volume by Coulomb scattering, but rather to non-elastic hadronic collisions and light fragments not measured by the chamber. This statement is supported by the results of a simulation showing that the maximum under-estimation of the deposited energy is somewhere around mid-range (figure 7). As a consequence, the cylindrical geometry of the ionization chamber was always reproduced in the simulations in order to provide relevant comparisons with measurements Simulation environment The number of processes, models and cross-section data available in Geant4 makes it not only flexible but also a complex tool to configure (Geant4-Collaboration 2009). There are also numerous parameters that can be adjusted, depending on the application type. For high precision simulations, Geant4 proposes a physics-list with default parameter values (Geant4 Electromagnetic Standard Working Group 2009). In previous works, we have investigated the main relevant parameters for proton therapy (Grevillot et al 2010) and carbon ion therapy (Zahra et al 2010) applications and their impact on the dose accuracy and computation time. Usually, the physics models and parameters used in Geant4 are referred to as physcis-list. We decided to differentiate these two concepts by proposing a reference physics-list with an optimized parameters-list, allowing us to reach a clinical level of dose accuracy with 3 dosel: dose scoring voxel. 55
66 Pencil beam scanning using GATE 5211 Figure 7. Simulated dose difference between depth dose profiles scored in cylindrical dosels of radius 4.08 and 10 cm, when compared to the depth dose profiles scored in squared dosels of cm 3. Energy deposit difference corresponds to the left axis. The depth dose profiles scored in squared dosels of cm 3 and in cylindrical dosels of 4.08 cm in radius are also presented and refer to the right axis. high simulation efficiency. In this context, we used the Geant4 option three parameters with additional steplimiter, range cut and tracking cut values of 1 mm (Grevillot et al 2010). We selected the standard electromagnetic package, combined with the precompound model for non-elastic hadronic interactions. The only difference from our previous work (Grevillot et al 2010) was the addition of a 1 mm tracking cut: as we did not produce secondaries with a range larger than 1 mm, we decided not to track them once their residual range was lower than 1 mm. Unless otherwise specified, the physics-list and parameters-list presented above were used by default. In order to assess simulations with reference measurements presented in section 2.2, depth dose profiles were scored in cylindrical dosels of 4.08 cm in diameter with 0.5 mm resolution. Simulated and measured depth dose profiles were normalized to the integral dose deposited. Simulation agreements with measurements were evaluated in terms of range, mean point-to-point and dose-to-peak differences. The clinical range refer to the distal 90% dose point in the Bragg peak and is used to define the treatment plans. Therefore, in this paper we evaluated the accuracy of the simulated clinical ranges, instead of the physical ranges. Spot sizes were scored using a phase space actor (Jan et al 2011), placed perpendicularly to the beam direction at different positions around the isocenter (according to the measurements), in order to score the proton fluence. A grid resolution of mm 2 was used in order to reproduce the imaging device resolution. Gaussian fits were applied on the simulated spot profiles using ROOT (Brun and Rademakers 1997), in order to compare measured and simulated spot sizes. The simulation statistical uncertainties (as presented in Grevillot et al (2011)) were always below 2% and even below 1% in most of the cases. 3. Results and discussion 3.1. Assessment of single pencil beams The proposed method allowed for estimating the optical and energy properties of the system at the nozzle exit, as a function of the energy at the nozzle entrance. Then, polynomial 56
67 5212 L Grevillot et al (a) (b) Figure 8. (a) Blue points correspond to the best energy spread estimation (in %), obtained with a 0.1% step. Based on these points, the relative (in %) and absolute (in MeV) energy spread at the nozzle exit were fitted as a function of the energy at the nozzle entrance and correspond to the dashed blue and dotted pink lines, respectively. The estimated energy at the nozzle exit is also presented as a green line and refers to the right axis. (b) Comparisons of simulated and measured Bragg peaks for 27 energies and the range agreement, mean point-to-point and dose-topeak differences. Lines between the points are to guide the eyes only. Landmarks at ±2%, ±1% and 0% are also displayed. equations were used to parametrize the estimated values. Therefore, for both optical and energy parameters, we first estimated the bias introduced by the parametrization. In a second stage, we assessed the global modeling accuracy by comparing simulated and measured values Depth dose profiles. The maximum energy difference between the estimated and fitted energies was 0.27 MeV, resulting in a maximum range difference of 0.6 mm. In most of the cases however (>80% of the points), the range difference introduced by the fit was lower than 0.3 mm. The maximum energy spread difference introduced by the fit was 0.11 MeV. We recalculated the set of 27 Bragg peaks (using the source description file) and compared the clinical range agreement, the mean point-to-point and dose-to-peak differences. Results are presented in figures 8(a) and (b). For all energies tested, the clinical range agreement was better than 0.7 mm and even below 0.5 mm in most of the cases. Therefore, the main source of range discrepancy is not the Monte Carlo code itself, but rather the parametrization. The range precision of the model depends strongly on the range to energy calibration of the system: for instance, if the difference between the expected and the calibrated ranges of the system are alternatively +0.4, 0.4, +0.4 mm for three consecutive points, the fit function may introduce a range difference in the order of 0.5 mm for the mid point. The dose-to-peak and mean point-to-point dose differences were always below 2.3% and even below 2% in most of the cases. The mean point-to-point dose difference increased with energy, illustrating the better description of the Bragg peak at lower energy. The results obtained are clinically acceptable and validate the modeling of the energy parameters Spot sizes. The linear modeling of spot size variations with depth as presented in figure 4(b) allowed us to estimate the spot sizes within ±0.15 mm for 27 energies and for five positions around the isocenter and at the nozzle exit. The spot sizes around the isocenter were recalculated using the source description file. Results are presented in figure 9. 57
68 Pencil beam scanning using GATE 5213 Figure 9. Difference between simulated and measured spot sizes at the isocenter for 27 energies in the x and y directions. The measured spot sizes at the isocenter are reproduced by the simulation within ±0.2 mm. Therefore, as was the case for the energy spectrum, the main source of discrepancy is not the Monte Carlo code itself, but the parametrization. The modeling accuracy strongly depends on the smoothness of the spot size variations with energy. Sharp spot size variations around the trend-line are poorly accounted for by the model, as observed around 150 MeV in the x direction. Spot sizes were reproduced within ±0.4 mm for all other positions away from the isocenter. These results are clinically acceptable and validate the modeling of optical parameters Validation of the beam modeling using 2D and 3D plans Spread-out Bragg peak. A spread out Bragg peak (SOBP) was measured in water using a PPC05 (IBA-Dosimetry) ionization chamber, with an active volume of 0.05 cm 3 and a collecting electrode of 1 cm in diameter. The chamber was placed in the water phantom and scanned along the beam axis with 10 and 2.5 mm steps in the plateau and SOBP regions, respectively. The treatment isocenter was set at 7 cm below the water surface. Measurements were based on a plan created using the XiO R TPS from Elekta. It contained one field made of 11 iso-energy layers modulated between 22 and 32 cm and 2446 spots with an iso-spacing of 8 mm in both directions, allowing the irradiation of a cube of cm 3 in water. Simulated doses were scored in a cylindrical volume of 1 cm in diameter, with a 1 mm resolution, in order to simulate the cylindrical geometry of the chamber. The simulations were normalized to the measurements in the middle of the SOBP. They allowed us to evaluate the treatment plan integration in Gate, with respect to the accuracy of Geant4 models for dose calculation in water. Each single pencil beam had to be correctly modeled (source description file) and weighted (plan description file). The dose measured at each point depends not only on direct dose contributions from spots delivered along the beam axis and nearby pencil beams, but also on indirect dose contributions from nuclear interactions and secondary particles. The comparison between simulated and measured SOBPs is presented in figure 10. The result is satisfactory, with a clinical range agreement of 0.8 mm and a maximum dose difference below 2% for each point from the plateau region up to the distal fall-off. In the SOBP region, the measured ripples are nicely reproduced by the simulation. In the plateau region, the simulation 58
69 5214 L Grevillot et al Figure 10. Comparison between simulation and measurement for a 32 cm range SOBP, modulated between 22 and 32 cm. tends to overestimate the dose compared to measurements. The range and dose differences between simulation and measurements of the SOBP are consistent with the previous results obtained for pristine Bragg peaks Beam halo. The transverse dose spreading of each single pencil beam is due to Coulomb scattering interactions and hadronic collisions. The dose of a pencil beam can spread far away from its main axis, because of non-elastic nuclear interactions. This effect has been first referred to as beam halo (Pedroni et al 2005) and later as low dose envelope (Sawakuchi et al 2010). Beam spreading is mainly due to interactions in the propagating material, but it can also be inherent to the beam line, mainly due to scattering in some specific components (Sawakuchi et al 2010). The integral dose contribution due to nuclear interactions increases with depth, while the beam halo FWHM is maximum at about mid-range (Pedroni et al 2005). Nuclear collisions are more important with high energy beams and could be responsible for about 10 15% of the total dose (Pedroni et al 2005). The impact of the beam halo is difficult to measure for single pencil beams, while it is more visible with large fields. The field size factor (FSF) has been defined as the ratio between the dose at the center of a given square field with a given size f and the dose at the center of a square reference field with a size f = 10 cm (Sawakuchi et al 2010). We measured FSFs at several depths d (10, 20 and 30 cm), for four mono-energetic square fields (226, 200, 180 and 160 MeV) and for five field sizes (4, 6, 8, 10 and 12 cm). The spot spacing was 2.5 mm in the x and y directions and all spots had exactly the same weight. Measurements were performed with a Scanditronix Wellhofer CC13 ionization chamber having an active volume of 0.13 cm 3. Simulated doses were scored in 5 5 5mm 3 dosels, in order to reproduce the ionization chamber active volume. An increased dose in the center was expected for larger field sizes, as the number of pencil beams was higher. The additional dose measured for larger fields is assumed to result from either direct dose contribution from nearby pencil beams or indirect dose contribution from secondary protons and fragments resulting from nuclear interactions. We assumed that the direct dose contribution from a nearby pencil beam occurs only if the lateral distance between the beam and the center of the field is within three standard 59
70 Pencil beam scanning using GATE 5215 (a) (b) Figure 11. Measured FSFs: (a) for four energies and five field sizes at d = 10 cm, (b) for three energies and five field sizes at d = 20 cm. Table 1. This table summarizes the FSF differences between simulations and measurements for four fields, three depths and four energies. Energy (MeV) f(cm) / d(cm) % 0.4% 0.7% 1.0% 0.8% 0.4% 0.3% 1.8% 6 2.4% 0.8% 0.5% 0.3% 0.8% 0.5% 0.0% 2.0% 8 1.1% 1.2% 0.4% 0.0% 0.6% 1.3% 1.9% 0.4% % 3.2% 0.5% 1.5% 1.3% 1.8% 1.1% 0.8% deviations of the spot size. The largest spot size is about 8 mm in the Bragg peak region for a 226 MeV beam; hence, the largest lateral distance allowing direct dose contribution is about 2.4 cm. For other energies, direct dose contribution is restricted to f = 4 cm. Therefore, FSFs measured in these experiments are mainly representative of indirect dose contribution from non-elastic hadronic interactions. FSF simulations agreed with measurements within 2% for all but two points. The maximum difference was 3.2%. The overall results are satisfactory, even though there is no clear explanation for the larger 3.2% dose difference. As the number of non-elastic nuclear interactions increases with beam energy, larger differences between simulations and measurements are likely to occur at higher energies, notably due to uncertainties in nuclear cross sections. Uncertainties in total non-elastic and doubledifferential cross-sections are estimated in the order of 5 10% and 20 40%, respectively (ICRU 2000). Results are summarized in table 1. Due to nuclear interaction increase with energy, we expected larger FSF variations as a function of f at high energy compared to low energy. This was confirmed by measurements, as presented in figures 11(a) and (b). Interestingly, the opposite effect has been observed in a separate study (Sawakuchi et al 2010): larger FSF variations as a function of f were observed at low energy compared to high energy. In fact, the spot sizes were significantly bigger: about 4, 2 and 1.5 cm in FWHM, at 72.5, and MeV, respectively. Therefore, direct dose deposition from nearby pencil beams significantly contributed to the measured FSFs, even at low energy (largest spots), which might explain the inverse FSF variation trend associated with f. It is noteworthy that the range of energies in this study, from 72.5 MeV up to MeV, was much larger than in our experiments, from 160 MeV up to 226 MeV. 60
71 5216 L Grevillot et al (a) (b) Figure 12. Measured dose map for the 117 MeV (a) and 226 MeV (b) beams. The extra black line drawn in (a) shows the position of the transverse dose profiles evaluated in figure 13. Thelow energy test pattern seems to be blurred, when compared to the high energy one, because the spot sizes are larger Test pattern. A two-dimensional test pattern consisting of a combination of particular shapes, in a field of cm 2 was performed. This test, which contains a combination of homogeneous and high-gradient dose distributions was designed to evaluate the IBA s PBS system capabilities. Measurements were performed in air at the isocenter, using the Lynx scintillating device (described in section 2.2.1) at three energies: 117, 181 and 226 MeV, without insertion of additional material between the nozzle exit and the measuring tool. Figure 12 illustrates the measured dose maps for the 117 MeV and 226 MeV beams. For evaluating the system, the measured test patterns were compared to an expected dose map. Expected dose maps were calculated using the Matlab R software from MathWorks, by convolving the spot sizes and positions according to their weights. To evaluate our Monte Carlo code, the references were the measurements, but additional comparisons with the expected dose maps were also found to be useful. We will refer to these three types of dose map as measured, expected and simulated dose maps. This test allowed for evaluating the correct weighting and transverse position of each single pencil beam used in the treatment plan. In such a configuration, each proton contributes to one single point in the map. Therefore, the production time of each new proton becomes important when compared to its tracking time. Even the simulation time of the ionization process in air between the nozzle exit and the treatment isocenter becomes significant. Therefore, the range cut for secondary production due to electromagnetic interactions (electrons, positrons and photons) was set to 1 m. An additional volume of air of 5 cm thickness was set before the isocenter witha1mmrange cut, in order to account for the electrons produced. This increased the simulation efficiency by a factor of 10. The dose maps were scored in water volume of mm 3 with a dosel size of mm 3, in order to mimic the scintillating device resolution. All dose maps (measured, expected and simulated) were normalized to 50% in a homogeneous region of interest located in the center of the test pattern, so that the maximum doses delivered were about 100%. Their origins were corrected using four landmarks located in each corner of the test pattern. We compared the two-dimensional dose-maps using the OmniPro-I mrt R software (IBA-Dosimetry). Gamma indices were evaluated for all points receiving more than 0.2% of the maximum dose, using a 2%/2 mm criterion. At high energy, spot sizes are 61
72 Pencil beam scanning using GATE (a) (c) 5217 (b) (d) Figure 13. 2%/2 mm gamma index comparison between simulation and expected dose map (a) and between simulation and measurement (b), for the 117 MeV plan. Points having a gamma value larger than 1 do not pass the comparison. Transverse dose profile comparisons for the same beam energy, between simulation and expected dose map (c) and between simulation and measurement (d) are presented for the x direction at y = 8.81 cm, as referred to by the black line in figure 12(a). known to be smaller and dose distributions sharper; hence, the gamma index comparisons were expected to be improved at low energy. Gamma index comparisons between simulations and measurements are summarized in table 2. The overall agreement between simulations and measurements is satisfactory, with a gamma index better than 97% for the three energies tested. Figure 13 shows transverse dose profiles and gamma comparisons between simulation and measurement and between simulation and expected dose map, for the 117 MeV plan. In high-dose regions, the maximal measured dose is lower than the simulated one. This could be due to a dose saturation effect in the detector. As all spots, but those in high-dose regions seem to be correctly weighted, we presume that the scintillating screen was saturated. When comparing simulations with expected dose maps, the dose overestimation in high-dose regions is no longer observed, consolidating the possibility of detector saturation. When comparing simulations with measurements, a larger disagreement is visible on the edge of the field. This disagreement is not visible when comparing simulations with expected dose maps, suggesting a dose measurement artifact on the side of the imaging device. Agreements are better between simulations and expected doses than between simulations and measurements. This is due to the fact that measurements and beam delivery suffer from other sources of uncertainty. As concerns measurements, dose saturation and side effects, such as dose response differences between the center and the sides of the imaging device may occur. As concerns the beam 62
73 5218 L Grevillot et al Table 2. Gamma index comparisons for the 117, 181 and 226 MeV plans, using a 2%/2 mm gamma criterion. Energy (MeV) Gamma index % % % delivery, beam positioning accuracy and reproducibility were not taken into account in the Monte Carlo code. 4. Conclusion We have presented a generic method to model scanned ion beam delivery systems, without simulating the nozzle and based exclusively on BDL measurements of the system. New particle sources have been implemented in the Gate Monte Carlo platform in order to simulate single pencil beams and PBS treatment plans. The method has been applied to an IBA s proton PBS dedicated nozzle. The modeling of the irradiation system is based on a set of measurements at 27 energies between 100 and MeV, containing depth dose profiles in water and spot sizes in air. Simulated pristine Bragg peak ranges lie within 0.7 mm of measured values. Dose-to-peak and mean point-to-point differences between simulations and measurements are less than 2.3% for all energies. Spot sizes are reproduced within 0.4 mm around the isocenter (from 20 cm up to +15 cm) and within 0.2 mm at the isocenter. In a second stage, several 2D and 3D validation plans (SOBP, test pattern) were produced with the XiO treatment planing system. The simulation of a SOBP allowed for evaluating the correct intensity and physical properties of the delivered spots. The agreement was within 0.8 mm in range and 2% in dose for all points up to the distal fall-off. The simulation of FSF configurations for three depths, five field sizes and four energies, allowed us to evaluate the indirect dose contribution of secondary protons and fragments spreaded over the field. They laid within 2% for all points but two, with a maximum dose difference of 3.2%. A test pattern allowed for evaluating the correct position and intensity of each spot. More than 97% of the points successfully passed a 2%/2 mm gamma index comparison between simulations and measurements for three energies (117, 181 and 226 MeV). The validation tests performed so far have demonstrated that the beam model reaches clinical performances and can be used for TPS benchmarking. We believe that the proposed beam modeling method is sufficiently generic to be applied to other PBS systems with different types of ions, e.g. in active scanning carbon-therapy centers. The new tools presented are available in Gate release V6.1. Acknowledgments This work was conducted as a collaboration between the IBA Company and the Creatis laboratory. The research leading to these results has received funding from the (European Community s) Seventh Framework Programme ([FP7/ ] under grant agreement no References Amaldi U and Kraft G 2005 Radiotherapy with beams of carbon ions Rep. Prog. Phys Berger M J, Coursey J S, Zucker M A and Chang J 2009 Stopping Powers and Ranges for Protons National Institute of Standards and Technology (NIST) 63
74 Pencil beam scanning using GATE 5219 Brun R and Rademakers F 1997 ROOT an object oriented data analysis framework Proc. AIHENP 96 Workshop (Lausanne, Sept. 1996) Nucl. Instr. Meth. A Chetty I J et al 2007 Report of the AAPM Task Group No. 105: issues associated with clinical implementation of Monte Carlo-based photon and electron external beam treatment planning Med. Phys Cirrone G A P, Cuttone G, Guatelli S, Nigro S L, Mascialino B, Pia M G, Raffaele L, Russo G and Sabini M G 2005 Implementation of a new Monte Carlo GEANT4 simulation tool for the development of a proton therapy beam line and verification of the related dose distributions IEEE Geant4-Collaboration 2009 Physics Reference Manual for Geant4 CERN index.shtml Geant4 Electromagnetic Standard Working Group Grevillot L, Frisson T, Maneval D, Zahra N, Badel J N and Sarrut D 2011 Simulation of a 6 MV Elekta Precise Linac photon beam using GATE/GEANT4 Phys. Med. Biol Grevillot L, Frisson T, Zahra N, Bertrand D, Stichelbaut F, Freud N and Sarrut D 2010 Optimization of GEANT4 settings for proton pencil beam scanning simulations using GATE Nucl. Instrum. Methods Phys. Res. Sec. B: Beam Interact. Mater. At ICRU 2000 Nuclear data for neutron and proton radiotherapy and for radiation protection ICRU Report No 63 (Bethesda, MD: ICRU) Jan S et al 2011 GATE V6: a major enhancement of the GATE simulation platform enabling modelling of CT and radiotherapy Phys. Med. Biol Jan S et al 2004 GATE: a simulation toolkit for PET and SPECT Phys. Med. Biol Kawrakow I and Walters B R B 2006 Efficient photon beam dose calculations using DOSXYZnrc with BEAMnrc Med. Phys Lomax A J et al 2004 Treatment planning and verification of proton therapy using spot scanning: initial experiences Med. Phys Lomax A J, Bortfeld T, Goitein G, Debus J, Dykstra C, Tercier P A, Coucke P A and Mirimanoff R O 1999 A treatment planning inter-comparison of proton and intensity modulated photon radiotherapy Radiother. Oncol Paganetti H, Jiang H, Lee S Y and Kooy H M 2004 Accurate Monte Carlo simulations for nozzle design and commissioning and quality assurance for a proton radiation therapy facility Med. Phys Paganetti H, Jiang H, Parodi K, Slopsema R and Engelsman M 2008 Clinical implementation of full Monte Carlo dose calculation in proton beam therapy Phys. Med. Biol Pedroni E, Scheib S, Böhringer T, Coray A, Grossmann M, Lin S and Lomax A 2005 Experimental characterization and physical modelling of the dose distribution of scanned proton pencil beams Phys. Med. Biol Peterson S W, Polf J, Bues M, Ciangaru G, Archambault L, Beddar S and Smith A 2009 Experimental validation of a Monte Carlo proton therapy nozzle model incorporating magnetically steered protons Phys. Med. Biol Rogers D W O 2006 Fifty years of Monte Carlo simulations for medical physics Phys. Med. Biol. 51 R Sawakuchi G O, Mirkovic D, Perles L A, Sahoo N, Zhu X R, Ciangaru G, Suzuki K, Gillin M T, Mohan R and Titt U 2010 An MCNPX Monte Carlo model of a discrete spot scanning proton beam therapy nozzle Med. Phys Sawakuchi G O, Titt U, Mirkovic D, Ciangaru G, Zhu X R, Sahoo N, Gillin M T and Mohan R 2010 Monte Carlo investigation of the low-dose envelope from scanned proton pencil beams Phys. Med. Biol Sawakuchi G O, Zhu X R, Poenisch F, Suzuki K, Ciangaru G, Titt U, Anand A, Mohan R, Gillin M T and Sahoo N 2010 Experimental characterization of the low-dose envelope of spot scanning proton beams Phys. Med. Biol Seco J, Jiang H, Herrup D, Kooy H and Paganetti H 2007 A Monte Carlo tool for combined photon and proton treatment planning verification J. Phys.: Conf. Ser Stankovskiy A, Kerhoas-Cavata S, Ferrand R, Nauraye C and Demarzi L 2009 Monte Carlo modelling of the treatment line of the Proton Therapy Center in Orsay Phys. Med. Biol Suit H et al 2010 Proton versus carbon ion beams in the definitive radiation treatment of cancer patients Radiother. Oncol Tourovsky A, Lomax A J, Schneider U and Pedroni E 2005 Monte Carlo dose calculations for spot scanned proton therapy Phys. Med. Biol Verhaegen F and Seuntjens J 2003 Monte Carlo modelling of external radiotherapy photon beams Phys. Med. Biol. 48 R Zahra N, Frisson T, Grevillot L, Lautesse P and Sarrut D 2010 Influence of Geant4 parameters on dose distribution and computation time for carbon ion therapy simulation Physica. Medica
75 4.3. CONCLUSION & PERSPECTIVES 4.3 Conclusion & Perspectives In this study, we aimed at providing a general method for active scanning system modeling, based exclusively on beam data library measurements. This method has been successfully applied for one of the IBA proton therapy system. The proposed method was initially developed in order to be compliant with other particles such as carbon ions and other delivery systems. It would be interesting to apply the method to a carbon therapy center. As the proposed method does not simulate the nozzle elements, it would be interesting to compare our modeling with a full Monte Carlo simulation of the nozzle. This would allow quantifying the dose contribution from secondary particles produced in the nozzle and evaluate the dierences with our model. For patient treatments, some beam modiers may be inserted in the beam path at the nozzle exit, such as a range shifter or a ridge lter. The range shifter consists of a block of Lexan of 7.5 cm water equivalent thickness and is used to decrease the beam down to skin depth. The ridge lter is used to enlarge the Bragg peak thickness at low energies, in order to decrease the number of required layers. To illustrate, a ridge lter prototype is depicted in Figure 4.1. As GATE now allows simulating all kinds of treatment plans, it would be worthwhile to validate the platform in various conditions, using beam modiers, complex phantoms and appropriate measurements. (a) (b) Figure 4.1: This picture shows a preliminary design of a ridge lter (a), with a zoom on its complex structure (b) allowing to modulate the beam energy. 65
76 CHAPTER 4. PBS MODEL 4.4 Additional investigations This section presents additional results. They were not published, but propose some hints and research axes On inuence of non-elastic nuclear models The physics settings used in this thesis are described in chapter 3. In this chapter, the ionization chamber cylindrical geometry was neglected and depth-dose proles were simulated by integrating the dose transversally over the complete water phantom section. However, we saw in chapter 4 the importance of taking into account the ionization chamber geometry. Therefore, we checked the inuence of the precompound and binary cascade nuclear models, when taking into account the ionization chamber geometry. Interestingly, binary cascade is the best model for pristine peak simulations, as illustrated in Figure 4.2, when simulating the ionization chamber geometry. Doses were normalized relatively to the total energy deposited. The point-to-point (a) precompound 226MeV Simu Meas Err 4% (b) binary cascade 226 MeV Simu Mes Error 4% de/dx (A.U.) % 0% 2% de/dx difference de/dx (A.U.) % 0% 2% de/dx difference Depth in water (mm) 4% Depth in water (mm) 4% Figure 4.2: This gure depicts depth-dose proles computed using precompound (a) and binary cascade models (b) for a 226 MeV proton beam. Point-to-point dose dierences are presented with green dots and correspond to the right axis. dose dierences of precompound and binary cascade models are comprised within ±4% and ±2%, respectively, from the entrance to the distal fall-o. The beam modeling method presented in our paper has been reproduced using binary cascade instead of precompound model and a very similar energy spectra was obtained, with a slightly higher energy spread for higher energies (Figure 4.3 (a)). The largest dierences are observed for the largest energies, for which binary cascade gets closer to measurements. The mean point-to-point dose dierence does not increase with energy (Figure 4.3 (b)), in contrary to results presented for precompound in chapter 4. When simulating a full treatment plan such as the spread out Bragg peak presented in chapter 4, the best agreement is obtained with precompound, while a dose under-estimation in the order of 6-7% occur at the entrance for binary cascade (Figure 4.4). From pristine Bragg peak simulations, one could expect a better SOBP simulation with Binary cascade than with precompound, while the opposite occurred. The dose deposition of a proton beam is shared between primary protons, short range and long range secondary fragments. The evaluation of nuclear models is known to be very dicult when using pristine Bragg peaks, because secondary fragments escape far from the interaction point at several tenths of centimeters. Therefore, pristine Bragg peak measurements do not allow evaluating the long range spectra of secondary fragments. When simulating a spread out Bragg peak treatment plan in a virtual cubic target of cm 3 in 66
77 Energy Spread (a) 0.3 Energy Spread(%) 0.2 Fitted energy spread(%) 0.1 Fitted energy spread(mev) Fitted energy (MeV) Energy at nozzle entrance (MeV) Energy at nozzle exit Dose differences and range differences ADDITIONAL INVESTIGATIONS (b) Mean point-to-point dose difference (%) Dose-to-peak difference (%) Range agreement (mm) Energy (MeV) Figure 4.3: Tis gure is the reciprocal of gure 7 (b) from [108], but using binary cascade GATE precompound GATE binary cascade Measurements Dose (A.U) Dose difference Depth in water (mm) Figure 4.4: Evaluation of precompound and binary cascade nuclear models for a 32 cm range spread-out Bragg peak modulated between 22 and 32 cm. water, the dose contribution from secondary fragments at every measured position is signicant, because hundreds of pencil beam are generated. Therefore, the results obtained could be explained by a better description of the long range spectra of secondary fragments with precompound than with Binary cascade. Further tests would be necessary to conrm or invalidate this hypothesis. Additionally, dose by particle, as predicted by each of these two nuclear models has been evaluated for a 230 MeV mono-energy proton beam. Cut for electron production was set to 5 mm, so that no electrons were produced by ionization. About 0.3% of the total dose was attributed to the electrons of the simulation. These electrons might have been produced by photo-electric eect or nucleus de-excitation like internal-conversion. Photons and neutrons do not depose dose directly (less than 0.01% of the total), their energies are transferred to other particles. Thus, for neutrons we considered the dose deposited by all secondaries having a neutron as parent. Results considering proton dose and main fragments are summarized in Tables 4.1 and 4.2 and are illustrated in Figure 4.5. Based on nuclear interaction cross-section uncertainties, it is currently not possible to state which model is better. Uncertainties in total non-elastic and double-dierential cross-sections are estimated in the order of 5-10% and 20-40%, respectively [85]. From personal discussions 67
78 CHAPTER 4. PBS MODEL Protons Primary protons Secondary protons PreCompound 94.3% 85.9% 8.4% Binary cascade 98.2% 86.6% 11.6% Table 4.1: Dose deposited by primary and secondary protons. Fragments Deuton He3 Alpha Neutrons PreCompound 5.7% 2.7% 0.7% 1.1% 0.6% Binary cascade 1.8% 0.3% 0.1% 0.4% 1.2% Table 4.2: Dose deposited by secondary particles other than protons. Only the main fragments are presented. 1 (a) 1 (b) de/dx (A.U.) de/dx (A.U.) Total dose Protons Primary protons Secondary protons Neutron Fragments Alpha He3 Deuton Depth in water (mm) Depth in water (mm) Figure 4.5: Dose by particle: (a) corresponds to precompound model and (b) corresponds to binary cascade model. with Vladimir Ivantchenko from the CERN (GEANT4) [109], precompound model should not be considered as an alternative to binary cascade for high precision simulations, because quasielastic scattering is not implemented. Quasi-elastic scattering corresponds to elastic scattering on one nucleon of a nucleus. It is noteworthy that GEANT4 simulations have been extensively used for years in Boston [59], mainly for passive scattering. Initially, they used the precompound model [110] and later moved to binary cascade [34]. Recent active scanning proton beam modeling also preferred precompound model for dose calculation [60], but also for prompt gamma simulation [111]. β + emitter production following proton nuclear reactions are being investigated throughout the ENVISION 2 project and inside the OpenGate collaboration for Positron Emission Tomography (PET) imaging. Preliminary results suggest a better agreement with the binary cascade. To conclude, there is a room for investigations as far as nuclear models are concerned. The precise description of both: dosimetric and imaging applications in proton therapy with a common physics-list are challenging. Further, similar investigations will be necessary for carbon ion therapy, with an increased diculty due to projectile fragmentations. 2. ENVISION stands for European NoVel Imaging Systems for ION therapy: this project is leaded by the ENLIGHT community 68
79 4.4. ADDITIONAL INVESTIGATIONS Dierences between GEANT4.9.2 and GEANT4.9.4 For each GEANT4 release, modications of the default databases and improvements of the models lead to dierences in the particle spectra and energy loss in matter. Therefore, benchmarking the new GATE/GEANT4 releases is a prerequisite. In this section, test cases performed using either GATEV6.0 combined with GEANT4.9.2p02 or GATEV6.1 combined with GEANT4.9.4p01 are compared. These two congurations are referred to as Gate-G4.9.2 and Gate-G In Gate-G4.9.2, water was dened as a GATE material and the ionization potential was set to 75 ev. In Gate-G4.9.4, we used the G4_WATER material dened in GEANT4 according to ICRU'49 [73] and ICRU'73 [112] databases, with an ionization potential of 78 ev, in accordance with [113]. Using G4_WATER material was found necessary in order to reproduce results in close agreement with the previous release. There are several dierences between user materials such as water and GEANT4 materials such as G4_WATER. For instance, a user material is dened by a combination of elements and the stopping power is calculated using Bragg's rule of additivity. GEANT4 material stopping powers are dened based on compound specic tables and are therefore more precise. It is noteworthy that since GEANT4 release 9.3, the energy loss is a lot less sensitive to the ionization potential: changing the I value of water by 10% around I=75eV modies the range by about 1.2% and 0.3%, when using Gate-G4.9.2 and Gate-G4.9.4 con- gurations, respectively. From personal communications with Vladimir Ivantchenko from CERN (GEANT4) [109], this eect was attributed to dierent parameterizations of the correction terms included in the Bethe-Bloch equation, in particular the density eect. At therapeutic energies, a behavior similar to Gate-G4.9.2 is expected. It has been proven by computing the Bethe-Bloch equation presented in chapter 2 by hand. Therefore, the new stopping power parameterization of GEANT4.9.4 may lead to a sub-optimal account of tissue compositions. This bug will be corrected in the next GEANT4 release, in order to come back to a situation similar to GEANT4.9.2, i.e. by using the previous Bethe-Bloch equation parameterization. This study was divided in two parts: rst, we evaluated the inuence of the ionization potential on dierent NIST materials; second, two benchmarks presented in the previous chapters were reproduced with the Gate-G4.9.4 conguration. Inuence of the ionization potential One of the main sources of ion range uncertainty in human materials comes from the ionization potential [78]. When the ionization potential of a given material is not known, it can be computed by weighting the I value of the dierent constituents using Bragg's rule [79]. In patients, the ionization potentials of the dierent media are not known and therefore are internally calculated using Bragg's additivity rule. We compared NIST CSDA ranges with simulations for 5 human media and for water as dened in NIST, without setting the ionization potential (so that Bragg's rule was always used). Comparisons were performed for a 230 MeV proton beam using Gate- G4.9.2 and Gate-G4.9.4 and are summarized in Table 4.3. The calculated I values in GEANT4 are always lower than NIST, resulting in a lower simulated range. Moreover, I values calculated with Gate-G4.9.4 are always lower than with Gate-G A better range agreement with NIST is observed with Gate-G Benchmark 1: Pristine Bragg peak in water The rst benchmark was presented in details in chapter 3 and consists in the simulation of a mono-energetic Bragg peak of 230 MeV in water. Results are illustrated in Figure 4.6. The overall Bragg peak shapes are very similar. The Gate-G4.9.4 conguration has a slightly larger range and lower entrance dose. The physical ranges calculated with Gate-G4.9.4, Gate-G4.9.2 and NIST [76] are 330.3, and mm, respectively. The transverse prole standard 69
80 CHAPTER 4. PBS MODEL Compact Cortical Skeletal Adipose Water bone bone muscle tissue I (ev) Gate-G Gate-G NIST Ranges (mm) Gate-G Gate-G NIST Range variations (%) Gate-G Gate-G Table 4.3: This table summarizes the ionization potential and range dierences between GATE/GEANT4 and NIST, using Gate-G4.9.2 and Gate-G (a) Gate-G4.9.2 Gate-G4.9.4 err 2% 7E 10 Gate-G4.9.2 (b) Gate-G4.9.4 de/dx (MeV/mm/proton) % 0% 1% 2% 3% Energy deposit difference Absolute dose (Gy/proton) 6E 10 5E 10 4E 10 3E 10 2E 10 1E Depth in water (mm) 4% Lateral position (mm) Figure 4.6: Comparison of depth-dose (a) and transverse proles at 32 cm depth (b) for a 230 MeV proton beam in water using Gate-G4.9.2 and Gate-G In (a), the point-to-point energy deposit dierence is depicted with green dots and corresponds to the right axis. deviations obtained with a Gaussian t are similar (Table 4.4), suggesting that the multiple scattering algorithm of the new GEANT4 release was not signicantly modied for protons. The maximum dose dierences presented in Figure 4.6 (b) are due to dierences in range. The integral energy deposited per proton was and MeV using Gate-G4.9.2 and Gate-G4.9.4, respectively. Gate-G4.9.2 Gate-G4.9.4 σ 10cm (mm) σ 30cm (mm) σ 32cm (mm) Table 4.4: Comparison of the transverse dose spreading (σ) at 10 cm, 30 cm and 32 cm depth, for a 230 MeV proton beam in water using Gate-G4.9.2 and Gate-G The uncertainty on the σ values was estimated to be within 0.2 mm using ROOT [114]. 70
81 4.4. ADDITIONAL INVESTIGATIONS Benchmark 2: SOBP in water The second benchmark was presented in detail in chapter 4 and consists in the simulation of a spread out Bragg peak. Simulations were performed using the beam model presented in [108] for both Gate-G4.9.2 and Gate-G4.9.4 congurations. The results are illustrated in Figure 4.7. Simulations were normalized to the center of the SOBP. The overall depth-dose proles are in Dose (A.U) Gate-G4.9.4 Gate-G4.9.2 Measurement err Depth in water (mm) 4% 3% 2% 1% 0% 1% 2% 3% 4% Dose difference Figure 4.7: Evaluation of a 32 cm range spread-out Bragg peak modulated between 22 and 32 cm and simulated with Gate-G4.9.2 and Gate-G4.9.4 congurations. The point-to-point dose dierence between the two GATE/GEANT4 congurations is depicted with green dots and correspond to the right axis. good agreement, with point-to-point dose dierences that uctuate around 0. When comparing simulations with measurements, the dose agreement is better than 2% for all points between the entrance area up to the distal fall o. The measured and simulated ranges using Gate-G4.9.2 and Gate-G4.9.4 are 321.9, and mm, respectively. From these results, we consider that our beam model is validated for the new GATE/GEANT4 release Particularities of the PBS modality The previous SOBP benchmark was also computed with the XiO TPS using a 4 mm voxel size. Results are presented in Figure 4.8. A reversed build-up is produced by XiO in the entrance region due to dose scoring artifacts. XiO and measured ranges are and mm, respectively. The SOBP region is in close agreement with measurements, even if the grid size is too large to reproduce accurately the dose uctuations along the SOBP. The calculation does not reproduce the measurements in the entrance region. This is due to the fact that the spot size (standard deviation) is in the order of 3 mm at the entrance, while the spot spacing is 8 mm. Therefore, at the entrance, the transverse dose is not homogeneously distributed and the dose scoring is very sensitive to small shifts of the scoring grid and dosel size. In the SOBP region, the spot size reaches about 7 mm standard deviation, thus the transverse dose can be considered homogeneous. The good agreement obtained with Monte Carlo (Figure 4.7) was achieved by simulating the ionization chamber cylindrical geometry. Using squared dosels of 4 mm with GATE/GEANT4 resulted in a behavior similar to XiO (Figure 4.8 (b)). This benchmark is very specic to the pencil beam scanning treatment modality. When evaluating a TPS with such a complex set-up, with and without the transverse charge equilibrium 71
82 CHAPTER 4. PBS MODEL Dose (A.U.) x = -0.4 cm x = 0 cm x = 0.4 cm x = -0.2 cm x = 0.2 cm Measurement Depth in water (cm) Figure 4.8: Evaluation of a SOBP (benchmark 2) computed with XiO. Depth-dose proles computed by shifting lateraly the scoring grid by a few milimeters are displayed, illustrating the sensitivity of this set-up. in the SOBP and in the entrance regions, respectively, it is very dicult to gure out whether the dose calculation algorithm of the TPS is correct or not. Having a exible and robust calculation tool like Monte Carlo becomes very interesting in such tricky cases. 72
83 Chapter 5 TPS and Monte Carlo comparisons 5.1 Introduction In this study, our goal was to compare dose distributions computed with the XiO TPS and with the GATE/GEANT4 Monte Carlo platform. To achieve this task, I focused on the three following questions: 1. What are the main dierences between GATE and XiO physics implementations and their impacts on dose calculation? 2. How dierent are the two beam models implemented in GATE and XiO? 3. What kind of dierence can be expected from heterogeneities management? When comparing two dose engines, there are always dierences, because dose calculations are based on dierent physics implementations. For instance, TPSs rescale dose distributions, which are measured in water, while Monte Carlo calculates the integral depth-dose proles in medium based on the Bethe-Bloch equation. Therefore, the pristine Bragg peaks calculated in water with a TPS are likely to be as close as Monte Carlo to measured values. The power of Monte Carlo is not expected for simple cases, but for complex and heterogeneous geometries like patients. The limitation of Ray tracing algorithms in heterogeneous media is well known, as presented in chapter 1. To overcome this issue, TPSs currently use pencil beam algorithms, which consider that a spot can be described by a collection of weighted sub-spots (or beamlets), in order to better account for heterogeneities. This approach tends to the Monte Carlo method and as such is limited by the obvious trade-o between dose accuracy and calculation time. For passive scattering, the use of the GEANT4 code for treatment plan verication is already in use in Boston [59], but the platform is not publicly available. Most of the time, dierences were found to be clinically acceptable and were also attributed to dierences between the TPS dose to water and the Monte Carlo dose to medium [115]. Some limitations of pencil beam algorithms were recently identied for small elds [116], but they were estimated not to be clinically relevant for patients. We do expect dierences between Monte Carlo and TPS dose distributions, the question is to determine whether these dierences have a clinical outcome or not. In a rst stage, we tried to answer the rst question by working in a close relationship with the Elekta company and more specically with the TPS developers, in order to understand the physics implementation in XiO. As regards GATE/GEANT4, a reciprocal work has been already performed in chapter 3. In a second stage, we generated various test cases in homogeneous geometries in order to evaluate the characteristic physical properties of the beam models of the two dose engines. Stopping power evaluations and comparisons in heterogeneous geometries allowed answering the third question. 73
84 CHAPTER 5. TPS COMPARISONS The details of the GATE and XiO dose comparisons for proton PBS treatment plan simulations will be submitted to Physics in Medicine and Biology on August, 2011, but the current version is presented. 74
85 Article 3 L. Grevillot, D. Bertrand, F. Dessy, N. Freud, and D. Sarrut. GATE as a GEANT4-based Monte Carlo platform for proton Pencil Beam Scanning (PBS) treatment plans evaluation. To be submitted to Physics in Medicine and Biology, on August
86 GATE as a GEANT4-based Monte Carlo platform for evaluation of proton Pencil Beam Scanning (PBS) treatment plans. L. Grevillot 1,2, D. Bertrand 2, F. Dessy 2, N. Freud 1 and D. Sarrut 1 [email protected] 1 Université de Lyon, CREATIS; CNRS UMR5220; Inserm U1044; INSA-Lyon; Université Lyon 1; Centre Léon Bérard, Lyon, France. 2 IBA, B-1348, Louvain-la-Neuve, Belgium. Abstract. Active scanning delivery systems take full advantage of ion beams to best conform to the tumor and to spare surrounding healthy tissues, however it is also a challenging technique for quality assurance. In this perspective, we upgraded the GATE/GEANT4 Monte Carlo platform in order to recalculate the Treatment Planning System (TPS) dose distributions for active scanning systems. A method that allows evaluating the TPS dose distributions with the GATE Monte Carlo platform has been developed and applied to the XiO TPS (Elekta), for the IBA proton Pencil Beam Scanning (PBS) system. Firstly, we evaluated the specificities of each dose engine. A dose conversion scheme which allows to convert dose to medium into dose to water was implemented within GATE. Specific test cases in homogeneous and heterogeneous configurations allowed for the estimation of the differences between the beam models implemented in XiO and GATE. Finally, dose distributions of a prostate treatment plan were compared. In homogeneous media, a satisfactory agreement was generally obtained between XiO and GATE. The maximum stopping power difference of 3% occured in a human tissue of 0.9 g cm 3 density and led to a significant range shift. Comparisons in heterogeneous configurations pointed out the limits of the TPS dose calculation accuracy and the superiority of Monte Carlo simulations. The necessity of computing dose to water in our Monte Carlo code for comparisons with TPSs is also presented. Finally, the new capabilities of the platform are applied to a prostate treatment plan and dose differences between both dose engines are analyzed in detail. This work presents a generic method to compare TPS dose distributions with the GATE Monte Carlo platform. It is noteworthy that GATE is also a convenient tool for imaging applications, therefore opening new research possibilities for the PBS modality. 76
87 TPS evaluation using GATE 2 1. Introduction A medical physicist s main task is to deliver the right dose to the right location. Therefore, quality assurance is of primary importance, especially in regards to the delivery system and the TPS. In this report, we address the later of these issues by comparing the TPS Pencil Beam Scanning (PBS) dose distributions with Monte Carlo simulations. Patient-specific quality assurance is routinely performed by comparing patient treatment plans delivered in water with measurements [1]. The overall TPS validation procedure is however more complex [2]. Validating a treatment plan in water does not fully guarantee the dose distribution accuracy within the patient. Today, the Monte Carlo method is the only possibility to recompute TPS treatment plans based on patient CT images, with the advantage of providing a very detailed beam interaction simulation in the patient. Over the past decade, treatments have been mostly delivered using passive scattering delivery techniques and many studies using the Monte Carlo method have been performed with GEANT4 [3, 4]. This work is focused on active scanning, which is the most advanced delivery technique and allows higher dose conformity to the tumor while delivering a lower dose to surrounding healthy tissues [5]. The GATE Monte Carlo simulations are not limited to dosimetric aspects and allow for instance β + or prompt-γ imaging investigations. Faster Monte Carlo codes for proton therapy applications exist [6]. The main interest of a slower and detailed Monte Carlo simulation such as GATE/GEANT4 is its versatility: it can be used as a reference Monte Carlo code for validation purposes, it allows combined imaging and dose simulations, micro-dosimetric applications, radiotherapy simulations using other particles such as carbon ions, etc. Details about the GATE capabilities are presented elsewhere [7, 8]. The active scanning technique is expected to be used more widely in the coming years due to technological improvements as well as the development of new proton and carbon therapy facilities worldwide [9]. The combination of thousands of individual pencil beams allows for very complex dose distributions, especially when using Intensity Modulated Proton Therapy (IMPT) [1]. Therefore, the use of a Monte Carlo code as quality assurance tool to benchmark TPSs for active scanning delivery becomes even more attractive. Since the GATE V6.0 release, the platform has allowed for radiation therapy and dosimetric applications [8, 10]. The selection of the appropriate physics models and parameters leading to a reference physics-list together with optimized parameters-list has been detailed in [11]. A proton PBS model has been developed and validated for an IBA system [12]. In this work, we used the following releases: GATE V6.1 and GEANT4.9.4p01 [13, 14]. As TPSs calculate the so-called dose to water and Monte Carlo codes the dose to medium [15], a method for converting dose to medium into dose to water is described in Section 2.1. We investigate in Section 2.2 the specificities of both XiO and GATE dose engines. Stopping power differences between GATE and XiO are presented in Section 3.1. In Section 3.2, the dose distributions of pristine Bragg peaks with different energies calculated using XiO and GATE in various homogeneous configurations are compared. A complex treatment 77
88 TPS evaluation using GATE 3 plan in a homogeneous medium is used to validate both dose engines with appropriate measurements in Section 3.3. In Section 3.4, dose distributions in heterogeneous phantoms are analyzed and the limits of the TPS dose calculation algorithms on dose accuracy are investigated. Finally, a prostate treatment plan is presented and dose differences between XiO and GATE are analyzed in detail in Section 3.5. This paper intends to present a generic method for PBS treatment plan evaluation with GATE. It points out various sources of differences between MC and TPS dose calculations, from simple cases in homogeneous media to complex cases in heterogeneous configurations. The prostate treatment plan studied illustrates the possibilities of the GATE platform for clinical applications. The evaluation of various and more complex treatment plans will be the subject of further studies. This work is directed towards the IBA PBS system together with the XiO TPS, however the overall method is expected to be useable with other TPS and irradiation systems [12]. 2. Materials and Methods Different definitions of range can be found in literature, depending on physical or clinical constraints. In this paper, the physical and clinical ranges correspond to the 80% and 90% distal dose levels in the Bragg peak, respectively. Unless otherwise specified, beam ranges given in unit of g/cm 2 correspond to ranges in water. The expression spot size will always refer to the Gaussian standard deviation of the size of the beam spot. Dose distributions calculated with GATE were converted into the DICOM format using a home made toolkit, which is based on the ITK library, in order to ensure compatibility with commercial dose analyzing tools. Simulations were performed either locally on a 4-CPU computer or on the EGEE grid, which provides about 40,000 CPUs through 250 resource centers worldwide [16] Dose to water versus dose to medium Monte Carlo tools compute the so-called dose to medium. Historically, treatment planning systems have computed dose to water (or water-equivalent dose), by rescaling depth-dose distributions measured in water using a water-equivalent path length approximation. Differences between dose to medium and dose to water calculated with the Monte Carlo method and the TPS, respectively, were first investigated for photons [17] and later for protons [15]. Unlike photons, protons undergo non-elastic nuclear interactions. The impact of such interactions on the dose conversion scheme was investigated in [18]. In soft tissues, the water to medium dose ratio (D w /D m ) is close to unity. For photons as well as for protons, the largest difference in human tissues occurs in high density bony structures, with differences between D w and D m of up to about 10% [17, 15]. The true dose delivered to each voxel in the patient is the dose to medium calculated by the Monte Carlo method. However, to evaluate the 78
89 TPS evaluation using GATE 4 accuracy of TPS dose calculation algorithms, it becomes necessary to degrade the dose to medium into dose to water. The question of whether reporting dose to medium or dose to water should be preferred was discussed some years ago [19]. In this work, we implemented a dose conversion scheme similar to D B w from [15], which accounts onthe-fly for the energy and particle dependent relative mass stopping powers, as defined in Equation (1). When all nuclear fragments are not explicitly tracked, an additional term accounting for relative non-elastic nuclear cross sections can be added [18, 15]. As in GATE every particle is tracked, this additional correction can be omitted. D w = [D m S w,m (E)] proton +[D m S w,m (E)] electron +[D m S w,m (E)] others (1) where E is the kinetic energy of the particle, others refer to other secondary charged particles produced in the simulation and S w,m is the inverse of the relative mass stopping power (S m,w ), as defined in Equation (2). The indices m and w refer to medium and water, respectively. 1 1 S m,w (E) = S w,m (E) = ρ m ( de dx ) m 1 ρ w ( de dx ) w where de is the stopping power and ρ is the mass density. The stopping power values of dx the different particles in the different media were calculated at each step using the G4EmCalculator class from GEANT4. For some particles, these values are not accessible. In these cases, the mass stopping power ratio used for others was set to be equal to that of a 100 MeV proton. It is noteworthy that the simplest conversion scheme is applied retroactively at the end of the calculation [15], therefore neglecting the stopping power energy and particle dependencies. The proposed dose conversion tool presented will be publicly available in the next GATE release GATE and XiO dose engine specificities Dealing with Hounsfield Units (HUs) For patient dose calculations, HUs are converted into tissue compositions and mass densities for Monte Carlo codes and into relative stopping powers for TPSs. A reference method has shown how to interpolate tissue composition and density for every HU number and for a given scanner [20]. In a second step, authors considered HU uncertainties and divided the HU scale [- 1000, +1600] into 24 different material compositions, assuming that each voxel can be associated with a mass density. In GATE/GEANT4, all materials must be defined prior to the simulation. Therefore, a density tolerance parameter expressed in g cm 3 was introduced into GATE, in order to specify the piecewise correspondence between the HUs and the densities [8]. We set a density tolerance parameter of g cm 3, which led to the definition of 2847 materials. In XiO, the HU to material relative stopping power conversion is based on a HU to density calibration curve established by the user. The HU to density calibration curve has a resolution of 0.01 g cm 3. An equation allows for converting mass density into relative mass stopping power [6], as described later in section The XiO calibration curve has been defined with 25 points, using the (2) 79
90 TPS evaluation using GATE 5 same HU to density correspondence as in GATE: 4 points in the HU interval [-1000; -100], 12 points in HU [-100; 100], 6 points in HU [100; 1500] and 3 points in HU [1500; 3000] (Figure 1). As the HU to stopping power conversion methods used in GATE Relative mass density HU Figure 1. HU to relative mass density calibration curve used in XiO. and XiO are different, the stopping powers associated to a given HU in both codes are different. The indirect HU to stopping power conversion method used in XiO does not allow defining the same stopping powers as in GATE TPS specificities The pencil beam dose calculation algorithm implemented in XiO for PBS treatments is detailed in [21, 6], but a short summary is proposed in this subsection. A fit based on the ICRU 46, ICRU 49 and the computer tool PSTAR material data allows to determine energy-dependent relative mass stopping powers as a function of material density [6]. Relative mass stopping powers allow scaling measured depth-dose profiles according to the radiological depth, as defined in [21]. Scaling methods used in TPSs provide water equivalent doses, as discussed in Section 2.1. The multiple Coulomb scattering algorithm is based on the Rossi formula and allows computing the mean characteristic scattering angle (Gaussian standard deviation) [21]. In addition to the initial primary pencil beam, the dose contribution from nuclear products is accounted for by means of a secondary nuclear pencil beam [21]. Its contribution is described by a specific variance, which depends on the energy, spot size and radiological depth. It was modeled based on GEANT4 simulations. Spots are initially described via their energy, position, size, divergence and direction. They are considered to be elliptical Gaussians, with different parameters along the two lateral axes [21]. The number of sub-spots (N) used in the implemented pencil beam algorithm is defined by the precision parameter (n), which varies between 0-5. The precisions n=0, n=3 and n=5 correspond to numbers of sub-spots N=1, N=49 and N=121, respectively. It is necessary to distinguish the expression pencil beam used to describe a dose calculation algorithm, from the expression pencil beam scanning (PBS) used to describe a beam delivery technique. 80
91 TPS evaluation using GATE 6 The larger the number of sub-spots, the better heterogeneities can be accounted for [21]. For homogeneous phantoms or heterogeneous sandwich configurations with slabs set perpendicularly to the beam axis, the precision parameter has no effect. On the contrary, the precision parameter plays a major role when heterogeneities are adjacent to the beam axis. Unless otherwise specified, a precision n=0, which corresponds to a pencil beam algorithm with a single ray tracing on the central axis was used by default. For heterogeneous geometries, different n values were tested. In addition to the CT matrix, a calculation grid with a user-defined resolution is created by re-sampling the CT matrix. The dose contribution from every pencil beam reaching a voxel is integrated over the entire voxel Monte Carlo code specificities The GEANT4-based GATE Monte Carlo code allows for detailed simulations of particle interactions in matter [22]. Details about the GEANT4 physics implementation are provided in [23]. The physics models and parameters selected for our application have been presented in [11] and the beam model of the IBA system has been presented in [12]. The overall description is briefly summarized in this sub-section. The energy loss of protons and secondary ions is based on the Bethe-Bloch equation, except below 2 MeV, where parameterized data are used [23]. Secondary particles like electrons, positrons and photons are produced only if their range is larger than 1 mm and then tracked until they do not have any kinetic energy left [11]. The multiple Coulomb scattering algorithm implemented is based on the Lewis theory [23]. It is a class II condensed algorithm, in which the global effect (lateral displacement, energy loss and secondary particle production) is computed at the end of a track segment. Non-elastic and elastic nuclear interactions are simulated in detail. The non-elastic nuclear model used is based on a compound nucleus theory with a pre-equilibrium stage. Pre-equilibrium and further equilibrium stages allow for producing and tracking charged and neutral secondaries. The beam model accounts for beam size, divergence and emittance parameters, with different values in each lateral direction, as described in [12]. The CT matrix is used as it is for particle interaction simulation and the corresponding dose depositions are scored within a scoring grid with a resolution defined by the user. Dose contributions from each particle reaching a voxel are integrated over the entire voxel Detailed comparison method of Gate and Xio dose calculations Stopping powers Relative mass stopping powers calculated with XiO and GATE were compared at 100 MeV, using a set of materials within the density interval [0.0012, 1.96] (HU [-1000, +1600]). GATE stopping powers were calculated using the newly released EmCalculatorActor tool from GATE V6.1, which is based on the G4EmCalculator class from GEANT4 and allows extracting specific properties of all For photons, the concept of range does not exist. absorption cross section is used in GEANT4. Instead, an absorption length related to an 81
92 TPS evaluation using GATE 7 materials involved in a simulation Pristine Bragg peaks in homogeneous media First, we compared pristine Bragg peaks obtained with GATE and XiO in water for three clinical ranges: 28.0, 18.0 and 7.7 g/cm 2. Second, we compared pristine Bragg peaks obtained with GATE and XiO in five different media with mass densities of 0.9, 1.0, 1.2, 1.5 and 1.8 g cm 3, using a fixed beam energy corresponding to a range of 25.0 g/cm 2 in water. Note that when defining a treatment plan, each beam is referred to by its range in water (in g/cm 2 ). Water was defined in XiO by forcing the density of the phantom to unity. The water phantom surface was positioned at the isocenter. The resolution of the calculation grid was set to 2 mm in XiO and reproduced as such in GATE. Integral depth-dose and transverse profiles at three depths were extracted from the 3D dose maps. We evaluated the physical and clinical ranges, as well as the mean point-to-point dose differences between GATE and XiO. Depth-dose and transverse profiles were normalized relative to the integral dose. Transverse profiles were fitted with Gaussian functions in order to extract the standard deviations. Maximum spot sizes were evaluated at a depth corresponding to 98% of the proton physical range. The method used for such comparisons was presented in [12, 11] Beam models validation in homogeneous media The beam model implemented in GATE has already been partially validated in a previous study [12]. Similar tests have been also performed at IBA to validate the beam model implemented in XiO. In this section, additional comparisons including measurements as well as XiO and GATE calculations in a homogeneous phantom are proposed. A test treatment plan was generated with XiO in a water-equivalent phantom of cm 3. The treatment plan was made of a single field composed of 7 iso-energy layers modulated between 27 and 32 cm, with 1924 spots and a spot iso-spacing of 5 mm. The isocenter was set at 30 cm depth. The modulated region had a triangular shape with a homogeneous dose distribution as shown in Figure 2. The phantom was made of water equivalent RW3 slabs of cm thickness, with a density of g cm 3 (Solid Phantom SP34 R, IBA-Dosimetry). The CT images of the phantom were acquired and used for the dose calculation. The I mrt MatriXX R tool (IBA-Dosimetry) was used for the measurements. This tool consists of a 2D matrix of 1020 ionization chambers with an active volume of 0.08 cm 3 for each chamber and a resolution of 7.62 mm between two measuring points. Measurements were carried out at 5.0, 14.0, 20.0, 27.2, 28.7 and 30.2 cm depths, by placing the MatriXX tool below the appropriate quantity of SP34 and by virtually reproducing the original set-up. A 3D dose distribution was computed with the TPS using a 4 mm calculation grid resolution. 2D maps corresponding to the measurement depths were obtained using interpolation with a 1 mm resolution. The treatment plan and CT images exported from XiO were used for Monte Carlo simulation, using the same scoring grid resolution. Details about CT images and PBS treatment plan integration in GATE can be found elsewhere [8, 12]. Additional 2D 82
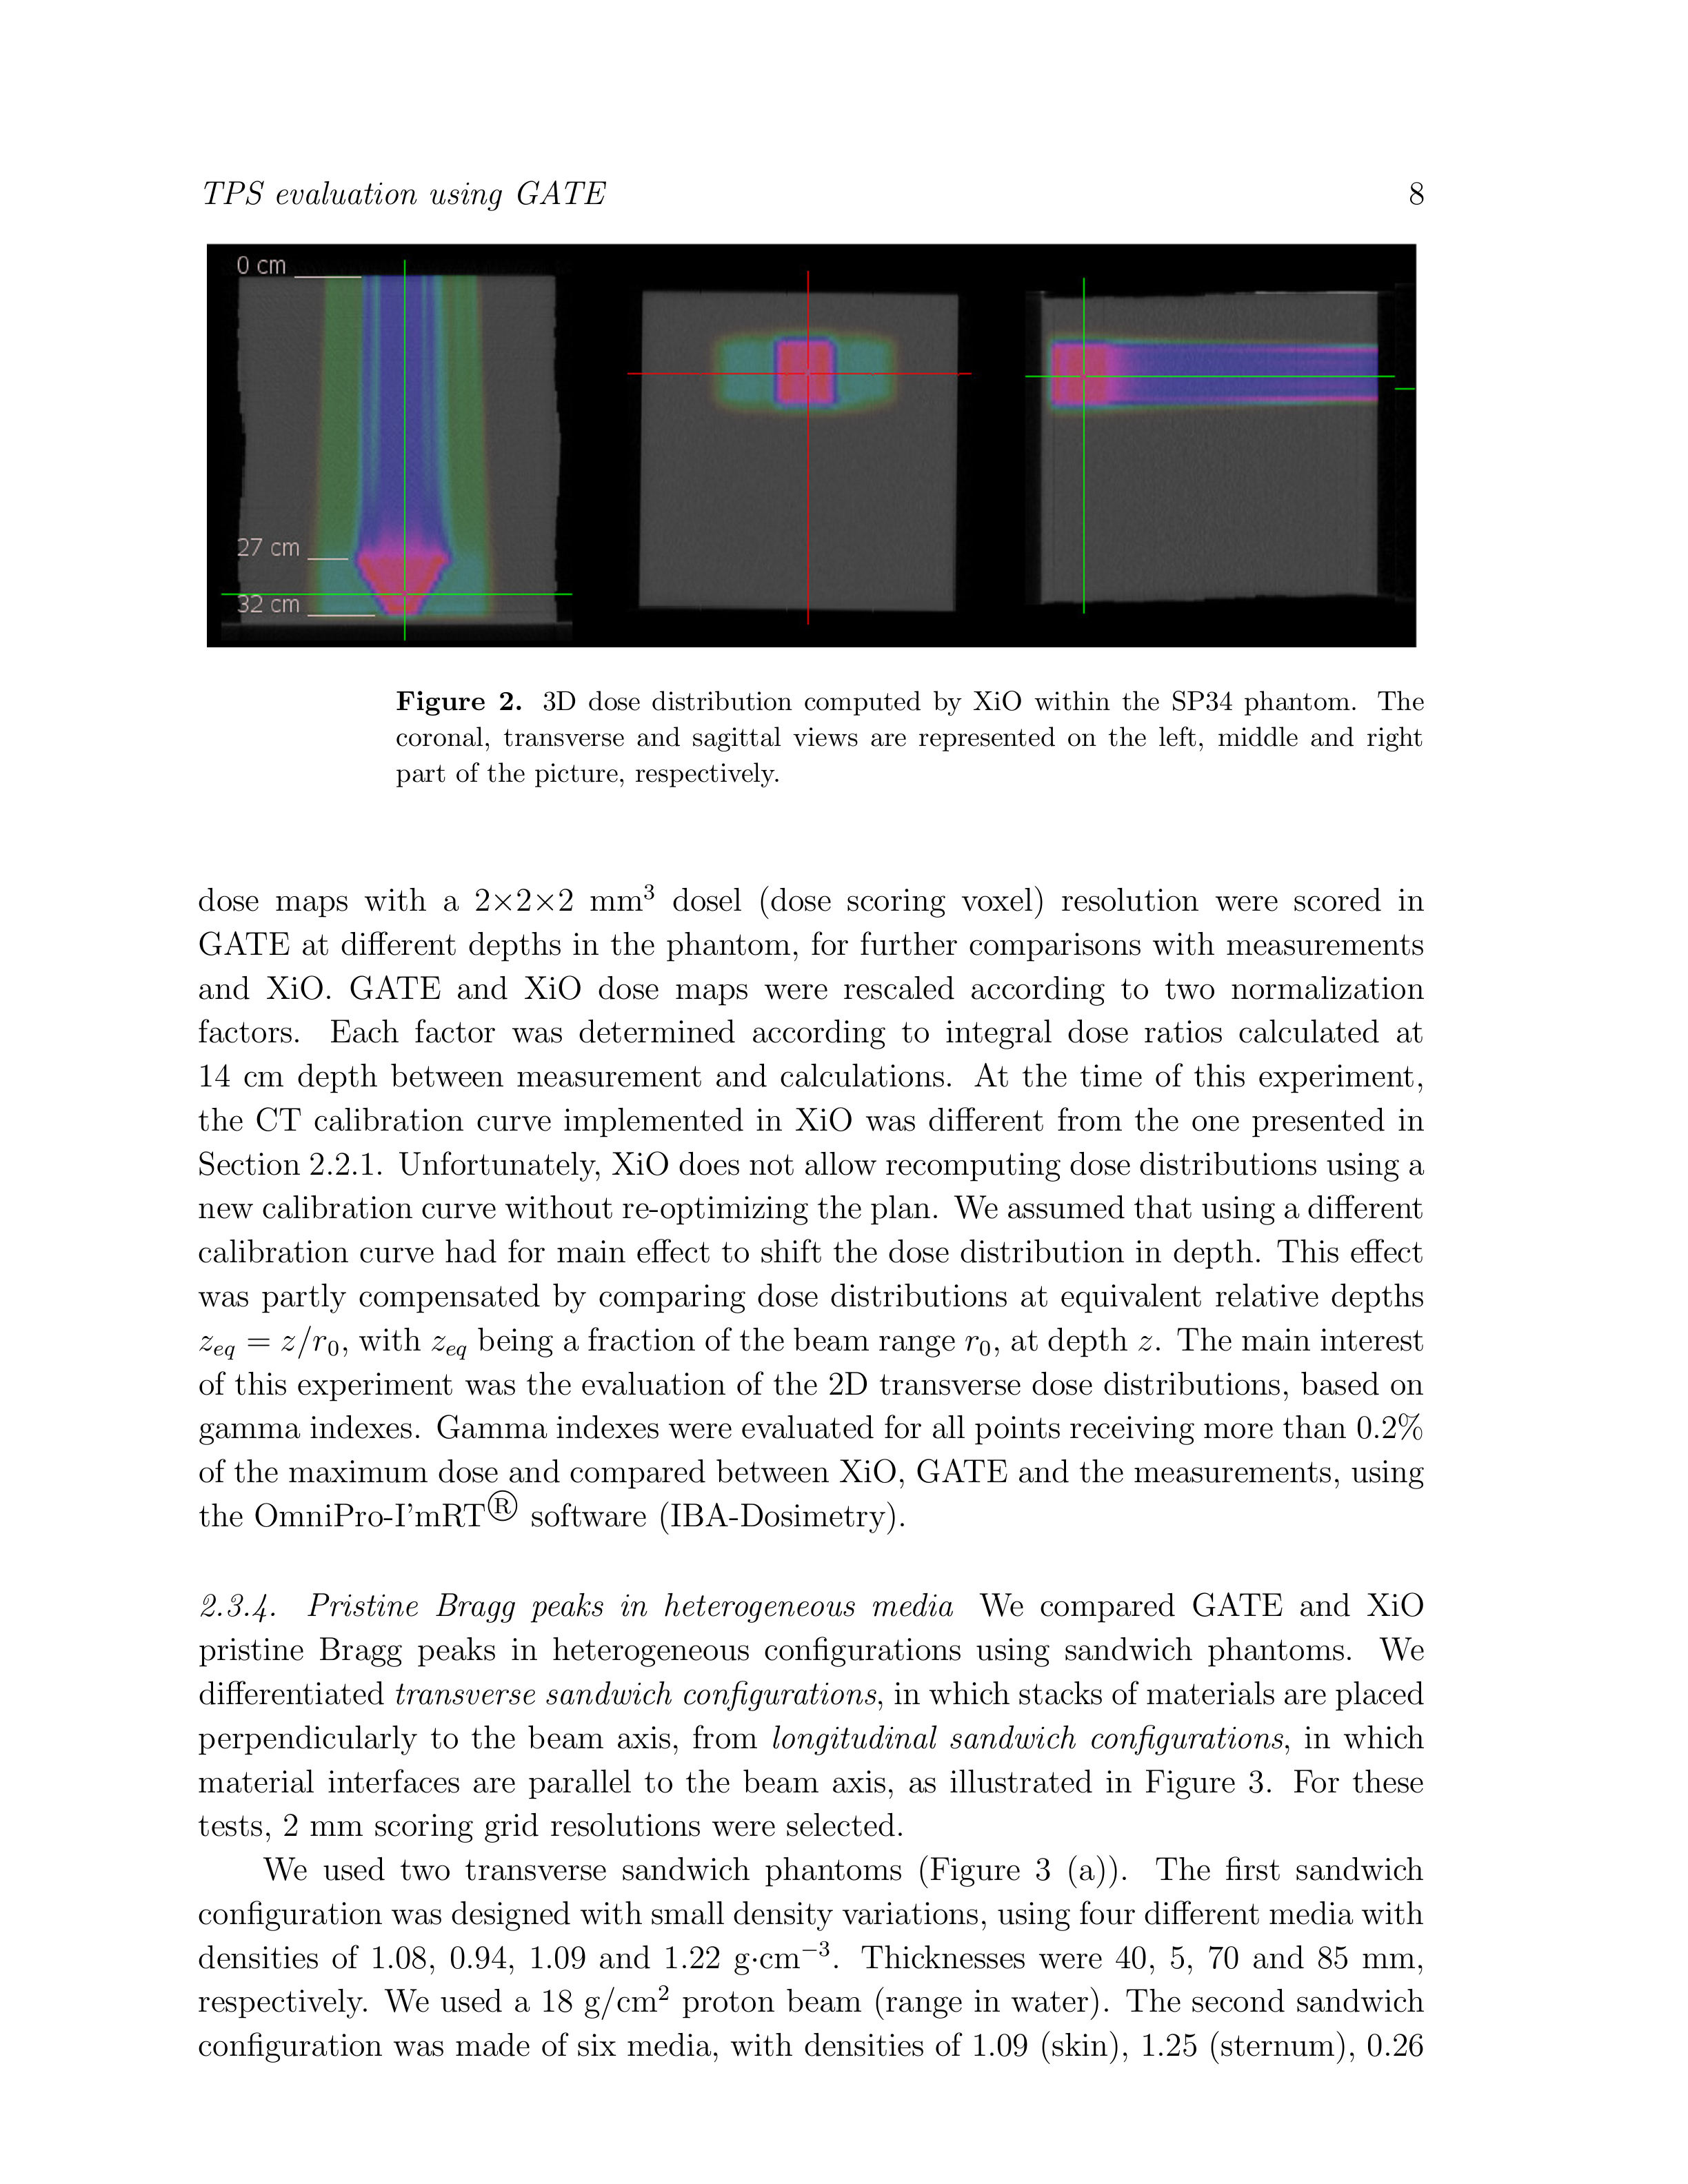
93 83
, 1.00 (soft tissue), 1.90 (cortical bone) and 1.00 (soft tissue). Thicknesses were 10, 20, 50, 35, 10 and 20 mm, respectively.")
94 TPS evaluation using GATE 9 transverse sandwich longitudinal sandwich Figure 3. Schematic representation of the two types of sandwich configurations used. The different materials are represented by different shade of grey and water is in blue. (lung), 1.00 (soft tissue), 1.90 (cortical bone) and 1.00 (soft tissue). Thicknesses were 10, 20, 50, 35, 10 and 20 mm, respectively. This second test case was designed to evaluate maximum D w /D m variations for the different human tissues. We used a 10 g/cm 2 proton beam. One longitudinal sandwich phantom was designed using a set-up inspired from [21]. The phantom consisted of a 2 cm interface of adjacent bone (d=1.9) and lung (d=0.26), parallel to the beam axis (Figure 3 (b)). A 25 g/cm 2 pencil beam was used. In this test case, the precision parameter from XiO played an important role, as it determined the accuracy of the calculation algorithm in order to account for heterogeneities set parallel to the beam axis. Therefore, three levels of precision were tested: n=0 (simple ray tracing), n=3 (49 sub-spots) and n=5 (121 sub-spots). In addition to the precision parameter, the sensitivity of the dose calculation to the scoring grid position was tested by shifting the calculation matrix perpendicularly to the beam axis Application to a prostate cancer treatment plan We completed this study by evaluating dose distributions for a prostate treatment plan. CT images and structures were provided by Elekta. The Gross Tumor Volume (GTV) corresponded to the prostate and the Planned Target Volume (PTV) was defined as the volume enclosing the prostate and the seminal vesicle. A dose of 80 Gy was planned in the PTV using two laterally opposed fields. Maximum dose and dose-volume constraints were defined prior to the optimization for the following organs at risk (OARs): femurs (left and right), rectum and bladder. Each field was optimized separately, in order to deliver a homogeneous dose to the tumor (Figure 4), using the so-called single field uniform dose (SFUD) optimization technique [24]. A dose scoring grid resolution of 2 mm was used in XiO and reproduced in the GATE simulation. The simulation was run on the EGEE grid [16] and very small statistical fluctuations were achieved: below 0.5% (standard deviation) in high dose 84
![TPS evaluation using GATE 10 Transverse plan Coronal plan Sagittal plan Figure 4. 3D dose distribution in the patient calculated with GATE and displayed with the visualization tool vv [25]. regions.](/docs-images/27/9620868/images/95-0.png "Comparisons were carried out using relative dose rather than absolute dose, because the TPS was not calibrated for absolute dosimetry.")

95 TPS evaluation using GATE 10 Transverse plan Coronal plan Sagittal plan Figure 4. 3D dose distribution in the patient calculated with GATE and displayed with the visualization tool vv [25]. regions. Comparisons were carried out using relative dose rather than absolute dose, because the TPS was not calibrated for absolute dosimetry. Simulated dose distributions were normalized relative to the XiO integral dose. We evaluated the influence of the XiO precision parameter using three different values: n=0, n=3 and n=5. The influence of the dose to medium and dose to water computations with GATE were also investigated. The ARTIVIEW software (AQUILAB) was used to compare the different dose matrices and to extract various clinical data: dose-volume histograms (DVHs) iso-dose volume index (for instance, the iso-dose volume index V 20 corresponds to the fraction of the organ volume receiving at least 20% of the prescribed dose) near maximum dose (D nmax ): maximum dose received by 2% of an organ average dose (D av ) near minimum dose (D nmin ): minimum dose received by 98% of an organ. Comparisons were performed for each lateral field separately and for the complete treatment plan. 3. Results 3.1. Stopping power differences between GATE and XiO Relative mass stopping powers calculated with XiO are lower than with GATE (Table 1), except for mass densities within the interval [0.5, 0.9], for which larger discrepancies are observed. This is explained by the fact that very few human tissues, except lungs, have a density below 0.9 g cm 3. If we neglect the interval [0.5, 0.9], relative mass stopping powers calculated with XiO are systematically lower than with GATE, which could be partly explained by a lower water stopping power in GATE than in XiO. In ICRU 49 [26], stopping powers are stated to be accurate to within 1-2% for elements and 1-4% for compounds, therefore the differences observed between XiO and GATE are acceptable. For a mass density of 1.00 g cm 3, the relative stopping power calculated in XiO is 1.00, because the corresponding material is water. In GATE, a human tissue 85
96 TPS evaluation using GATE 11 Mass density S mgat E ( ) S m S m S Sw GAT E Sw XiO 1- m Sw GAT E Sw S m XiO (g.cm 3 ) (MeV.cm 2.g 1 ) (%) Table 1. This table summarizes the GATE mass stopping powers (column 2), GATE and XiO relative mass stopping powers (column 3 and 4) and differences between GATE and XiO relative mass stopping powers (column 5), as a function of material mass density (column 1). Stopping power ratios are rounded to 1% and calculated for 100 MeV protons. composition different from water is defined (section 2.2.1), for which the relative stopping power is not 1.00, but Evaluation of pristine peaks in homogeneous media Pristine Bragg peaks in water GATE ranges are systematically larger than XiO ranges by about % (Table 2), confirming the previous hypothesis of lower water stopping power in GATE than in XiO (Section 3.1). Mean point-to-point dose differences are less than 2%. Transverse profiles computed at the isocenter were compared to the beam data library measurements of the system. Spot sizes (standard deviation) at isocenter calculated with Gate and XiO agreed with measurements within 0.1 mm in the x- and y-directions for the three energies tested. Transverse dose profile standard 86
97 TPS evaluation using GATE 12 r 80 r 90 dose differences r 90 differences (mm) (mm) (%) (%) / (mm) 28.0 g/cm 2 GATE XiO / g/cm 2 GATE XiO / g/cm 2 GATE XiO / 0.5 Table 2. This table summarizes the integral depth-dose profile differences between GATE and XiO. r 80 and r 90 stand for physical and clinical ranges, respectively. deviations computed with GATE and XiO at 40%, 90% and 98% of the Bragg peak physical range were in agreement with less than 0.2 mm difference. Depth-dose and transverse profiles computed for the 28 g/cm 2 beam are illustrated in Figure 5. Differences on the Bragg peak shapes (Figure 5 (a)) can be due to different initial energy spread and to the energy straggling model in GEANT4. de/dx (A.U.) (a) Gate XiO Depth in water (mm) Dose (A.U.) 0,14 0,12 0,1 0,08 0,06 0,04 0,02 0 (b) GATE XiO 27.6 cm 25 cm 10 cm 20,00 0,00 20,00 Lateral position (mm) Figure 5. Comparison of GATE and XiO dose profiles in water for a 28.0 g/cm 2 proton beam. (a) depth-dose profiles, (b) transverse dose profiles at 10.0, 25.0 and 27.6 cm depth. Lines are displayed to guide the eyes only Pristine Bragg peaks in five different media Range differences are presented in Table 3. They are consistent with relative stopping power differences (Table 1), when taking into account the difference in water stopping power between XiO and GATE of 0.5% (Table 2). However, at this energy this led to range differences of 3.7 mm (1.5%) and 9.6 mm (3.5%) for human tissues having mass densities of 1.00 and 0.90 g cm 3, 87
98 TPS evaluation using GATE 13 density (g cm 3 ) Ranges XiO (mm) GATE (mm) Difference (mm) Difference (%) Maximum spot sizes XiO (mm) GATE (mm) Table 3. Comparison of depth-dose and transverse profiles for a 25.0 g/cm 2 proton beam in various human media using GATE and XiO. respectively. Obviously, the differences shown are the largest possible for a single tissue. Such range differences are very unlikely to happen in a human body, which is made of numerous tissues. At the phantom entrance, the spot sizes are in reasonable agreement, with less than 0.2 mm variations. Maximum spot size discrepancies in the Bragg peak can be attributed to range differences, the use of different multiple Coulomb scattering algorithms and the differences in the beam models Validation of the GATE and XiO beam models against measurements Gamma index comparisons with measurements using GATE and XiO are satisfactory, with more than 96% of the points passing the test with a 3%/3mm criterion (Table 4), therefore validating both calculation tools. More than 95% of the points passed the gamma comparison between GATE and XiO using a 2%/2mm criterion. XiO seems to agree slightly better than GATE with measurements, except for the 2D dose map at 30.2 cm depth. However, due to statistical fluctuations of about 1% and the fact that comparisons were performed at relative depths, the differences observed can be disregarded. A sample of transverse dose profiles is presented in Figure 6. Depth of measurement (mm) %/3mm gamma GATE vs meas. (%) XiO vs meas. (%) %/2mm gamma XiO vs GATE (%) Table 4. Gamma index comparisons between measurements, XiO and GATE, for 2D dose maps calculated at different depths. 88
99 TPS evaluation using GATE 14 Dose (A.U.) Dose (A.U.) Dose (A.U.) x-direction Meas Gate XiO 14 cm depth Lateral position (cm) Meas Gate XiO 20 cm depth Lateral position (cm) Meas Gate XiO 28.7 cm depth Lateral position (cm) Dose (A.U.) Dose (A.U.) Dose (A.U.) y-direction Meas Gate XiO Lateral position (cm) Meas Gate XiO Lateral position (cm) Meas Gate XiO Lateral position (cm) Figure 6. Transverse profile comparisons between measurements, GATE and XiO calculations in x- and y-directions for three depths Evaluation of pristine peaks in heterogeneous media Pristine Bragg peaks in transverse sandwich configurations In the first sandwich (Figure 7 (a)), the range computed by XiO was 2 mm (1.1%) larger than with GATE. In the media with densities of 0.94 and 1.22 g cm 3, dose differences of - 3% and + 2%, respectively, are seen between the dose to water and the dose to medium calculated by GATE. These differences can be explained using water to medium mass stopping power ratios, corresponding to the inverse of column 3 from Table 1. In the second sandwich (Figure 7 (b)), no significant range differences were noted. The largest difference arises in the high-density bony structure, with a D w /D m value of approximately On the contrary, in the low-density lung structure D w /D m =
100 TPS evaluation using GATE 15 Relative dose (A.U.) (a) - first sandwich Gate Gate_Water XiO Dw/Dm 4 1,04 3 1, ,98 0, Depth in phantom (mm) Dw/Dm Relative dose (A.U.) (b) - second sandwich Gate Gate_Water XiO Dw/Dm 4 1,15 3 1,1 2 1, , Depth in phantom (mm) Dw/Dm Figure 7. Depth-dose profiles computed in two sandwich configurations. The 2 mm scoring grid resolution is too large to allow a precise description of the Bragg peak, as illustrated by the additional green circles displayed in (b) in the Bragg peak and corresponding to the XiO calculated points. The D w /D m dose ratio computed with GATE is also displayed and corresponds to the right axis. Water to medium dose differences are well marked in the second and fourth media of the first sandwich and in the second and fifth media of the second sandwich. The voxel resolution of 2 mm does not allow to accurately calculate the dose deposition in the Bragg peak. This is more pronounced in the second phantom, where the Bragg peak stops at the distal bone/water interface, which makes the dose calculation uncertain. Mean point-to-point dose differences were lower than 2% for both sandwich configurations, when comparing GATE dose to water and XiO. Therefore, the differences between the two dose engines are clinically acceptable. Differences obtained between dose to water and dose to medium demonstrate the necessity of the conversion to evaluate TPS dose calculation algorithms with Monte Carlo codes Pristine Bragg peaks in longitudinal sandwich configurations For this test case, two peaks are expected, corresponding to the fractions of beam crossing mainly bone or lung tissues (Figure 8). With the precision n=0, only one peak is produced, because the radiological depth is calculated through the lung tissue and the bony structure is completely neglected. Increasing the precision to n=3 and n=5 makes it possible to better account for the bone/lung interface and two peaks are calculated. No significant difference was shown between n=3 and n=5, suggesting no important improvement in the dose calculation. In such a case, Monte Carlo simulation is considered as the reference [21] and points out the limits of the pencil beam algorithm. This corroborates similar studies presented in [21, 27]. However, the differences shown are not only due to the pencil beam algorithm. Indeed, the CT re-sampling performed by the TPS to generate the calculation grid is also responsible for part of the difference. This is illustrated in Figure 8, where the scoring grid has been shifted laterally by 1 mm (half the scoring grid resolution). With this shift, a third peak appears in between the lung 90
101 TPS evaluation using GATE 16 Relative dose (A.U.) XiO n0 XiO n3 XiO n5 XiO n3 shifted (1 mm) GATE_WATER Depth in phantom (mm) Figure 8. Depth dose profiles obtained in the longitudinal sandwich configuration, using GATE and XiO with different levels of precision. and the bone peaks. It corresponds to a sampling artifact, which produced voxels of intermediate densities in between bone and lung densities. Such artifacts do not occur in our Monte Carlo implementation, because the CT image is not resampled. Differences between GATE dose to water and XiO in the bone peak at 235 mm depth, in the lung peak at 260 mm depth and in the trough at 245 mm depth, are summarized in Table 5. The tests performed in the longitudinal sandwich configuration clearly demonstrate the limits of the XiO analytical algorithms. bone peak trough lung peak (%) (%) (%) XiO (n=3) vs. GATE XiO-shifted vs. GATE Table 5. Differences between XiO and GATE dose to water in the longitudinal phantom configuration Evaluation of a prostate treatment plan A detailed analysis is proposed for the right lateral field and only complementary information for the left field and for the complete treatment is presented Right lateral field As a first verification, we evaluated the integral doses delivered along the left/right (depth-dose), anterior/posterior and head/feet axes (Figure 9). These comparisons show a good overall agreement for the three axes, with a range shift of about 2 mm (along the left/right axis), that will be analyzed later in this section. In a second step, we compared 2D dose distributions slice by slice. A satisfactory 91
102 TPS evaluation using GATE 17 Integrated dose (A.U.) Integrated dose (A.U.) left/right axis Gate Gate_water XiO 1 0,8 0,6 0,4 0, Depth in patient (mm) anterior/posterior axis Gate Gate_water XiO 1 0,8 0,6 0,4 0, Depth in patient (mm) Integrated dose (A.U.) 1 0,8 0,6 0,4 0,2 0 head/feet axis Gate Gate_water XiO Depth in patient (mm) Figure 9. Integral dose profiles computed along the three axes using XiO (with n=0) and GATE, for the right lateral field. In (a), dose differences within the first 20 mm are due to dose scoring artifacts in air: dose is set to 0 in XiO, but not in GATE. agreement was obtained for almost all CT slices, but some discrepancies were noticed, with maximum differences visible in the CT slice 70 (Figure 10). In this figure, the influence of the XiO precision parameter is evidenced: when n is increased from 0 to 5, a dose discrepancy (range shift) due to gas in the rectum becomes visible, but is less marked than with GATE. Using n=3 produces similar iso-doses as with n=5, suggesting no improvement on the dose calculation, as already noted in Section The dose difference between Xio (n=3) and GATE is presented in Figure 10 (d). It shows an over dosage of about +10 Gy at the distal edge of the field, because of the larger ranges computed in XiO than in GATE, except behind the rectum, where it shows an under dosage of about -10 Gy. The differences between GATE and XiO might also be due to the CT re-sampling necessary in XiO to create the calculation grid (Section 3.4.2). In a third step, we focused on 1D dose distributions parallel and perpendicular to the field axis. Range shifts of about 1% (2 mm) are observed, but they vary slightly with the tissues crossed (Figure 11 (a)). In regards to the transverse profiles, a satisfactory agreement is obtained in the central area of the tumor: the mean dose difference calculated between 47 mm and 147 mm for the upper curve presented in Figure 11 (b) is 1.9%, with a 92
103 TPS evaluation using GATE 18 (a) XiO n=0 (b) XiO n=5 (c) GATE water (d) Xio(n=3)-GATE water Figure 10. 2D dose distributions from GATE and XiO using n=0 and n=5. (d) presents a dose difference plot between XiO using n=3 and GATE water. The dose discrepancy area due to gas in the rectum is circled in red in the GATE calculation (c). The red dotted lines in (a) represent two axes used to compare 1D dose distributions between XiO and GATE in Figure 11. Gate XiO (a) Gate_water Gate XiO (b) Gate_water Dose (Gy) Depth in patient (mm) Dose (Gy) Depth in patient (mm) Figure 11. 1D dose distributions calculated with GATE and XiO (n=0) for the right lateral field. (a) two depth-dose profiles and (b) two transverse profiles. In figure (a) and (b) the lower curves were rescaled by a factor of 1/2 for visualization purpose. Dose distributions were extracted from different CT slices, however, the approximate positions of two axes used to compare depth-dose and transverse profiles are presented in Figure 10 (a). In (a), dose differences within the first 10 mm are due to dose scoring artifacts in air, as previously explained in Figure 9. 93
104 TPS evaluation using GATE 19 maximum dose difference of 5% at the central point. Larger differences occur at the edge of the tumor, due to a combined effect of dose gradient and range shift. Differences between GATE dose to medium and dose to water reached 4% for some of the voxels compared Left lateral field Similar conclusions were drawn for this field, using the same test procedure. As for the right lateral field, a dose discrepancy occurred in the rectum, with maximum differences visible in the CT slice 70 (Figure 12). A smaller range difference between GATE and XiO of about 1 mm (0.5%) was noticed, instead of 2 mm for the right lateral field. (a) XiO n=0 (b) XiO n=5 (c) GATE water (d) Xio(n=3)-GATE water Figure 12. 2D dose distributions from GATE and XiO using n=0 and n=5. (d) presents a dose difference plot between XiO using n=3 and GATE water. The dose discrepancy area due to gas in the rectum is circled in red in the GATE calculation (c) Complete treatment plan The shorter ranges predicted by GATE for the two lateral fields led to tumor dose coverage shorter by about 1-2 mm on each side of the tumor, as illustrated in Figure 13. The dose gradient between the tumor and the healthy tissues reaches the PTV border (pink contour, Figure 13) in the GATE calculation, but the GTV (blue contour, Figure 13) is still correctly covered. The dose discrepancies presented for both fields are less apparent when the two fields are combined, however, they are still clearly evidenced when computing the dose difference between XiO and 94
105 TPS evaluation using GATE 20 GATE (Figure 13 (c)). Similarly, a recent evaluation of small proton fields delivered with a passive scattering system indicated discrepancies for single fields, with hot and cold spots, but it noted that the physical limits of the pencil beam algorithm appeared to cancel out with multiple fields [4]. (a) GATE water (b) XiO n=0 (c) Xio(n=3)-GATE water Figure 13. Close-up of the dose distributions delivered in the target with XiO and GATE, including organ contours. (c) presents a dose difference plot between XiO using n=3 and GATE water. In GATE (a), the distance between the prostate PTV contour (pink solid line) and the dose distal fall-off along the beam directions is shorter than in XiO (b). 4. Discussion We compared XiO and GATE DVHs for all contoured organs from the prostate treatment plan (Figure 14(a)). The corresponding data presenting the main differences is summarized in Table Differences between dose to water and dose to medium The main differences between dose to medium and dose to water is illustrated by a shift of the DVHs (Figure 14 (b)) for the target volumes, while only small differences are visible for the OARs. Similar effects have been presented in [15]. For the organs presented, iso-dose volume indexes are always higher by a few percents using the GATE dose to medium instead of the GATE dose to water. The largest differences occur for V 100, with up to 24% difference in the seminal vesicle. The average, near minimum and near maximum doses are also higher by about 1-2% using the dose to medium, instead of the dose to water Differences between GATE dose to water and XiO There were only minor differences when using different precision values with XiO, suggesting that for this patient the precision parameter has almost no influence on the clinical validation of the treatment plan. From the different results obtained, we considered the precision parameter n=3 as a good compromise between calculation time 95
106 TPS evaluation using GATE 21 Volume (%) (a) GATE dose to water vs. XiO (n=3) PTV GTV Seminal Vesicle Bladder RT Femur LT Femur Rectum Rt pelvis Lt Pelvis PTV GTV Seminal Vesicle Bladder RT Femur LT Femur Rectum Rt pelvis Lt Pelvis Volume (%) Dose (%) (b) GATE dose to water vs. GATE dose to medium PTV GTV Seminal Vesicle Bladder RT Femur LT Femur Rectum Rt pelvis Lt Pelvis PTV GTV Seminal Vesicle Bladder RT Femur LT Femur Rectum Rt pelvis Lt Pelvis Dose (%) Figure 14. (a) DVHs computed with XiO using a precision n=3 (dotted lines) and GATE dose to water (solid line). (b) DVHs computed with GATE using dose to water (solid line) and dose to medium (dotted line). Doses and volumes are expressed relatively to the prescribed dose and to the organ volumes, respectively. 96
107 TPS evaluation using GATE 22 Organ GATE GATE water XiO n=0 XiO n=3 XiO n=5 PTV V 100 (%) PTV V 95 (%) PTV D nmax (Gy) PTV D av (Gy) PTV D nmin (Gy) GTV V 100 (%) GTV V 95 (%) GTV D nmax (Gy) GTV D av (Gy) GTV D nmin (Gy) S. Vesicle V 100 (%) S. Vesicle V 95 (%) S. Vesicle D nmax (Gy) S. Vesicle D av (Gy) S. Vesicle D nmin (Gy) Table 6. Near minimum, near maximum and average doses calculated with GATE and XiO in the PTV, GTV and seminal vesicle. The V 100 and V 95 iso-dose volume indexes are also presented. The results are calculated for the complete treatment plan (i.e. with both lateral fields). and accuracy. The main differences between XiO and GATE dose to water occur for the PTV, for which GATE predicts lower contributions of high doses (Figure 14 (a)). Large differences also occur for V 100 in the PTV, GTV and seminal vesicle. These differences can be partly explained by the shorter ranges predicted in GATE. As the PTV is the most external volume, discrepancies also occur for its V 95, which is about 3% lower in GATE than in XiO. It reached 94.9% in GATE and % in XiO, while a clinical treatment plan is generally validated for V 95 > 95%. Some slight differences can be noted in the organs at risk, as for instance in the bladder, for which GATE predicts lower doses Calculation time in XiO and GATE The TPS calculation time is strongly related to the calculation grid resolution and to the precision parameter, as summarized in Table 7 for the left field. It took 15 hours with GATE/GEANT4 to recalculate the complete treatment plan on a 3.0 GHz Intel Xeon CPU, using primary protons. The statistical uncertainty in voxels of mm 3 was of about 1.8% in the PTV. The calculation time could be significantly reduced by using clusters of computers: for instance, using a 30 CPU cluster could reduce the calculation of the prostate plan down to about 30 min. 97
108 TPS evaluation using GATE 23 Resolution n=0 n=3 n=5 4 mm 20 s 3 min 10 s 6 min 10 s 2 mm 2 min 50 s 14 min 30 s 25 min 30 s Table 7. XiO calculation times for the left lateral field. Calculations were run on a 3.6 GHz Intel Xeon bi-processor. 5. Conclusion Active scanning is the most advanced delivery technique for proton and carbon ion therapy, but also the most challenging technique for quality assurance. Monte Carlo simulation is currently the only possibility to review clinical treatment plans based on patient CT data, with an expected higher accuracy than TPSs. In this work, we have used the open-source GATE/GEANT4 Monte Carlo simulation platform to evaluate dose distributions computed with the XiO TPS for an IBA proton PBS system. In a first step, the beam models implemented in the two dose engines were compared and found to be in satisfactory agreement. However, relative stopping powers calculated with GATE were lower than with XiO by about 1-2%, except for low density media within the density interval [0.5, 0.9], for which XiO relative stopping powers were higher by up to 3.0%. A complex treatment plan based on the CT images of a homogeneous phantom was used to validate both dose engines: more than 96% of the points passed a 3%/3mm gamma evaluation, when comparing GATE and XiO results with measurements. More than 95% of the points passed a 2%/2mm gamma evaluation, when comparing GATE with XiO for the same treatment plan. In a second step, pristine Bragg peak dose distributions calculated in heterogeneous configurations were compared and showed the limits of the TPS dose calculation accuracy. Differences were attributed to the pencil beam algorithm and to the CT re-sampling artifacts. The necessity of calculating dose to water with Monte Carlo simulations for TPS evaluation has been also presented. A prostate cancer treatment plan was evaluated and dose differences between TPS and Monte Carlo calculations were analyzed in detail. Dose scoring discrepancies due to heterogeneities (gas in the rectum of the patient) were evidenced. Range differences were of about 0.5-1% (1-2 mm). DVHs were evaluated for the various organs and discrepancies were partly attributed to the stopping power differences. At this stage, a detailed validation phase of the platform is necessary. It should include simple and complex treatment plans, heterogeneous phantoms and absolute dosimetry. The present work is the first study demonstrating the capabilities of GATE to evaluate clinical treatment plans for proton active scanning delivery. The GATE platform can therefore contribute to the evaluation, benchmarking and improvement of TPS dose calculation algorithms in hadron therapy. It is also a convenient tool for imaging studies such as PET, or for the investigation of new imaging modalities such as the detection of prompt radiations (prompt gamma-rays or charged nuclear 98
109 TPS evaluation using GATE 24 fragments) towards online treatment monitoring. The GATE possibilities fortell exciting interdisciplinary research studies in the field of particle therapy. Acknowledgments The authors of this report would like to thank Dr. Martin Soukup and Dr. Gustav Meedt from the Elekta Company for the fruitful discussions and support with regards to the XiO TPS. This work was conducted via collaboration between the IBA Company and the Creatis laboratory. The research leading to these results has received funding from the European Community s Seventh Framework Program [FP7/ ] under the grant agreement n References [1] A. J. Lomax, T. Böhringer, A. Bolsi, D. Coray, F. Emert, G. Goitein, M. Jermann, S. Lin, E. Pedroni, H. Rutz, O. Stadelmann, B. Timmermann, J. Verwey, and D. C. Weber. Treatment planning and verification of proton therapy using spot scanning: initial experiences. Med Phys, 31(11): , Nov [2] O. Jäkel, C. Jacob, D. Schardt, C. P. Karger, and G. H. Hartmann. Relation between carbon ion ranges and x-ray CT numbers. Med Phys, 28(4): , Apr [3] H. Paganetti, H. Jiang, K. Parodi, R. Slopsema, and M. Engelsman. Clinical implementation of full Monte Carlo dose calculation in proton beam therapy. Phys Med Biol, 53(17): , Sep [4] Bryan Bednarz, Juliane Daartz, and Harald Paganetti. Dosimetric accuracy of planning and delivering small proton therapy fields. Phys Med Biol, 55(24): , Dec [5] A. J. Lomax, T. Bortfeld, G. Goitein, J. Debus, C. Dykstra, P. A. Tercier, P. A. Coucke, and R. O. Mirimanoff. A treatment planning inter-comparison of proton and intensity modulated photon radiotherapy. Radiother Oncol, 51(3): , Jun [6] M. Fippel and M. Soukup. A monte carlo dose calculation algorithm for proton therapy. Med Phys, 31(8): , Aug [7] S. Jan, G. Santin, D. Strul, S. Staelens, K. Assié, D. Autret, S. Avner, R. Barbier, M. Bardiès, P. M. Bloomfield, D. Brasse, V. Breton, P. Bruyndonckx, I. Buvat, A. F. Chatziioannou, Y. Choi, Y. H. Chung, C. Comtat, D. Donnarieix, L. Ferrer, S. J. Glick, C. J. Groiselle, D. Guez, P.-F. Honore, S. Kerhoas-Cavata, A. S. Kirov, V. Kohli, M. Koole, M. Krieguer, D. J. van der Laan, F. Lamare, G. Largeron, C. Lartizien, D. Lazaro, M. C. Maas, L. Maigne, F. Mayet, F. Melot, C. Merheb, E. Pennacchio, J. Perez, U. Pietrzyk, F. R. Rannou, M. Rey, D. R. Schaart, C. R. Schmidtlein, L. Simon, T. Y. Song, J.-M. Vieira, D. Visvikis, R. Van de Walle, E. Wieërs, and C. Morel. GATE: a simulation toolkit for PET and SPECT. Physics in Medicine and Biology, 49(19):4543, [8] S. Jan, D. Benoit, E. Becheva, T. Carlier, F. Cassol, P. Descourt, T. Frisson, L. Grevillot, L. Guigues, L. Maigne, C. Morel, Y. Perrot, N. Rehfeld, D. Sarrut, D. R. Schaart, S. Stute, U. Pietrzyk, D. Visvikis, N. Zahra, and I. Buvat. GATE V6: a major enhancement of the GATE simulation platform enabling modelling of CT and radiotherapy. Physics in Medicine and Biology, 56(4):881, [9] M. Dosanjh, B. Jones, and R. Meyer. Enlight and other eu-funded projects in hadron therapy. Br J Radiol, 83(994): , [10] L. Grevillot, T. Frisson, D. Maneval, N. Zahra, J.-N. Badel, and D. Sarrut. Simulation of a 6 MV Elekta Precise Linac photon beam using GATE/GEANT4. Physics in Medicine and Biology, 56(4):903,
110 TPS evaluation using GATE 25 [11] L. Grevillot, T. Frisson, N. Zahra, D. Bertrand, F. Stichelbaut, N. Freud, and D. Sarrut. Optimization of GEANT4 settings for Proton Pencil Beam Scanning simulations using GATE. Nuclear Instruments and Methods in Physics Research Section B: Beam Interactions with Materials and Atoms, 268(20): , [12] L. Grevillot, D. Bertrand, F. Dessy, N. Freud, and D. Sarrut. A Monte Carlo pencil beam scanning model for proton treatment plan simulation using GATE/GEANT4. Physics in Medicine and Biology, 56: , [13] S Agostinelli et al. Geant4 a simulation toolkit. Nuclear Instruments and Methods in Physics Research, A(506): , [14] J. Allison et.al. Geant4 developments and applications. Nuclear Science and IEEE Transactions on, 53(1): , Feb [15] Harald Paganetti. Dose to water versus dose to medium in proton beam therapy. Phys Med Biol, 54(14): , Jul [16] S. Camarasu-Pop, T. Glatard, J. Mościcki, H. Benoit-Cattin, and D. Sarrut. Dynamic Partitioning of GATE Monte-Carlo Simulations on EGEE. Journal of Grid Computing, 8: , /s [17] J. V. Siebers, P. J. Keall, A. E. Nahum, and R. Mohan. Converting absorbed dose to medium to absorbed dose to water for monte carlo based photon beam dose calculations. Phys Med Biol, 45(4): , Apr [18] H. Palmans and F. Verhaegen. Assigning nonelastic nuclear interaction cross sections to Hounsfield units for Monte Carlo treatment planning of proton beams. Phys Med Biol, 50(5): , Mar [19] H. Helen Liu. Dm rather than Dw should be used in Monte Carlo treatment planning. Med Phys, 29(5): , May [20] W. Schneider, T. Bortfeld, and W. Schlegel. Correlation between CT numbers and tissue parameters needed for Monte Carlo simulations of clinical dose distributions. Phys Med Biol, 45(2): , Feb [21] M. Soukup, M. Fippel, and M. Alber. A pencil beam algorithm for intensity modulated proton therapy derived from Monte Carlo simulations. Phys Med Biol, 50(21): , Nov [22] J. Apostolakis, M. Asai, A.G. Bogdanov, H. Burkhardt, G. Cosmo, S. Elles, G. Folger, V.M. Grichine, P. Gumplinger, A. Heikkinen, I. Hrivnacova, V.N. Ivantchenko, J. Jacquemier, T. Koi, R.P. Kokoulin, M. Kossov, H. Kurashige, I. McLaren, O. Link, M. Maire, W. Pokorski, T. Sasaki, N. Starkov, L. Urban, and D.H. Wright. Geometry and physics of the geant4 toolkit for high and medium energy applications. Radiation Physics and Chemistry, 78(10): , Workshop on Use of Monte Carlo Techniques for Design and Analysis of Radiation Detectors. [23] Geant4-Collaboration. Physics Reference Manual for Geant4. CERN, [24] A. Lomax. Intensity modulation methods for proton radiotherapy. Phys Med Biol, 44(1): , Jan [25] P. Seroul and D. Sarrut. Vv : Viewer for the evaluation of 4d image registration. In Medical Image Computing and Computer-Assisted Intervention MICCAI 2008 and New York, [26] ICRU. International Commission on Radiation Units and Measurements Report 49: Stopping Powers and Ranges for Protons and Alpha Particles, [27] A. Stankovskiy, S. Kerhoas-Cavata, R. Ferrand, C. Nauraye, and L. Demarzi. Monte Carlo modelling of the treatment line of the Proton Therapy Center in Orsay. Phys Med Biol, 54(8): , Apr
111 5.3. CONCLUSION & PERSPECTIVES 5.3 Conclusion & Perspectives This chapter presented the latest achievements of the thesis. Our goal was to make it feasible to evaluate TPSs. We demonstrated that our Monte Carlo platform is now ready for PBS treatment plan simulation in patient geometries. In addition, we also manage to interface the GATE outputs with commercially available dose comparison software. The progress made with the platform is very encouraging, however, there is still a long way to go before providing such a platform in a clinical environment. The platform has been partly validated using various test cases in relative dose. Further, the validation of an absolute dose calculation scheme will be necessary to provide a dose calculation engine that is fully independent of the TPS outputs. To further facilitate the use of the platform, it would be necessary to provide users with routines that allow converting machine specic BDL into a source description le in a standardized way. To decrease simulation statistical uctuations down to acceptable levels even in penumbra regions, an access to computer clusters is necessary. We currently benet of an easy access to the European grid called EGEE, which is a promising solution [117]. Implementation and validation protocols as already proposed for passive scattering techniques [118, 119] are also contemplated, but require years of clinical experience. DICOM images are currently not supported in GATE, therefore we used a home made toolkit, which is based on the ITK library 1, in order to convert DICOM images into GATE readable formats and vice versa. The DICOM interface tools are currently not publicly available, what complexies and limits the use of the platform for external users. Moreover, as the platform was upgraded using a single TPS, compatibility with other TPSs would be worthwhile investigating. Development of easy to use Monte Carlo platform for clinical applications is investigated in dierent places, with dierent objectives. On the GEANT4 web-sites, three open-source platforms are proposed 2 : G4EMU, which is available only in Japanese. GAMOS, which has been recently developed for medical physics applications, but that is also open to other applications. GATE, which is a well recognized and validated application for TEP and SPECT imaging simulations and that recently enlarged its eld of applicability to dosimetric applications, thus becoming a medical physics oriented GEANT4 application. The Boston group is currently working on the TOPAS project 3, in order to provide users with another GEANT4-based platform. This platform will, among others, provide users with an easy modeling interface for passive scattering systems. The main advantage of this platform might come from their clinical experience. Discussions about GATE/TOPAS compatibility by mean for instance of IAEA phase spaces are on-going. One could perform nozzle passive scattering simulations with TOPAS and dose calculation with associated PET imaging with GATE. The FLUKA Monte Carlo code [72] developed at CERN in Fortran language is also involved in clinical applications for TPS comparisons [120] and is an alternative to GEANT4 applications. It is noteworthy that initially FLUKA was a GEANT3 nuclear model, which later moved to a stand-alone Fortran Monte Carlo application. Other Monte Carlo codes such as MCNPX [69], PHITS [70], SHIELD-HIT [71] or PTRAN [121] are also widely used for proton simulations, but from our knowledge without TPS oriented developments. It is currently dicult to say which codes will remain in ten years from now and if one code will become a reference as EGS is for photon therapy. It is likely that the various platforms will evolve in parallel. Obviously, platforms such as TOPAS and FLUKA partly developed and used at the MGH and HIT 4 clinical centers, respectively, are promoted. However, we believe that other platforms such as GATE might have a role to play for future advances in hadrontherapy, as
112 CHAPTER 5. TPS COMPARISONS demonstrated in this thesis for the PBS treatment modality. 102
113 Chapter 6 Conclusion & Perspectives Cancer is a major disease worldwide and treatment techniques are steadily progressing in order to provide better care for patients. We are currently reaching a very challenging period for the eld of cancer treatment using radiation therapy. Over the last 20 years, the introduction of intensity modulation in the eld of photon therapy drastically changed the quality of the treatments. This has been made possible by the introduction of very sophisticated delivery techniques, which allow a better conformation to the tumor and sparing of the surrounding healthy tissues. Today, the ballistic of photon treatments is likely to have reached the maximum of its possibilities and improvements may come from new imaging possibilities, towards image guided and adaptive therapy, leading to a better day-to-day targeting of the tumor. In parallel, the introduction of new particles such as protons and carbon ions, having superior physical properties and producing higher biological eects in the tissues makes it possible to exceed photon therapy possibilities. While proton centers are becoming more and more accessible, the development of ion therapy facilities is more complex. The current European involvement through the ENLIGHT community in the eld of hadrontherapy and the recent construction of a few centers such HIT (Germany), CNAO (Italy) and MedAustron (Austria), may be the turning point for the emergence of hadrontherapy worldwide. One of the main challenge is the production of a signicant number of clinical evidences concerning the superiority of hadrontherapy in Europe, as it has been demonstrated for several years in Japan. The cost eectiveness of such treatments is also a key point that is being investigated. A strong collaboration between the clinicians, scientists and the companies is necessary to decrease the costs of the facilities and to make hadrontherapy more aordable for the future. For these new techniques, the treatment quality assurance is very important. TPSs used in clinical practice for the calculation and optimization of patient treatment plans must be fast and accurate. However, the dose calculation algorithms currently implemented are limited in some specic cases and especially near heterogeneities. The Monte Carlo technique has been considered to be the reference for dosimetric accuracy in medical physics for years, by simulating in detail particle interactions in patients. Therefore, it is an appropriate tool to evaluate TPS dose calculation algorithms. Although Monte Carlo studies are performed in several laboratories worldwide, there is currently no reference and easy-to-use Monte Carlo platform available for hadron therapy. In this thesis, we upgraded the GEANT4-based GATE Monte Carlo platform for proton dose calculations towards TPS comparisons and we focused on the active scanning modality, which is the most advanced technique. We selected the most appropriate physics models and parameters, in order to perform ecient and accurate proton dose calculations. Simulations were compared to measurements: while pristine Bragg peaks were well reproduced, larger discrepancies were found for the transverse dose spreading. As a result, a reference physics-list, together with an optimized 103
114 CHAPTER 6. CONCLUSION & PERSPECTIVES parameters-list have been proposed. Then, a modeling method was developed for active scanning beam delivery and applied to an IBA proton pencil beam scanning (PBS) system. The proposed method allows modeling a PBS system from the nozzle exit, based uniquely on beam data library measurements. Together with the method, appropriate tools have been released in GATE for clinical treatment plan simulation including the gantry rotation. The validation tests performed so far reached satisfactory agreements with measurements towards clinical applications. Finally, we interfaced GATE with the XiO TPS from Elekta, in order to compare TPS and Monte Carlo dose distributions. We presented a method to perform relevant comparisons between TPS and Monte Carlo, based on patient CT images. As a prerequisite, we compared the implemented beam models in various cases, using homogeneous and heterogeneous congurations. One comparison included measurements. Then, a method that allows converting Monte Carlo dose distributions in medium into water equivalent dose distributions, as approximated by TPSs, has been implemented. Finally, a two-eld prostate treatment plan has been evaluated, demonstrating the capability of the platform to simulate clinical treatment plans. Tools external to the Monte Carlo environment have been developed to interface GATE with DICOM les. Respecting international formats guaranteed compatibility between the Monte Carlo platform and other environments, such as commercial TPS and dose evaluation tools. Currently, we have not evaluated the platform in terms of absolute dosimetry, which is a crucial point to validate. Whilst the platform has been proven to allow for PBS treatment plan simulations, a detailed evaluation phase is still needed to evaluate the platform accuracy in various conditions. This validation procedure may include depth-dose and transverse proles, with small and large elds, using dierent energies and modulations, for simple and complex elds, including IMPT and absolute dosimetry. Moreover, for short range tumors, additional beam modiers such as range shifters and ridge lters may be inserted in the beam path, which would require additional validations. This platform was initially upgraded to support all types of ions and it would be worthwhile to evaluate the beam modeling method for a carbon therapy center. Beyond dosimetric aspects, the GATE/GEANT4 Monte Carlo code also allows simulating imaging applications and can be used for designing and optimizing prompt-particle (gammas, protons, etc.) or TEP cameras, which are of great importance for online treatment monitoring. Proton and carbon computed tomography are also subjects of interest, that could be investigated with such a platform. Such imaging modalities would allow to directly provide a 3D stopping power map of the patient, thus reducing the Hounseld unit to stopping power conversion uncertainty, with a lower integral dose to tissues than with conventional X-ray scanners [122, 123, 124]. To conclude, GATE is a promising, evolving and open source tool for medical physics research, allowing dosimetric and imaging applications. It has a great potential for clinical applications and foretells innovative interdisciplinary research advances. 104
115 Scientic contributions Articles in International Journals L. Grevillot, D. Bertrand, F. Dessy, N. Freud, and D. Sarrut. GATE as a GEANT4-based Monte Carlo platform for proton Pencil Beam Scanning (PBS) treatment plans evaluation. Submitted to Physics in Medicine and Biology, on August L. Grevillot, D. Bertrand, F. Dessy, N. Freud, and D. Sarrut. A Monte Carlo pencil beam scanning model for proton treatment plan simulation using GATE/GEANT4. Physics in Medicine and Biology, 56(16): , L. Grevillot, T Frisson, D Maneval, N Zahra, J-N Badel, and D Sarrut. Simulation of a 6 MV Elekta Precise Linac photon beam using GATE/GEANT4. Physics in Medicine and Biology, 56(4): , S Jan, D Benoit, E Becheva, T Carlier, F Cassol, P Descourt, T Frisson, L. Grevillot, L Guigues, L Maigne, C Morel, Y Perrot, N Rehfeld, D Sarrut, D R Schaart, S Stute, U Pietrzyk, D Visvikis, N Zahra, and I Buvat. GATE V6: a major enhancement of the GATE simulation platform enabling modelling of CT and radiotherapy. Physics in Medicine and Biology, 56(4): , L. Grevillot, T. Frisson, N. Zahra, D. Bertrand, F. Stichelbaut, N. Freud, and D. Sarrut. Optimization of GEANT4 settings for Proton Pencil Beam Scanning simulations using GATE. Nuclear Instruments and Methods in Physics Research Section B: Beam Interactions with Materials and Atoms, 268(20): , N. Zahra, T. Frisson, L. Grevillot, P. Lautesse, and D. Sarrut. Inuence of Geant4 parameters on dose distribution and computation time for carbon ion therapy simulation. Physica Medica, 26(4): , Oral Presentations in International Conferences L. Grevillot, T. Frisson, N. Zahra, D. Bertrand, F. Stichelbaut, N. Freud, and D. Sarrut. Optimization of GATE/Geant4 settings for Proton Pencil Beam Scanning simulations towards TPS Quality Assurance. Particle Therapy Co-Operative Group (PTCOG) 49, Gunma, Japan, Poster Presentations in International Conferences L. Grevillot, D. Bertrand, F. Dessy, N. Freud, and D. Sarrut. A Monte Carlo Pencil Beam Scanning model towards TPS Quality Assurance using GATE/GEANT4. Particle Therapy Co- Operative Group (PTCOG) 50, Philadelphia, USA, P. Gueth, S. Camarasu-Pop, T.Glatard, L. Grevillot and D. Sarrut. PBS proton treatment plan simulation with the GATE-Lab. Particle Therapy Co-Operative Group (PTCOG) 50, Philadelphia, USA,
116 M. Vidal, H. Szymanowski, C. Nauraye, L. De Marzi, T. Kajdrowicz, L. Grevillot, D. Sarrut, P. François and R. Ferrand. An analytical model for proton beam collimator scattering dose calculation. European Society for Radiotherapy and Oncology (ESTRO) 29, Barcelona, Spain, 2010 L. Grevillot, T. Frisson, N. Zahra, J-N Badel, and D. Sarrut. Validation of a new GATE module for radiation therapy: simulation of a 6 MV Elekta Precise linear accelerator head. Monte Carlo Treatment Planning (MCTP), Cardi, Wales,
117 Chapitre 7 Résumé en français Résumé L'hadronthérapie est une technique avancée de traitement du cancer par radiothérapie. Elle ore une ballistique d'irradiation bien supérieure à la radiothérapie conventionnelle, mais nécessite également un controle qualité plus poussé. Dans ce travail, nous avons implémenté de nouveaux outils dans la plateforme Monte Carlo GATE, an de pouvoir recalculer des plans de traitements issus d'un Système de Plannication de Traitement (TPS). Tout d'abord, nous avons déni un environnement de simulation permettant de réaliser des calculs précis et ecaces. Les simulations ont été validées avec des mesures et d'autres codes Monte Carlo, pour des prols de dose en profondeur et transverses. Un bon accord a été obtenu pour les prols de dose en profondeur, mais des écarts plus marqués ont été observés pour les prols transverses. Ensuite, une méthode de modélisation pour des systèmes de traitement à balayage actif de faisceau étroit (PBS) a été proposée. Elle a été appliquée à un système de protonthérapie IBA et validée par comparaison à des mesures pour des champs complexes. Une interface permettant de faire le lien entre GATE et des chiers DICOM RT ION PLAN et DICOM RT DOSE a également été réalisée. Enn, nous avons comparé des distributions de dose TPS et Monte Carlo en milieux homogènes et hétérogènes. Les modèles de faisceau implémentés dans ces deux outils dosimétriques ont montré un accord satisfaisant en milieu homogène, mais les limites du TPS ont été mises en évidence dans des milieux hétérogènes. Un plan de prostate composé de deux champs latéraux opposés a été simulé et comparé avec le TPS, démontrant les nouvelles capacités de la plateforme. Dans cette thèse de doctorat, nous avons montré que la plateforme Monte Carlo GATE est un bon candidat pour la simulation de plans de traitements PBS et peut permettre l'évaluation des algorithmes de calcul de dose implémentés dans les TPSs. Cette plateforme supporte également des applications d'imagerie, telles que l'imagerie PET ou gamma-prompt et ouvre la porte à des recherches multidisciplinaires innovantes. 107
118 CHAPITRE 7. RÉSUMÉ EN FRANÇAIS Préambule Ce chapitre résume en français l'ensemble du manuscrit, dans le but de donner une vue d'ensemble des recherches eectuées au cours de ces trois ans. Il est composé d'une première partie introductive, présentant le contexte européen du projet, ainsi que des prérequis nécessaires à la compréhension de la suite du manuscrit. Les trois parties suivantes présentent les diérents axes de recherches abordés pendant ce projet : la physique de la protonthérapie avec GATE/GEANT4 (1), un modèle Monte Carlo de faisceau PBS clinique (2) et des comparaisons de distributions de dose entre TPS et Monte Carlo (3). Enn, on trouvera les conclusions et perspectives futures de ce travail. 7.1 Contexte Introduction Incidence du cancer Le cancer est une maladie de première importance dans le monde. Il est considéré responsable de 25% de la mortalité en Europe et est le premier facteur de mortalité dans la population agée de 45 à 64 ans [1]. En 2008, le nombre de nouveaux cancers diagnostiqués en Europe a été estimé à 3,2 millions et le nombre de décès à 1,7 millions [2]. Les plus fréquents sont le cancer colorectal (13,6%), cancer du sein (13,1%), cancer du poumon (12,2%) et cancer de la prostate (11,9%) [2]. Les cancers respiratoires (larynx, trachée, bronches, poumons) sont les plus létaux et sont responsables de 5% de la mortalité en Europe et de 20% de tous les décès dûs au cancer [1]. On estime que 45% des cancers diagnostiqués peuvent être soignés [3]. De plus amples détails sur l'incidence du cancer à travers le monde sont disponibles dans [4]. La situation de l'europe en 2011 est illustrée dans la gure suivante 7.1. Figure 7.1 Incidence des diérents types de cancer en Europe [4]. Traitment du cancer Le terme cancer est générique et utilisé pour décrire une division anormale et anarchique des cellules, qui peuvent invalider d'autres tissus. Les cellules cancereuses 108
119 7.1. CONTEXTE peuvent se répendre dans le corps humain à travers le système sanguin et lymphatique. Il y a trois grandes familles de traitements : la chirurgie, les médicaments et les radiations. En général, les diverses modalitées de traitement sont combinées, mais le choix précis du traitement administré dépend de la taille de la tumeur, de sa situation, ainsi que de l'état général du patient. On estime dans les pays industrialisés que la radiothérapie est utilisée dans 70% des cas environ [3]. De plus amples informations sur la dénition du cancer, ainsi que sur les diérentes possibilités de traitements sont disponibles sur internet [5, 6]. Le but ultime des traitements est d'éradiquer la maladie, sans aecter les tissus sains environnants. En pratique, la décision médicale est un compromis entre probabilité de contrôle de la tumeur (TCP) et probabilité de complication dans les tissus sains (NTCP). La chirurgie de première intention permet de retirer la masse tumorale, mais des inltrations dans les tissus environnants, ainsi que des risques métastatiques limitent souvent son ecacité. En présence de métastases, l'utilisation de solutions médicamenteuses telles que la chimiothérapie est nécessaire. La radiothérapie permet de tuer les cellules en déposant une forte dose de radiation au sein de la tumeur. Radiothérapie conventionnelle externe La radiothérapie conventionnelle externe utilise des faisceaux d'électrons ou de photons. Au cours des dix dernières années, la complexication des techniques de photon-thérapie au moyen de collimateurs multi-lames a révolutionné sont utilisation, notamment grâce à la mise en place de la technique IMRT 1, qui permet d'améliorer la ballistique d'irradiation de manière très signicative. Bien que de nouvelles techniques comme l'arc-thérapie fassent encore leur apparition, le gain thérapeutique attendu est similaire à celui obtenu par l'insertion des collimateurs multi-lames, mais permet une diminution du temps de traitement et donc une augmentation du nombre total de patients traités. De nouveaux outils d'irradiation (comme le Cyberknife ou la Tomotherapie) permettent également d'atteindre des ballistiques d'irradiation similaires [3]. L'hadronthérapie La ballistique d'une irradiation est fortement dépendante du type de particule utilisé. L'hadronthérapie est une technique de radiothérapie externe avancée, utilisant des ions à faible TEL 2 comme les protons et des ions à haut TEL comme les ions carbone. A l'inverse des photons, les ions ont l'avantage de s'arreter à une profondeur connue et de déposer leur énergie de manière accrue dans la partie distale appelée Pic de Bragg, où se situe la tumeur. De plus, les particules à haut TEL comme les ions carbone produisent plus de lésions et permettent de traiter des tumeurs radiorésistantes. Des distributions de dose en profondeur représentatives des diérentes modalités de radiothérapie externe sont présentées dans la Figure 7.2. Objectif La tâche principale d'un physicien médical est de garantir la bonne dose au bon endroit dans le patient. Les systèmes de plannication de traitement (TPS) utilisés en radiothérapie sont rapides, mais avec une précision limitée dans certains cas particuliers. A l'inverse, une simulation Monte Carlo est plus lente, mais considérée comme la référence pour la précision de son calcul. Par conséquent, la méthode Monte Carlo est idéale pour évaluer et valider la précision dosimétrique des TPSs. Dans cette thèse de doctorat, nous avons modélisé un système PBS clinique et recalculé des plans de traitement généré par un TPS, dans le but d'évaluer sa précision. Une présentation plus détaillée des objectifs est présentée dans la section IMRT : RadioThérapie par Modulation d'intensité 2. TEL : Transfer d'energie Linéaire 109
120 CHAPITRE 7. RÉSUMÉ EN FRANÇAIS (a) (b) Figure 7.2 (a) présentation des dépôts de dose de diérentes particules dans l'eau (extrait de GSI). (b) comparaison de dose entre un pic de Bragg étalé (SOBP) de protons et un faisceau de photons, qui illustre l'avantage ballistique des protons par rapport aux photons (extrait de [7]) L'hadronthérapie en Europe : ENLIGHT & le projet PARTNER Les résultats prometteurs démontrés au Japon et en Allemagne avec des faisceaux de carbone ont constitué un intérêt majeur en Europe [8]. Le développement de centres d'hadronthérapie est supporté par la communauté ENLIGHT 3 (European Network for Light Ion Therapy), qui rassemble un grand nombre d'instituts Européens depuis 2002 [8]. ENLIGHT est constitué de plus de 150 chercheurs, appartenant à plus de 50 universités et instituts de recherche à travers 16 pays. Plusieurs projets ont vu le jour sous l'aile d'enlight, dans le but de développer, établir et opimiser l'hadronthérapie en Europe. Cette thèse de doctorat fait partie d'un projet de 4 ans appelé PARTNER (PARticle Training Network for European Radiotherapy). 23 doctorants et post-doctorants ont été recrutés dans les divers domaine de l'hadronthérapie, comme la physique, les TPS, la biologie ou encore les essais cliniques. Un eort très important a été placé sur les aspects de réseau et de formation des jeunes chercheurs, notamment à travers l'organisation de 12 formations dans les diérentes institutions européennes impliquées. La recherche présentée dans ce manuscrit a été réalisée à travers une collaboration entre l'entreprise IBA (Louvain-la-Neuve, Belgique) et le laboratoire CREATIS relié au projet français d'hadronthérapie ETOILE Rationnel pour l'hadronthérapie La supériorité de la ballistique d'irradiation des ions par rapport aux photons permet de diminuer la dose aux tissus sains d'un facteur 2-10 [8]. La dose intégrale délivrée au patient par les protons est environ deux fois moindre que celle des traitements photons délivrés par IMRT [9]. Les particules à haut TEL ont un avantage additionel caractérisé par une ecacité biologique relative (RBE) accrue, spécialement dans le pic de Bragg, permettant de traiter des tumeurs radiorésistantes aux particules de bas TEL (comme les photons et les protons) [3]. Malgré un avantage indéniable en terme de conformation de dose, il n'y a actuellement aucune évidence clinique démontrant l'augmentation du taux de survie des patients traités avec des protons au lieu des photons [10]. Dans [11], la supériorité des protons sur les photons est mise en évidence pour les enfants, sur base des toxicités tardives. En eet, les photons produisent un volume de
121 7.1. CONTEXTE tissu sain irradié à faible dose et une dose intégrale supérieurs aux protons [7]. Ces deux facteurs sont liés à l'augmentation du risque de cancer radio-induit [11]. Ceci est illustré dans le cas d'un traitement pédiatrique pour un méduloblastome (Figure 7.3). Figure 7.3 Irradiation d'un méduloblastome : cette gure montre l'amélioration de la ballistique des protons par rapport aux photons et la réduction de dose délivrée au corps (extrait de IBA). Le recul actuel sur les traitements par ions carbone ne permet pas de conclure sur les toxicités à long terme, mais il y a clairement un intérêt pour les particules à haut TEL dans le traitement des tumeurs radiorésistantes [11]. L'augmentation du taux de survie par thérapie carbone a été démontré au Japon (NIRS) à travers une étude clinique incluant 1601 patients entre 1994 et 2003 [12]. En Mars 2010, 5196 patients ont été enregistrés dans ce même centre [13]. En Allemagne, des résultats similaires ont été obtenus, mais sur un nombre de patients bien inférieur [14, 15]. Les résultats cliniques ont été particulièrement prometteurs dans certains cancers radiorésistants, inopérables et habituellement non guérissables, tels que certains mélanomes des muqueuses, certains sarcomes (ostéosarcomes, chondrosarcomes), des cancers des glandes salivaires, certaines tumeurs cérébrales, ou encore certains cancers diciles d'accès chirurgical sous la base du crâne [12]. En résumé, l'hadronthérapie permet d'augmenter la dose délivrée dans la tumeur et de la diminuer dans les tissus sains. Les probabilités de survie des patients sont augmentées pour certaines tumeurs et les risques de cancer radio-induits diminués. De plus, les particules à haut TEL comme les carbones ont un eect radiobiologique supérieur, permettant de traiter des tumeurs radiorésistantes et habituellement incurables avec les moyens conventionnels. En Europe, on estime qu'environ 13,5 à 16% des traitements de radiothérapie pourraient bénécier de l'hadronthérapie, ce qui correspond à environ 6% de tous les cancers [17, 18] Le code Monte Carlo GATE GATE est un logiciel open source développé par la collaboration internationale OpenGATE 4, qui est dédié aux simulations numériques en imagerie médicale et en radiothérapie. GATE a été initié en 2001 pour faciliter l'utilisation du code GEANT4 pour les simulations en imagerie médicale et la première version a été rendue publique en 2004 [37]. Il permet actuellement la simulation de sytèmes PET, SPECT, CT et de radiothérapies [38]. Etant basé sur GEANT4, GATE bénécie de sa exibilité et permet de dénir des géométries complexes. Il inclut la gestion du temps dans les simulations et est compatible en permanence avec les dernières versions GEANT4 disponibles. Il utilise un système de commande basé sur des macros, permettant de congurer des dispositifs
122 CHAPITRE 7. RÉSUMÉ EN FRANÇAIS expérimentaux simples ou complexes. D'un point de vue pratique, une plateforme Monte Carlo supportant les divers champs d'applications de la physique médicale est d'un grand intérêt, spécialement avec la progression de la radiothérapie guidée par l'image et la nécéssité de calculs de dose haute précision Balayage actif de faisceau étroit (PBS) La technique de traitement PBS consiste à balayer un faisceau n de quelques milimètres de diamètre (typiquement 3-7 mm d'écart type), dans les deux directions transverses et à des vitesses moyennes de 1-10 mm/ms. Pour conformer la dose à la tumeur en profondeur, l'énergie du faisceau est ajustée (Figure 7.4). Figure 7.4 Vue schématique de la modalité de traitement PBS. La tumeur est traitée en balayant transversalement le faisceau dans des couches d'iso-énergie (extrait de GSI). Cette technique d'irradiation est actuellement la plus avancée et permet de mieux conformer la distribution de dose dans la tumeur et de mieux préserver les tissus sains. [9]. La technique PBS est utilisée depuis 1996 à l'institut Paul Scherrer (PSI) en Suisse pour des traitements protons [42] et depuis 1997 à GSI en Allemagne pour des traitements carbone [43]. Il est à noter qu'actuellement cette technique n'est pas la plus répandue. La technique dite de diusion passive est la plus utilisée, mais les progrès technologiques actuels ont permis de développer des systèmes PBS très performants et la tendance risque de s'inverser dans le futur Système de plannication de traitement (TPS) Les traitements de radiothérapie sont prescrits par l'équipe médicale. La prescription correspond à une dose de radiation à délivrer dans la tumeur avec un type de particule, ainsi qu'à des contraintes de doses pour les organes à risques environnants. Les contraintes de dose, le nombre de champs délivrés et la position des champs d'irradiations sont dénis manuellement par l'équipe médicale dans le TPS. Ensuite, le TPS calcule et optimise de façon itérative la dose délivrée dans la tumeur et dans les organes. Pour ce faire, il faut optimiser la position, uence et énergie de plusieurs milliers de faisceaux [42]. Ce processus réalisé par le TPS est appelé planication inverse [49]. Actuellement, l'algorithme de dose le plus répandu est appelé pencil beam. Il est basé sur un algorithme précédent appelé ray tracing (ou encore ray casting ou broad beam). La profondeur radiologique (équivalente eau) d'un point est calculée par intégration des densités électroniques contenues dans l'image CT du patient, le long d'un faisceau innitésimal [50]. Les algorithmes ray tracing ne tiennent pas compte des hétérogénéités autour du faisceau in- nitésimal, ce qui peut conduire à des résultats trompeurs [50]. Les algorithmes pencil beam 112
123 7.1. CONTEXTE représentent le faisceau initial comme une collection de sous-faisceaux innitésimaux pondérés et superposent leurs contributions. Il a été démontré que cette technique prend mieux en compte les hétérogénéités, ce qui lui vaut d'être la méthode de référence en routine clinique actuellement pour les protons et les carbones [51, 52, 53, 54, 46]. L'intérêt de cette technique est démontré dans la Figure 7.5. Le nombre de sous-faisceaux utilisés est un compromis entre vitesse de calcul et précision. L'amélioration du temps de calcul est toujours un problème d'actualité [55, 56]. Dispositif expérimental Ray tracing Pencil beam Figure 7.5 Distributions de dose intégrale en profondeur à 3 énergies, dans un fantôme hétérogène décrit en haut : entre 3 et 5 cm tissus osseux et pulmonaire adjacents, le reste est du tissu mou. Les calculs TPS sont comparés aux simulations Monte Carlo prises comme référence. L'algorithme pencil beam utilise ici 49 sous-faisceaux par faisceau original (extrait de [46]) Objectif du projet Note projet était de développer une plateforme Monte Carlo pour la simulation de systèmes PBS en hadronthérapie, avec un but ultime d'évaluation et de validation des TPSs. La méthode Monte Carlo est considérée comme la référence en physique médicale et par conséquent est un outil approprié pour l'évaluation des TPSs. Alors que les interactions éléctromagnétiques sont plutôt bien comprises, les interactions nucléaires sont plus complexes et diciles à modéliser analytiquement. Les interactions nucléaires sont responsables d'environ 10-15% de la dose délivrée par des traitements protons [57] et d'environ 40% de la dose délivrée dans la région précédant le pic de Bragg par des traitements carbones [35], pour les énergies thérapeutiques maximales. Le calcul de la dose iso-eective 5 est plus complexe pour les ions carbones que pour les protons, à cause de la fragmentation nucléaire. La dose iso-eective dépend des spectres de particules, de doses et de TELs, distribués à travers le volume irradié, ainsi que du modèle radiobologique choisi [3, 58]. D'un point de vue assurance qualité, il est très attractif de pouvoir recalculer des plans de traitement et donc de pouvoir réévaluer des décisions cliniques sur base de simulations 5. La dose iso-eective correspond à la dose photon équivalente qui auraient été délivrée dans des conditions de référence et qui aurait les mêmes eets biologiques. Elle permet par exemple de comparer des doses provenant de photons et d'ions. 113
124 CHAPITRE 7. RÉSUMÉ EN FRANÇAIS Monte Carlo. Pour les systèmes de diusion passive, le code GEANT4 a été largement utilisé à l'hopital de Boston depuis des années [59]. La simulation de systèmes PBS est actuellement en progression, due à une utilisation récente plus répandue de cette technique [60, 61]. Au delà du calcul dosimétrique, Monte Carlo permet de simuler des dispositifs très complexes, an de mieux comprendre la physique de l'hadronthérapie et d'améliorer les algorithmes de calcul des TPSs. La puissance de ces codes permet d'ouvrir la porte à d'autres domaines de recherche tels que la production d'émetteurs β + (comme 11 C ou 15 O) [62, 63, 64] suivant des irradiations proton et carbone, l'émission de particules prompts (comme des gammas ou des protons) suivant les collisions nucléaires [65, 66, 67, 68], ainsi que leurs corrélations avec la position du pic de Bragg dans le patient. Bien qu'il y ait plusieurs codes Monte Carlo disponibles (par exemple MCNPX [69], PHITS [70], SHIELD-HIT [71], FLUKA [72], GEANT4 [26]), il n'y a actuellement pas de plateforme validée, facile d'utilisation et disponible pour les simulations en hadronthérapie. Ce point très important est l'un des piliers de ce projet. Dans ce travail, nous avons choisi de contribuer au développement de la platefrome GATE, parcequ'elle bénécie de la exibilité et de la puissance de GEANT4, mais aussi parecequ'elle permet déjà la simulation de systèmes d'imagerie et qu'elle est déjà conçue dans le but de simplier l'utilisation de l'outil Monte Carlo GEANT4 pour la physique médicale. Nous avons orienté notre travail sur la modalité de traitement PBS en protonthérapie et comparé des distributions de dose avec le TPS XiO d'elekta. L'ensemble des développements ont été réalisés avec un objectif d'adaptabilité aux autres ions, tels que le carbone et en utilisant des format standards basés sur la norme DICOM. Pour atteindre cet objectif, notre recherche a été naturellement divisée en trois parties : dénir un environnement de simulation approprié à la protonthérapie, modéliser un système d'irradiation PBS et enn comparer des distributions de dose TPS et Monte Carlo. Ces trois parties sont présentées dans les paragraphes suivants. 7.2 Environnement de simulation Monte Carlo GEANT4 est une boîte à outil de simulation Monte Carlo très versatile, permettant de simuler les interactions des particules dans la matière à très haute et très basse énergie, de 100 TeV pour des applications de type aéro-spaciale ou LHC 6, à quelques ev pour des applications telles que la microdosimétrie. Les applications de physique médicale se situent plutôt dans la gamme des kev et des MeV et il est très important de dénir un environnement de simulation approprié à notre application, pour la gamme d'énergie et les types de particules qui nous concernent. Le détail de cette étude à été publié [107], mais une version résumée est proposée dans la suite de cette section. L'ensemble des résultats et gures présentés sont extrait de cette publication. Pour commencer ce travail, je me suis posé 3 questions fondamentales : 1. Quels sont les sections ecaces d'interactions, processus et modèles physiques qui décrivent le mieux un faisceau de protons? 2. Quel est l'importance relative de chaque processus physique vis-à-vis des autres et comment les évaluer? 3. Quels sont les paramètres de simulation qui inuencent une simulation? Il est rapidement apparu qu'avant de pouvoir comparer des simulations à des mesures, il faut d'abord dénir des paramètres de simulation robustes. L'unique référence en la matière dans notre laboratoire, provenait du travail de mon collègue Nabil Zahra avec des ions carbone [98]. Dans son étude, il a mis en évidence que les deux paramètres essentiels sont le cut et le step : les particules secondaires telles que les électrons, positrons et photons ne sont produit que si leur parcours 7 6. http ://public.web.cern.ch/public/en/lhc 7. dans le cas des photons, une longueur d'absorption liée à la probabilité d'interaction est dénie 114
125 7.2. ENVIRONNEMENT DE SIMULATION MONTE CARLO associé est supérieur à la valeur de cut déni. Ensuite, toute particule produite est suivie jusqu'à ce qu'elle n'ait plus d'énergie. Chaque particule est suivie pas-à-pas et il est possible de dénir la taille maximale du pas autorisé en jouant sur le paramètre de step. Dans notre étude, nous avons mis en évidence un troisième paramètre : le binning des tables électromagnétiques. En eet, les interactions physiques sont précalculées dans des tables et la résolution de ces tables inuence directement le résultat des simulations, comme illustré dans la Figure 7.6. Dans les versions (a) (b) cut 1mm cut 0.1mm cut 1µm ref 2 2 de/dx (MeV/mm/proton) de/dx (MeV/mm/proton) Depth in water (mm) Depth in water (mm) Figure 7.6 Lorsque le paramètre de binning n'est pas correctement déni (a), des uctuations sur le dépôt de dose, ainsi qu'une forte sensibilité au paramètre de cut sont observées. Lorsque le binning est susant (b), la simulation est robuste : il n'y a plus de uctuations de dose et le parcours des protons n'est plus lié à la valeur de cut. La courbe ref est calculée avec un cut et un step de 1 mm. plus anciennes de GEANT4, le paramètre de binning n'était pas accessible et les utilisateurs dénissaient des step et des cut très petits, de l'ordre de 10 µm. Nous avons déni des cut et step de 1 mm, inférieur à la taille des voxels utilisés dans les images CT des patients, en association avec un binning de 50 bins/décade. Ceci a permis d'obtenir des simulations robustes, précises et ecaces pour des applications dosimétriques à l'échelle macroscopique. En eet, utiliser des cut/step de 1 mm au lieu de 10 µm permet d'augmenter l'ecacité de simulation de deux ordres de grandeur. Le paramètre dosimétrique le plus important est la position du pic de Bragg. L'incertitude sur sa position est dûe au potentiel d'ionisation, qui est le paramètre physique comprenant le plus d'incertitude et qui joue un rôle prépondérant dans le calcul du pouvoir d'arrêt (équation de Bethe- Bloch). Pour l'eau, nous avons déni une valeur I = 75 ev en accord avec les recommendations ICRU 37 et 49. Une fois l'environnement de simulation déni, nous avons comparé nos simulations GEANT4 avec des mesures et d'autres codes Monte Carlo. Les comparaisons avec d'autres codes Monte Carlo ont mis en évidence des points critiques du calcul dosimétrique. Un pic de Bragg mono-énergétique a été simulé dans l'eau et comparé aux codes MCNPX et PHITS (Figure 7.7). Des diérences sur la forme des pic de Bragg sont observées. Ces diérences sont attribuées essentiellement au modèle nucléaire non-élastique, même si une partie peut aussi être attribuée aux modèles d'interactions électromagnétiques. Un écart de l'ordre de 5% sur l'énergie totale délivrée par un faisceau de 230 MeV est observé entre GEANT4, MCNPX et PHITS : 215,5 MeV/proton avec GEANT4, 204,7 MeV/proton avec PHITS et 205,6 MeV/proton avec MCNPX. Les écarts les plus grands ont été identiés pour les prols transverses. En eet, il y a 15% de diérence entre les écrats type de GEANT4 et de MCNPX dans le pic de Bragg : σ GEANT 4 = 6,8 mm, σ P HIT S = 7,5 mm et σ MCNP X = 8,1 mm. Ils sont dûs aux algorithmes de diusion coulombienne multiple utilisés. La simulation détaillée pas-à-pas de la diusion (algorithme de diusion coulombienne simple) a produit une valeur σ GEANT 4 = 7,5 mm et est considéré comme la référence. Cependant, l'utilisation 115
126 CHAPITRE 7. RÉSUMÉ EN FRANÇAIS 2 (a) MCNPX PHITS GEANT4 (b) GEANT4 (MS) GEANT4 (SS) MCNPX PHITS de/dx (MeV/mm/proton) Absolute Dose (Gy) Depth in water (mm) Lateral position (mm) Figure 7.7 Proles de dose en profondeur et transverse à 32 cm (dans le pic de Bragg) pour un faisceau de 230 MeV dans l'eau, avec GEANT4, PHITS et MCNPX. de ce mode de calcul détaillé nécessite un temps de calcul supérieur de 3 ordres de grandeur, ce qui le rend inutilisable en pratique. Par la suite, des comparaisons similaires ont été réalisées entre GEANT4 et des mesures. Les modèles physiques sélectionnés correspondent à [34], sauf pour le modèle nucléaire non-élastique : nous avons choisi precompound au lieu de binary cascade, car il était en meilleur accord avec les mesures. La comparaison de prols en profondeur est illustrée dans la Figure 7.8. La précision sur le parcours des protons dans l'eau est meilleure que le milli- simulation error (a) measurement simulation error (b) measurement Normalized Edep (a.u.) % 3% 2% 1% 0% -1% -2% -3% Error Normalized Edep (a.u.) % 3% 2% 1% 0% -1% -2% -3% Error Depth in water (mm) -4% Depth in water (mm) -4% Figure 7.8 Comapraisons entre mesures et simulations de prols de dose en profondeur pour la plus basse énergie : 98,7 MeV (a) et pour la plus haute énergie : 227,7 MeV (b). Les écarts de dose point-à-point sont présentés avec des points verts et correspondent à l'axe de droite. mètre. Des écarts plus importants sont observés à haute énergie, mais restent compris dans ±2% (si l'on négligle les uctuations statistiques). Ces résultats sont acceptables cliniquement. La comparaison de prols transverses avec des mesures est illustrée dans la Figure 7.9. La comparaison proposée ici n'est que qualitative, car on compare des doses et des densités optiques. Le but était de comparer l'augmentation relative de la diusion de la dose en profondeur, avec l'augmentation relative de la diusion de la densité optique des lms en profondeur. Si l'on avait pu convertir les densités optiques mesurées en dose, l'augmentation relative de la diusion de la dose mesurée aurait été supérieure à l'augmentation relative de la diusion de la densité optique en profondeur. Par contre, l'augmenation relative de la diusion de la dose simulée en profondeur est inférieure à l'augmentation relative de la densité optique en profondeur. Cette sous-estimation atteint 20% dans le pic de Bragg pour la plus haute énergie, conrmant l'hypothèse obtenue en comparant les 116
127 7.3. MODÈLE PBS MONTE CARLO (a) (b) (c) Phantom entrance 186 mm depth in PMMA 226 mm depth in PMMA measurement simulation measurement simulation measurement simulation Normalized Dose (a.u.) Normalized Dose (a.u.) Normalized Dose (a.u.) Lateral position (mm) Lateral position (mm) Lateral position (mm) Figure 7.9 Comparaison entre prols de doses transverses simulés et prols de doses transverses mesurés avec des lms radiochromiques EBT1 dans du PMMA, pour un faisceau de MeV, avec une taille de spot Gaussien de 3 mm de déviation standard à l'entrée. Les barres d'erreur de 5% sur les mesures ont été ajoutées. Les prols ont été normalisés à la dose maximale. codes Monte Carlo et suggérant une sous-estimation de la diusion avec GEANT4. Des mesures complémentaires seraient nécessairent pour approfondir cette étude de manière quantitative. Cette étude avait pour but de dénir un environnement de simulation approprié à la protonthérapie et de l'évaluer par rapport à des mesures et par rapport à d'autres codes Monte Carlo. La simulation de prols de dose en profondeur est en bon accord avec les mesures et atteint un niveau de précison satisfaisant pour des applications cliniques, de l'ordre de 2% pour la dose et de 1 mm pour le parcours. Des écarts plus marqués ont été montré pour la diusion transverse de la dose. Une évaluation quantitative et détaillée par rapport à des mesures serait nécessaire pour clarier la précision des diérents codes Monte Carlo. Cependant, les résultats actuels ne semblent pas signicativement limitants pour une application clinique. Le calcul de la dose absolue n'a pas été étudié en détail, mais des écarts signicatifs de 5% entre diérents codes Monte Carlo ont été démontrés et suggèrent qu'une évaluation plus approfondie serait nécessaire pour une application clinique pertinente. Cette étude a permis une bonne compréhension de l'outil de simulation Monte Carlo GEANT4 et a conduit à la proposition de deux listes de références concernant les modèles physiques et les paramètres, appelés physics-list et parameters-list, pour les applications de protonthérapie. 7.3 Modèle PBS Monte Carlo La seconde étude de ma thèse et peut-être la plus innovante, a été de proposer une méthode de modélisation de systèmes d'irradiations PBS de protonthérapie ne nécessitant pas de simuler les éléments constitutifs de la tête d'irradition, avec un souci d'applicabilité pour des sytèmes carbone. De plus, la modélisation devait permettre la simulation de plans de traitements générés par un TPS et donc intégrer une interface DICOM. Le détail de cette étude à été publié [108], mais une version résumée est proposée dans la suite de cette section. L'ensemble des résultats et gures présentés sont extrait de cette publication. Pour mener à bien cette étude, je me suis focalisé sur trois questions : 1. Quelles sont les caractéristiques physiques principales d'un faisceau PBS clinique? 2. Doit-on simuler l'intégralité de la tête d'irradiation, ou est-il susant de modéliser le faisceau PBS depuis la sortie de la tête de traitement? 3. Quelles sont les informations pertinentes d'un plan de traitement et comment les intégrer dans la simulation? Pour résoudre la première question, il m'a fallu appréhender des problèmes d'optique faisceau. Les informations pertinentes ont été extraites du manuel du code TRANSPORT [105]. De 117
128 CHAPITRE 7. RÉSUMÉ EN FRANÇAIS nombreuses discussions avec des spécialistes en cyclotron et en ligne de transport faisceau ont également été nécessaires. Il existe deux grands types de modélisation : la modélisation complète de la tête d'irradiation et la modélisation externe de la tête d'irradiation. La première méthode est nécessaire pour modéliser des systèmes de diusion passive, car les propriétés physiques du faisceau de traitement sont dénies en interagissant avec l'ensemble des éléments présent dans la tête d'irradiation [59]. Cette méthode de modélisation est aussi utilisable pour des sytèmes à balayage actif [60], mais l'importance des éléments présents dans la nozzle est bien moindre. En eet, l'épaisseur équivalente eau de la nozzle PBS IBA a été estimée inférieure à 2 mm et correspond aux interactions avec les chambres d'ionisations et fenêtres de vide pour l'essentiel. Une modélisation complète de la tête d'irradiation permet de simuler en détail les interactions du faisceau avec ces éléments, ainsi qu'avec les aimants de balayage. Les avantages principaux sont d'inclure la diusion, ainsi que la production de fragments secondaires, qui peuvent contribuer à la dose loin de l'axe du faisceau. Les aimants de scanning peuvent également avoir un eet déformant sur le spot. A l'institut Paul Sherrer (PSI) en Suisse, une modélisation Monte Carlo externe de la tête d'irradiation est utilisée depuis plus de 10 ans pour évaluer les déciences de leurs algorithmes TPS [106]. Une modélisation externe est basée sur un ensemble de mesures caractéristiques (BDL) de la tête d'irradiation, réalisées vers l'isocentre de traitement. Bien que la tête d'irradiation ne soit pas simulée en détail, ses eets, comme la diusion ou la déformation du spot, sont mesurés et donc indirectement pris en compte dans la modélisation. Par souci de simplicité et d'adaptabilité, nous avons choisi cette méthode de modélisation, qui présente l'avantage de ne pas être dépendante des données constructeur, mais aussi de ne pas nécessiter de mesures additionnelles pour la modélisation. En eet, la mesure de la BDL est requise pour réaliser le modèle du faisceau dans le TPS. Cet avantage clé de la méthode permet de ne pas perturber les activités cliniques. Dans un premier temps, un outil permettant de simuler un faisceau étroit sur base de paramètres d'optique faisceau a été développé dans GATE et appelé GATESourcePencilBeamScanning. Cette source de particules comprend trois paramètres optiques pour chacun des deux axes transverses du faisceau : la taille, la divergence angulaire et l'émittance. L'émittance du faisceau permet de décrire la corrélation entre la position et la divergence des protons et représente l'aire de l'espace de phase constitué de la densité de probabilité de position radiale des protons en abscisse et de la densité de probabilité de divergence angulaire des protons en ordonnée, comme illustré dans la Figure Le faisceau est aussi décrit par deux paramètres d'énergie qui sont : l'énergie moyenne du faisceau et son écrat type. Une seconde source permettant de générer une collection de faisceaux étroits et permettant de simuler des plans de traitement PBS a été réalisée par la suite et appelée GATESourceTPSPencilBeam. Il était important de prendre en compte les informations du plan de traitement dés le début de la création de cette source, car chaque faisceau étroit d'un plan de traitement est caractérisé par son énergie à l'entrée de la tête de traitement, alors que les faisceaux sont générés à partir de la sortie de la tête de traitement, comme illustré dans la Figure Le modèle est basé sur deux chiers d'entrée appelés source description le (SDF) et plan description le (PDF). Le PDF décrit le plan de traitement et le SDF décrit le système d'irradiation. Ainsi, le modèle permet sur base de l'information de l'énergie du faisceau étroit à l'entrée de la nozzle (lu dans le PDF), de générer un faisceau en sortie de nozzle avec des propriétés optiques et énergétiques correspondant à la BDL du système d'irradiation (décrit dans le SDF). Les plans de traitement générés avec un TPS sont exportés au format DICOM RT ION PLAN et convertis en PDF, qui est un format comptabile pour GATE, à l'aide d'outils propores au laboratoire et basés sur la bibliothèque ITK 8. La BDL d'un système est composé de mesures de spots dans l'air et de pics de Bragg dans l'eau à plusieurs énergies. Pour chaque énergie, la mesure du pic de Bragg permet d'ajuster le spectre énergétique : le parcours des protons est associé à une
129 7.3. MODÈLE PBS MONTE CARLO (a) 10 Beam extent σ x (mm) Position along the beam path z (mm) (b) (c) (d) θ (mrad) f(x,y) x (mm) θ (mrad) f(x,y) x (mm) θ (mrad) f(x,y) x (mm) Figure 7.10 Paramètres optiques dans le plan XoZ. Illustrations des variations de la taille du faisceau (a) et des ellipses d'espace de phase à -120 mm (b), 0 mm (c) et +120 mm (d). Figure 7.11 Ce diagramme décrit schématiquement le système de traitement, ainsi que la position de la source GATESourceTPSPencilBeam (PBS). 119

130 CHAPITRE 7. RÉSUMÉ EN FRANÇAIS énergie moyenne et le ratio de dose entre le plateau et le pic est associé à la dispersion énergétique. Les mesures de tailles de spots à diérentes positions autours de l'isocentre permettent de calculer les paramètres optiques de divergence, taille et d'émittance, en sortie de la tête d'irradiation. Une fois que les paramètres optiques et énergétiques sont extraits pour chacune des énergies de la BDL, un t polynomial est appliqué pour chacun des paramètres de façon indépendante, en fonction de l'énergie à l'entrée de la tête d'irradiation. Les paramètres de ces équations : ordre du polynome et coecients polynomiaux, sont ensuites insérés dans le SDF. La modélisation du système d'irradiation est réalisée une seule fois, ensuite le SDF peut-être utilisé pour toutes les simulations suivantes, comme illustré dans la Figure Figure 7.12 Vue schématique menant à la comparaison de doses issues d'un TPS et de GATE. Nous avons appliqué cette méthode à un système PBS de protonthérapie IBA, sur base d'une BDL composée de 27 énergies entre 100 et 226,7 MeV. Nous avons ensuite recalculé les pics de Bragg dans l'eau et spot dans l'air sur base du SDF, an de valider la modélisation. La validation des paramètres énergétiques est présentée dans la Figure Les résultats présentés sont satisfaisants et permettent une utilisation clinique. Une analyse plus détaillée de ces résultats a montré que les écarts sont majoritairement dûs à l'ajustement polynômial, qui suppose des variations douces des paramètres sytème en fonction de l'énergie. La validation des paramètres optiques est présentés dans la Figure Les résultats présentés sont également satisfaisants pour une utilisation clinique. La taille des spots a été reproduite avec une précision de 0,2 mm à l'isocentre et de 0,4 mm autour de l'isocentre. Comme pour les prols de doses en profondeur, une analyse plus détaillée des résultats a montré que les écarts sont majoritairement dûs à l'ajustement polynômial et à l'hypothèse de variations douces des paramètres sytème en fonction de l'énergie. Pour valider de manière plus complète la modélisation, des plans de traitements complexes ont été reproduits en simulation et comparés à des mesures. Un champ d'irradiation de cm 2 et produisant un SOBP de 32 cm de parcours, modulé entre 22 et 32 cm, a été mesuré dans l'eau. Le champ était composé de 2446 faisceau étroits avec un espace inter-faisceau de 8 mm dans les 2 directions latérales. La simulation a été normalisée à la mesure au centre du SOBP (Figure 7.15). Des accords de 0,8 mm sur le parcours et de 2% sur la dose entre la mesure et la simulation ont 120
131 7.3. MODÈLE PBS MONTE CARLO Energy Spread Energy Spread(%) Fitted energy spread(%) 0.1 Fitted energy spread(mev) Fitted energy (MeV) Energy at nozzle entrance (MeV) Energy at nozzle exit (a) Dose differences and range differences Mean point-to-point dose difference (%) Dose-to-peak difference (%) Range agreement (mm) Energy (MeV) (b) Figure 7.13 La gure (a) représente les paramètres d'énergie moyenne et d'écart type sur l'énergie en sortie de la tête d'irradiation, en fonction de l'énergie en entrée de la tête d'irradiation. La gure (b) représente les diérences moyennes de dose point-à-point, les diérences de dose au pic et les diérences de range, entre simulation et mesure. x direction y direction Spot size difference (mm) Energy (MeV) Figure 7.14 Cette gure illustre les diérences entre tailles de spots simulés et mesurés à l'isocentre, dans les deux directions transverses de/dx (A.U.) Simulation Measurement Depth in water (mm) Figure 7.15 Comparaison d'un SOBP mesuré et simulé dans l'eau. 121
132 CHAPITRE 7. RÉSUMÉ EN FRANÇAIS été obtenus. La contribution des interactions nucléaires sur la dose mesurée est très dicle à évaluer sur base de pics de Bragg simples. Un dispositif expérimental particulier a permi d'évaluer la contribution des interactions nucléaires en mesurant la dose à l'axe pour diérentes tailles de champs d'irradiation. Le ratio de la dose mesurée à l'axe pour un champ de taille donné (f) par rapport à un champ de référence de taille f = cm 2 permet de déterminer le facteur de taille de champ (FSF) [125]. Cette expérience a été réalisée pour quatre énergies, quatre tailles de champs et à trois profondeurs diérentes (Tableau 7.1). Les accords entre FSFs simulés et mesurés sont Energie (MeV) f(cm) / d(cm) ,4% -0,4% 0,7% 1,0% 0,8% 0,4% -0,3% 1,8% 6 2,4% -0,8% 0,5% 0,3% -0,8% -0,5% 0,0% 2,0% 8 1,1% -1,2% -0,4% 0,0% -0,6% -1,3% -1,9% 0,4% 12 0,1% -3,2% 0,5% -1,5% -1,3% -1,8% -1,1% -0,8% Table 7.1 Ce tableau présente les écarts entre FSF mesurés et simulés. généralement meilleurs que 2%, avec un écart maximal de 3,2%, pouvant en partie être expliqué par des incertitudes de section ecace diérentielle d'interaction nucléaire de l'ordre de 20-40%. Enn, un troisième test de validation, appelé test de forme, a permis d'évaluer la simulation d'une carte de dose 2D sur base d'une irradiation complexe. Ce test avait pour but de produire un ensemble formes complexes, composées de divers niveaux de doses, avec des zones à fort et faible gradient de dose. Les mesures ont été réalisées perpendiculairement à l'axe du faisceau avec un imageur portal scintillant. Une mesure est illustrée dans la Figure Ce test a été réalisé (a) (b) Figure 7.16 Présentation de la carte de dose simulée à 117 MeV (a), ainsi que la comparaison gamma index associée (b). à trois énergies (72,5, 148,8 and 221,8 MeV) et évalué sur base de comparaisons gamma index avec un critère de 2%/2mm. Plus de 97% des points ont passé ce test avec succès. Une étude plus détaillée à montré que les écarts en bordure de champ et dans les zones de doses maximales étaient probablement dûs à des eets de bord et de saturation du détecteur. 122
133 7.4. COMPARAISONS TPS ET MONTE CARLO Dans cette étude, une méthode de modélisation générique de systèmes PBS a été proposée et appliquée à un appareil de protonthérapie IBA. Les résultats présentés valident cette méthode pour des applications cliniques telles que l'évaluation des calculs de dose TPS. L'ensemble des outils Monte Carlo développés est disponible publiquement dans GATE et le SDF spécique au système IBA est disponible sur demande. Par la suite, il serait intéressant d'évaluer l'adaptabilité de cette méthode à un système carbone. 7.4 Comparaisons TPS et Monte Carlo Dans cette étude, notre but était de comparer des distributions de doses calculées avec un TPS et avec Monte Carlo, en utilisant le modèle PBS et l'environnement de simulations dénis dans les sections précédentes. L'article relatif à cette étude a été soumis au journal Physics in Medicine and Biology en Août Un résumé de cette étude est proposé dans la section suivante. Pour atteindre cet objectif, je me suis intéressé aux trois questions suivantes : 1. Quelles sont les diérences principales entre GATE et XiO concernant l'implémentation des modèles physiques, ainsi que leurs impacts sur le calcul de la dose? 2. Quelles sont les diérences entre les deux modèles de faisceaux? 3. Quelles diérences majeures y'a-t-il au niveau de la gestion des milieux hétérogènes? Lorsque l'on compare deux outils de calcul dose, il y a toujours des diérences, car les calculs sont basés sur des implémentations diérentes de la physique. Par exemple, le TPS ajuste des distributions de doses mesurées dans l'eau, alors que la méthode Monte Carlo calcule directement les dépôts de dose dans les tissus, sur base de l'équation de Bethe-Bloch. En conséquence, des pics de Braggs calculés dans l'eau sont probablement plus proches de ceux mesurés avec un TPS, qu'avec Monte Carlo. La puissance du calcul Monte Carlo n'est pas attendue pour des cas simples et homogènes, mais plutôt dans des cas complexes et hétérogènes tels que les patients. La limitation des algorithmes dits de ray-tracing est bien connue et a été présentée en introduction. Pour palier à ce problème, les algorithmes pencil beam considèrent qu'un faisceau étroit peut-être décrit par une collection de sous-faisceaux pondérés, an de mieux prendre en compte les hétérogénéités. Cette approche tend vers la méthode Monte Carlo et de ce fait est limitée par le compromis classique qui oppose la précision dosimétrique et le temps de calcul. Pour la modalité de traitement de diusion passive, des comparaions Monte Carlo et TPS ont été mises en places depuis quelques années à Boston [59], mais la plateforme de calcul n'est actuellement pas publiquement disponible. Dans la plupart des cas, les diérences ont été considérées cliniquement acceptables et partiellement dûes aux diérences entre dose dans l'eau (TPS) et dose dans le milieu (Monte Carlo) [115]. Cependant, ces comparaisons ont permis dans certains cas d'identier les causes des diérences, comme récemment pour des petits champs de traitement [116]. Par conséquent, on s'attend à constater des diérences entre TPS et Monte Carlo, la question est de savoir si ces diérences ont un impact clinique pour le patient ou non. La compréhension du TPS XiO d'elekta que nous avons utilisé pour faire nos comparaisons a été réalisée en collaboration avec les développeurs du TPS, alors que l'évaluation de l'outil de calcul GATE a déjà été présentée dans la première partie de la thèse. Pour palier à la problématique principale entre dose dans l'eau et dose dans le milieu, une méthode de calcul permettant de convertir des doses dans le milieu en dose dans l'eau a été implémentée dans GATE. La gestion des hétérogénéités est également diérente. Dans GATE, les unités Hounseld (HU) enregistrées dans les images scanner d'un patient sont converties en densités et compositions sur base de la méthode proposée dans [126]. Dans XiO, une courbe de calibration entre HU et densité massique est nécessaire, puis, les conversions en pouvoir d'arrêt se font sur base de données de l'icru 46, associant densité massique et pouvoir d'arrêt. Dans le but de comparer de manière pertinente les 123
134 CHAPITRE 7. RÉSUMÉ EN FRANÇAIS dose TPS et Monte Carlo, nous avons inséré la même courbe de conversion HU/densité dans XiO et dans GATE. Pour nir, nous avons comparé les pouvoirs d'arrêt relatifs de GATE et de XiO entre ces deux outils (Tableau 7.2). Les écarts sur les pouvoirs d'arrêt sont de l'ordre de -2%, sauf pour le poumon où une diérence maximale de +3% est observée. Ces écarts sont dans les tolérances, car l'incertitude sur les pouvoirs d'arrêt est estimé à 1-4% dans les milieux composés selon l'icru 49. Densité massique S mgat E S m Sw GAT E S m Sw XiO 1- ( S m Sw GAT E Sw S m XiO ) (g.cm 3 ) (MeV.cm 2.g 1 ) (%) 0,0012 6,50 0,89 0,88-1,4 0,26 7,30 1,00 0,99-1,3 0,40 7,30 1,00 1,00-0,3 0,50 7,30 1,00 1,01 +0,4 0,60 7,30 1,00 1,02 +1,0 0,70 7,30 1,00 1,02 +1,7 0,80 7,30 1,00 1,03 +2,3 0,90 7,30 1,00 1,04 +3,0 0,95 7,52 1,03 1,02-1,3 1,00 7,42 1,02 1,00-2,1 1,10 7,25 1,00 0,99-1,2 1,20 7,12 0,98 0,97-1,4 1,30 7,05 0,97 0,95-2,1 1,40 6,92 0,95 0,94-1,8 1,50 6,79 0,93 0,92-1,3 1,60 6,74 0,93 0,91-1,9 1,70 6,65 0,92 0,90-1,7 1,80 6,57 0,90 0,89-1,6 1,90 6,53 0,90 0,88-2,0 1,96 6,51 0,90 0,88-1,6 Table 7.2 Ce tableau présente les pouvoir d'arrêts relatifs calculés par GATE et XIO pour une série de matériaux, ainsi que leurs diérences. Nous avons par la suite eectué diverses comparaisons dans des milieux homogènes et hétérogènes. Dans un premier temps, nous avons évalué la cohérence des deux modèles de faisceau en eectuant une série de comparaisons dans l'eau, ainsi que dans cinq autres milieux homogènes de densité 0,9, 1, 1,2 1,5 et 1,8. Nous avons évalué le parcours des protons, la forme des pics de Bragg et la diusion dans le milieu à plusieurs profondeurs. Le cas de l'eau est présenté dans le Figure Dans l'eau, l'écart moyen sur la dose point à point est inférieur à 2% et l'écart sur le parcours est de 0,5%, ce qui correspond à un écart de 1,5 mm à cette énergie. Les écarts sur les prols transverses (écart type) sont inférieurs à 0,2 mm. Dans les autres tissus, des diérences comparables ont été observées, avec une précision sur le parcours en accord avec les diérences de pouvoirs d'arrêt (Tableau 7.2), comme présenté dans le Tableau 7.3. Les résultats présentés démontrent un bon accord entre les deux modèles de source. Pour nir, un plan de traitement complexe a été délivré dans un fantôme homogène composé de plaques de SP34 et des mesures transverses à plusieurs profondeurs ont été eectuées au moyen d'une matrice 2D de 1024 diodes. La distribution de dose dans le fantôme est illustrée dans la Figure Les plans transverses calculés avec XiO et GATE ont été comparés aux mesures sur base de gammas indexes avec un critère de 3%/3mm (Tableau 7.4). Ces résultats valident ces deux 124
135 7.4. COMPARAISONS TPS ET MONTE CARLO 10 Gate (a) XiO 0.2 (b) Gate0 XiO0 Gate10 XiO10 Gate25 XiO25 Gate27.6 XiO27.6 de/dx (A.U.) Dose (A.U.) Depth in water (mm) Lateral position (mm) Figure 7.17 Comparaion des prols en profondeurs et prols transverses à 0, 10, 25 and 27,6 cm, avec un faisceau de protons de 28 g/cm 2. Densité massique (g/cm 3 ) 0,9 1 1,2 1,5 1,8 Parcours XiO 267,5 249,3 215,1 180,5 155,7 GATE 277,1 245,6 213,2 179,1 154,2 Dierence (mm) -9,6 3,7 1,9 1,4 1,5 Dierence (%) -3,5% 1,5% 0,9% 0,8% 1,0% Tailles de spots maximales XiO (mm) 6,5 6,6 6,2 5,8 5,4 GATE (mm) 7 6,3 6,2 6 5,7 Table 7.3 Comparaison de prols de dose en profondeur et transverses pour un faisceau de 25 g/cm 2. Figure 7.18 Distribution de dose complexe dans le fantôme SP
 302 287 272 200 140 50 3%/3mm gamma GATE vs meas, (%) 98,2 98,3 97,6 98,7 98,4 96,7 XiO vs meas, (%) 96,6 99,5 99,2 99,1 98,8 98 2%/2mm gamma XiO vs GATE")
136 CHAPITRE 7. RÉSUMÉ EN FRANÇAIS Profondeur de mesure (mm) %/3mm gamma GATE vs meas, (%) 98,2 98,3 97,6 98,7 98,4 96,7 XiO vs meas, (%) 96,6 99,5 99,2 99,1 98,8 98 2%/2mm gamma XiO vs GATE (%) 95,4 98,9 98,8 99,2 98,9 98,2 Table 7.4 Comparaison des gammas indexes. modèles par rapport aux mesures dans un milieu homogène, avec des gammas indexes supérieurs à 96% pour les deux outils. Il est a noter que la modélisation du modèle de faisceau Monte Carlo a déjà été partiellement validée dans la section précédente et que le modèle de faisceau TPS a également été validé par des études en interne chez IBA. Les deux modèles du système d'irradiation ont démontré un accord satisfaisant entre eux, ainsi qu'avec des mesures, en vue de comparaisons plus complexes dans des patients. Dans un second temps, des comparaisons dans des milieux hétérogènes ont été menées dans deux types de sandwichs, appelés sandwich transverses (hétérogénéités placées perpendiculairement à l'axe du faisceau) et sandwichs longitudinaux (hétérogénéités adjacentes à l'axe du faisceau), comme illustré dans la Figure Les écarts entre dose dans l'eau et dose dans dans le sandwich transverse sandwich longitudinal Figure 7.19 Présentation des deux types de sandwichs utilisés. milieu ont été évalués pour des congurations de sandwichs transverses. Le premier sandwich était composé de 4 matériaux de densités : 1,08, 0,94, 1,09 et 1,22, avec comme épaisseurs : 40, 5, 70 et 85 mm, respectivement. Le second sandwich était composé de six matériaux de densités : 1,09, 1,25, 0,26, 1, 1,90 et 1, avec comme épaisseurs : 10,20, 50, 35, 10 et 20 mm. Des faisceaux de 18 et 10 g/cm 2 ont été utilisés pour le premier et le second sandwich. Les courbes de doses sont présentées dans la Figure Des écarts entre dose dans l'eau et dose dans le milieu de plus de 10% sont calculés dans les tissus osseux les plus denses, alors qu'ils sont bien inférieurs dans les tissus plus mous. Ceci démontre l'intérêt de cette conversion pour évaluer les algorithmes de calcul des TPSs, an de permettre de diérencier les écarts de dose dûs à l'algorithme de calcul et les écarts de dose globaux, dûs à la fois à l'algorithme de calcul et à la nature de la dose enregistrée (dose dans l'eau ou dans le milieu). Les limites de l'algorithme de calcul de dose implémenté dans le TPS ont été évaluées dans un fantôme longitudinal, composé d'une interface os/poumon épaisse de 2 cm et ayant pour densités 1,90 et 0,26. Trois niveaux de précisions ont été testés dans le TPS : n=0 (Ray Tracing), n=1 (49 126
137 7.4. COMPARAISONS TPS ET MONTE CARLO 4 (a) - premier sandwich Gate Gate_Water XiO Dw/Dm 4 (b) - second sandwich Gate Gate_Water XiO Dw/Dm Relative dose (A.U.) Dw/Dm Relative dose (A.U.) Dw/Dm Depth in phantom (mm) Depth in phantom (mm) Figure 7.20 Illustration des calculs de dose dans les deux sandwichs. Les écarts entre dose dans l'eau et dose dans le milieu D w /D m correspondent à l'axe de droite. sous-faisceaux), n=5 (121 sous-faisceaux). Les résultats sont présentés dans la Figure Dans ce Relative dose (A.U.) XiO n0 XiO n3 XiO n5 XiO n3 shifted (1 mm) GATE_WATER Depth in phantom (mm) Figure 7.21 Prole de dose en profondeur obtneus avec GATE et Xio. cas test, la simulation Monte Carlo est prise comme référence. Avec une précision n=0, seulement un pic correspondant au poumon est produit, alors que l'os est complètement négligé. Avec n=3 et n=5, des résultats similaires sont produits, prenant mieux en compte l'hétérogénéité, mais ne reproduisant pas le résultat Monte Carlo. Enn, en déplaçant la grille de calcul de XiO (n=3) de 1 mm, un artéfact d'échantillonnage du scanner a lieu et des voxels de densités intermédiaires entre le poumon et l'os sont créés, ce qui conduit à la production d'un troisième pic (entre l'os et le poumon). Ce type d'artéfact ne se produit pas avec Monte Carlo, car on utilise la grille CT de référence, sans ré-échantillonage pour le calcul. Enn, un plan de traitement complexe d'une prostate a été généré avec XiO et comparé avec GATE. Le plan de traitement était composé de deux champs latéraux opposés, comme illustré dans la Figure Une dose de 80 Gy a été prescrite dans la tumeur, avec des contraintes de doses pour les organes à risques environnants (fémur, rectum, vessie). Les calculs dosimétriques réalisés avec GATE et XiO, en utilisant 3 niveaux de précisions, ont été évalués à l'aide du logiciel ARTIVIEW de la companie AQUILAB. Pour les deux champs latéraux, un artéfact de dose entre XiO et GATE a été montré à cause de la présence de gaz dans le rectum, comme illustré ici pour le 127
138 CHAPITRE 7. RÉSUMÉ EN FRANÇAIS Plan transverse Plan coronal Plan sagittal Figure 7.22 Distribution de dose dans le patient, avec les vues transverse, coronale et sagittale. champ létral gauche (Figure 7.23). Le parcours maximal prescrit était de 23 g/cm 2. Une diérence (a) XiO n=0 (b) XiO n=5 (c) GATE_water Figure 7.23 Comparaison de distributions de dose calculées avec GATE et XIO dans la coupe 70 du scanner, pour le champ latéral gauche. de parcours de l'ordre de 0,5-1% (1-2,3 mm) a été constatée. Des prols de dose pour le champ latéral droit sont illustrés dans la Figure L'évaluation globale des distributions de dose est basée sur des histogrammes dose volume (DVH). Un accord satisfaisant d'un point de vue clinique a été montré pour ce cas, avec 94.9% et 97,8-98% du PTV recevant au moins 95% de la dose prescrite, en utilisant GATE et XiO, respectivement. Cependant, des diérences de couverture signicatives du PTV ont été démontrées, notamment au niveau du volume correspondant à 100% de la dose prescrite (V 100 ). Des diérences entre les dose maximales ( nmax ) et minimales ( nmin ) reçues ont aussi été mises en évidence. L'inuence de la dose dans le milieu par rapport à la dose dans l'eau a été évaluée et a pour conséquence principale un déplacement des coubes DVH des organes cibles vers des doses supérieures. L'ensemble des résultats est résumé dans la Figure 7.25 et dans le Tableau 7.5. Dans cette étude, une méthode permettant de comparer des distributions de doses TPS avec l'outil Monte Carlo GATE a été proposée. Un algorithme de conversion de dose dans le milieu en dose dans l'eau a été implémenté dans GATE. Un accord satisfaisant entre les modèles de faisceau du système d'irradiation IBA implémentés dans XiO et GATE a été montré, sur base de comparaisons dans des milieux homogènes. L'inuence de la conversion dose dans le milieu en dose dans l'eau, ainsi que les limites de précision des algorithmes analytiques de calculs implémentés dans le TPS ont été mis en évidence dans des fantômes hétérogènes. Enn, la comparaison d'un plan de traitement de prostate généré avec le TPS et recalculé avec GATE a été présentée, démontrant la capacité de la plateforme à évaluer des distributions de doses issues d'un TPS et son potentiel pour de futures applications dans des centres d'hadronthérapie. 128
139 7.4. COMPARAISONS TPS ET MONTE CARLO Gate XiO (a) Gate_water Gate XiO (b) Gate_water Dose (Gy) Dose (Gy) Depth in patient (mm) Depth in patient (mm) Figure 7.24 Prols de dose en profondeur (a) et transverses (b) pour le champ latéral droit. Les gures supérieures correspondent au centre de la tumeur et les gures inférieures mises à l'échelle 1/2 (dans un but de visualisation) correspondent à la périphérie de la tumeur. Volume (%) (a) GATE dose to water vs. XiO PTV GTV Seminal Vesicle Bladder RT Femur LT Femur Rectum Rt pelvis Lt Pelvis PTV GTV Seminal Vesicle Bladder RT Femur LT Femur Rectum Rt pelvis Lt Pelvis (b) GATE dose to water vs. dose to medium Volume (%) PTV GTV Seminal Vesicle Bladder RT Femur LT Femur Rectum Rt pelvis Lt Pelvis PTV GTV Seminal Vesicle Bladder RT Femur LT Femur Rectum Rt pelvis Lt Pelvis Dose (%) Dose (%) Figure 7.25 (a) Histogrames dose volume calculés avec XiO (n=3) (dotted lines) et GATE dose to water (line). (b) Histogrames dose volume calculés avec GATE dose to water (line) and dose to medium (dotted line). 129
140 CHAPITRE 7. RÉSUMÉ EN FRANÇAIS Organe GATE GATE_water XiO n=0 XiO n=3 XiO n=5 PTV V 100 (%) PTV V 95 (%) PTV D nmax (Gy) PTV D av (Gy) PTV D nmin (Gy) GTV V 100 (%) GTV V 95 (%) GTV D nmax (Gy) GTV D av (Gy) GTV D nmin (Gy) S. Vesicle V 100 (%) S. Vesicle V 95 (%) S. Vesicle D nmax (Gy) S. Vesicle D av (Gy) S. Vesicle D nmin (Gy) Table 7.5 Evaluation de chires clés calculés avec GATE et XiO sur base des DVHs. 7.5 Conclusion Le cancer est un problème majeur à l'échelle mondiale et les techniques de soins sont en évolution continue pour améliorer les traitements des patients. L'hadronthérapie qui est une forme avancée de radiothérapie est considérée comme une arme potentielle pour le traitement. La ballistique supérieure d'irradiation des protons et autres ions permet de mieux cibler les tumeurs et épargner les tissus sains environnants. En conséquence, l'assurance qualité de ce type de traitement est primordiale. Les TPS utilisés en routine clinique pour l'optimisation des plans de traitement doivent être rapides et précis. Cependant, les algorithmes de calcul de dose implémentés sont limités dans certains cas et spécialement près des hétérogénéités. Depuis des années, la méthode Monte Carlo est considérée comme la référence en physique médicale pour sa précision dosimétrique, ce qui en fait par conséquent un candidat idéal pour l'évaluation des algorithmes de calcul implémentés dans les TPSs. Malgré une utilisation répandue d'outils Monte Carlo dans divers laboratoire à travers le monde, il n'y a actuellement pas de plateforme de référence, facile d'utilisation et publiquement disponible. Dans cette thèse de doctorat, nous avons implémenté de nouveaux outils dans la plateforme GATE, qui est basée sur l'outil GEANT4, en nous focalisant sur la modalité de traitement PBS, qui est actuellement la technique de traitement la plus avancée. Nous avons dans une première partie sélectionné les modèles physiques et les paramètres permettant de dénir un environnement de simulation robuste, précis et ecace. Les simulations ont été comparées aux mesures, mettant en évidence un bon accord entre pic de Bragg simulés et mesurés, ainsi qu'une incertitude plus marquée, bien que cliniquement acceptable, pour les prols de doses transverses. Cette étude s'est conclue par la dénition d'une liste de modèles physiques et de paramètres optimisés. Notre seconde étude s'est attachée au développement d'une méthode générique de modélisation de sytèmes PBS, ainsi qu'à sa validation pour un système de protonthérapie IBA. Cette méthode permet de modéliser un système PBS (proton ou carbone) depuis la sortie de la tête de traitement, sur base unique de la BDL du système. Les outils associés à cette méthode sont disponibles dans la versions de GATEV6.1 et permettent la simulation de plans de traitements PBS. Dans une troisième et dernière étude, nous avons interfacé l'outil GATE avec le TPS XiO de la société Elekta, an de comparer des distributions de dose TPS avec Monte Carlo. Nous avons présenté une méthode per- 130
141 7.5. CONCLUSION mettant de comparer de manière pertinente les distributions de doses issues du TPS avec GATE. Le prérequis aux comparaisons patients était de s'assurer que les modèles de faisceau implémentés dans ces deux outils dosimétriques étaient comparables. Un ensemble de tests a donc été réalisé dans des fantômes homogènes et hétérogènes. Une comparaison incluait des mesures. Ensuite, une méthode de conversion de la dose dans le milieu calculée par Monte Carlo en dose dans l'eau, comme approximé par les TPSs, a été développée an de mieux évaluer les algorithmes du TPS. Cet outil sera disponible dans la prochaine version de l'outil GATE. Enn, des distributions de doses calculées par GATE et XiO pour un plan de traitement de prostate ont été comparées, démontrant la capacité de la plateforme à évaluer des plans de traitements cliniques. Aucune différence cliniquement signicative n'a été montrée pour ce cas. Des outils externe à la plateforme Monte Carlo ont été développé an d'interfacer GATE avec des chiers au format DICOM. Le respect de formats internationaux tels que DICOM permet de rendre compatible la plateforme de simulation avec d'autres environnements, comme des TPSs et des outils d'évaluation de cartes de doses. L'ensemble des doses simulées ont été normalisées soit à des mesures, soit au calcul du TPS. Il sera nécessaire par la suite de valider une méthode de calcul dosimétrique absolue. Dans l'objectif d'évaluation de TPSs, il est également nécessaire au préalable de valider la plateforme sur un ensemble de mesures caractéristiques et dans des conditions complexes. Ces tests pourraient inclure plusieurs tailles de champs, diverses modulations et énergies, ainsi que des plans IMPT 9. Dans certains traitements, des outils modiant le faisceau sont insérés en sortie de la tête d'irradiation et il serait également nécessaire de valider leur intégration. Cette plateforme a été développée pour supporter tous les types de particules et il serait intéressant d'évaluer l'applicabilité de ses outils pour un centre de thérapie carbone. Au delà des aspects dosimétrique, GATE permet des applications d'imagerie et peut-être utilisé pour la simulation de particles dites prompts, comme des gammas ou des protons, ou la simulation d'émetteurs β +. Ce type d'application permettrait à terme de contrôler les traitements d'hadronthérapie en ligne. D'autres sujets de recherche comme la proton ou la carbone tomography peuvent-être envisagés. Ces modalités d'imagerie permettraient d'obtenir directement les pouvoirs d'arrêt à l'intérieur du patient, réduisant ainsi l'incertitude sur la conversion entre unité Hounseld et pouvoir d'arrêt, tout en délivrant une dose de radiation inférieure aux scanners à rayons X conventionnels [122, 123, 124]. Pour conclure, GATE est un outil évolutif, désormais dédié à la recherche en physique médicale, qui permet des applications dosimétriques et des applications d'imagerie. Cet outil présente un grand potentiel et laisse entrevoir des avancés dans des recherches pluridisciplinaires innovantes. 9. IMPT : Protonthérapie par modulation d'intensité 131
142 CHAPITRE 7. RÉSUMÉ EN FRANÇAIS 132
143 Bibliography [1] Elodie NIEDERLAENDER. Causes of death in the eu. Eurostat - Population and social conditions - Statistics in focus, KS-NK EN-N, [2] J. Ferlay, D. M. Parkin, and E. Steliarova-Foucher. Estimates of cancer incidence and mortality in europe in Eur J Cancer, 46(4):765781, Mar [3] IAEA. International Atomic Eenergy Agency And the International Commission: Relative Biological Eectivness In Ion Beam Therapy. Technical report, IAEA, [4] J Ferlay, HR Shin, F Bray, D Forman, C Mathers, and DM Parkin. GLOBOCAN 2008 and Cancer Incidence and Mortality Worldwide: IARC CancerBase No. 10, [5] European Cancer Observatory (France). [6] National Cancer Institute (U.S.A). [7] Torunn I Yock and Nancy J Tarbell. Technology insight: Proton beam radiotherapy for treatment in pediatric brain tumors. Nat Clin Pract Oncol, 1(2):97103; quiz 1 p following 111, Dec [8] M. Dosanjh, B. Jones, and R. Meyer. Enlight and other eu-funded projects in hadron therapy. Br J Radiol, 83(994):811813, [9] A. J. Lomax, T. Bortfeld, G. Goitein, J. Debus, C. Dykstra, P. A. Tercier, P. A. Coucke, and R. O. Mirimano. A treatment planning inter-comparison of proton and intensity modulated photon radiotherapy. Radiother Oncol, 51(3):257271, Jun [10] Eugen B Hug. Protons versus photons: a status assessment at the beginning of the 21st Century. Radiother Oncol, 73 Suppl 2:S35S37, Dec [11] Eleanor A Blakely and Polly Y Chang. Late eects from hadron therapy. Radiother Oncol, 73 Suppl 2:S134S140, Dec [12] Tsujii H, Mizoe JE, Kamada T, Baba M, Kato S, Kato H, Tsuji H, Yamada S, Yasuda S, Ohno T, Yanagi T, Hasegawa A, Sugawara T, Ezawa H, Kandatsu S, Yoshikawa K, Kishimoto R, and Miyamoto T. Overview of clinical experience on carbon ion therapy at NIRS. Radiother. Oncol., 73 Suppl2:S4149, [13] Tohru Okada, Tadashi Kamada, Hiroshi Tsuji, Jun etsu Mizoe, Masayuki Baba, Shingo Kato, Shigeru Yamada, Shinji Sugahara, Shigeo Yasuda, Naoyoshi Yamamoto, Reiko Imai, Azusa Hasegawa, Hiroshi Imada, Hiroki Kiyohara, Kenichi Jingu, Makoto Shinoto, and Hirohiko Tsujii. Carbon ion radiotherapy: clinical experiences at National Instituteof Radiological Science (NIRS). J Radiat Res (Tokyo), 51(4):355364, [14] Daniela Schulz-Ertner, Anna Nikoghosyan, Christoph Thilmann, Thomas Haberer, Oliver Jäkel, Christian Karger, Gerhard Kraft, Michael Wannenmacher, and Jürgen Debus. Results 133
144 BIBLIOGRAPHY of carbon ion radiotherapy in 152 patients. Int J Radiat Oncol Biol Phys, 58(2):631640, Feb [15] Stephanie E Combs, Malte Ellerbrock, Thomas Haberer, Daniel Habermehl, Angelika Hoess, Oliver Jäkel, Alexandra Jensen, Swantje Klemm, Marc Münter, Jakob Naumann, Anna Nikoghosyan, Susanne Oertel, Katia Parodi, Stefan Rieken, and Jürgen Debus. Heidelberg ion therapy center (hit): Initial clinical experience in the rst 80 patients. Acta Oncol, 49(7): , Oct [16] Herman Suit, Thomas DeLaney, Saveli Goldberg, Harald Paganetti, Ben Clasie, Leo Gerweck, Andrzej Niemierko, Eric Hall, Jacob Flanz, Josh Hallman, and Alexei Tromov. Proton vs carbon ion beams in the denitive radiation treatment of cancer patients. Radiother Oncol, 95(1):322, Apr [17] Marie Hélène Baron, Pascal Pommier, Véronique Favrel, Gilles Truc, Jacques Balosso, and Joel Rochat. A "one-day survey": as a reliable estimation of the potential recruitment for proton- and carbon- ion therapy in France. Radiother Oncol, 73 Suppl 2:S15S17, Dec [18] Ramona Mayer, Ulrike Mock, Robert Jäger, Richard Pötter, Christian Vutuc, Helmut Eiter, Kristine Krugmann, Josef Hammer, Brigitte Hirn, Robert Hawliczek, Tomas-Henrik Knocke-Abulesz, Peter Lukas, Elisabeth Nechville, Brigitte Pakisch, Michael Papauschek, Wolfgang Raunik, Walter Rhomberg, Hubert Sabitzer, Annemarie Schratter-Sehn, Felix Sedlmayer, Irene Wedrich, and Thomas Auberger. Epidemiological aspects of hadron therapy: a prospective nationwide study of the austrian project medaustron and the austrian society of radiooncology (oegro). Radiother Oncol, 73 Suppl 2:S24S28, Dec [19] M P Johannesma, P Pommier, and Y Lievens. Cost-eectiveness of particle therapy: Current evidence and future needs. Radiother Oncol, 89:127134, [20] R Orecchia, A Zurlo, A Loasses, M Krengli, G Tosi, S Zurrida, P Zucali, and U Veronesi. Particle beam therapy (hadrontherapy): basis for interest and clinical experience. Eur J Cancer, 34(4):459468, [21] M Lodge, M P Johannesma, L Stirk, A J Munro, D Ruysscher, and T Jeerson. A systematic literature review of the clinical and cost-eectiveness of hadron therapy in cancer. Radiother Oncol, 83:110122, [22] A Peeters, J P C Grutters, M P Johannesma, S Reimoser, D Ruysscher, J L Severens, M A Joore, and P Lambin. How costly is particle therapy? cost analysis of external beam radiotherapy with carbon-ions, protons and photons. Radiother Oncol, 95:4553, [23] O Jäkel, L Beate, S E Combs, D Schulz-Ertner, and J Debus. On the cost-eectiveness of carbon ion radiation therapy for skull base chordoma. Radiother Oncol, 83:133138, [24] S Agostinelli et al. Geant4 a simulation toolkit. Nuclear Instruments and Methods in Physics Research, A(506):250303, [25] J. Allison et.al. Geant4 developments and applications. Nuclear Science and IEEE Transactions on, 53(1):270278, Feb [26] J. Apostolakis, M. Asai, A.G. Bogdanov, H. Burkhardt, G. Cosmo, S. Elles, G. Folger, V.M. Grichine, P. Gumplinger, A. Heikkinen, I. Hrivnacova, V.N. Ivantchenko, J. Jacquemier, T. Koi, R.P. Kokoulin, M. Kossov, H. Kurashige, I. McLaren, O. Link, M. Maire, W. Pokorski, T. Sasaki, N. Starkov, L. Urban, and D.H. Wright. Geometry and physics of the geant4 toolkit for high and medium energy applications. Radiation Physics and Chemistry, 78(10): , Workshop on Use of Monte Carlo Techniques for Design and Analysis of Radiation Detectors. 134
145 BIBLIOGRAPHY [27] J.P. Wellisch. Geant4 hadronic physics status and validation for large HEP detectors. Computing in High Energy and Nuclear Physics and La Jolla and California and March 24-28, March [28] JF. Carrier, L. Archambault, and L. Beaulieu. Validation of GEANT4 and an objectoriented Monte Carlo toolkit and for simulations in medical physics. Med Phys, 31(3): , March [29] Emily Poon and Frank Verhaegen. Accuracy of the photon and electron physics in GEANT4 for radiotherapy applications. Med Phys, 32(6): , June [30] A Lechner, M G Pia, and M Sudhakar. Validation of Geant4 low energy physics models against electron energy deposition and backscattering data. IEEE Nuclear Science Symposium Conference Record, 3, [31] I. Pshenichnov, I. Mishustin, and W. Greiner. Comparative study of depthdose distributions for beams of light and heavy nuclei in tissue-like media. Nuclear Instruments and Methods in Physics Research B, 266: , [32] C. O. Thiam, V. Breton, D. Donnarieix, B. Habib, and L. Maigne. Validation of a dose deposited by low-energy photons using gate/geant4. Phys Med Biol, 53(11): , Jun [33] I Pshenichnov, A Botvina, I Mishustin, and W Greiner. Nuclear fragmentation reactions in extended media studied with Geant4 toolkit. Nuclear Instruments and Methods in Physics Research B, 268:604615, [34] C. Zacharatou Jarlskog and H. Paganetti. Physics Settings for Using the Geant4 Toolkit in Proton Therapy. IEEE, 55(3): , June [35] T. T. Böhlen, F. Cerutti, M. Dosanjh, A. Ferrari, I. Gudowska, A. Mairani, and J. M. Quesada. Benchmarking nuclear models of FLUKA and GEANT4 for carbon ion therapy. Phys Med Biol, 55(19): , Oct [36] A Lechner, V N Ivanchenko, and J Knobloch. Validation of recent Geant4 physics models for application in carbon ion therapy. Nuclear Instruments and Methods in Physics Research Section B, 268: , [37] S. Jan, G. Santin, D. Strul, S. Staelens, K. Assié, D. Autret, S. Avner, R. Barbier, M. Bardiès, P. M. Bloomeld, D. Brasse, V. Breton, P. Bruyndonckx, I. Buvat, A. F. Chatziioannou, Y. Choi, Y. H. Chung, C. Comtat, D. Donnarieix, L. Ferrer, S. J. Glick, C. J. Groiselle, D. Guez, P.-F. Honore, S. Kerhoas-Cavata, A. S. Kirov, V. Kohli, M. Koole, M. Krieguer, D. J. van der Laan, F. Lamare, G. Largeron, C. Lartizien, D. Lazaro, M. C. Maas, L. Maigne, F. Mayet, F. Melot, C. Merheb, E. Pennacchio, J. Perez, U. Pietrzyk, F. R. Rannou, M. Rey, D. R. Schaart, C. R. Schmidtlein, L. Simon, T. Y. Song, J.-M. Vieira, D. Visvikis, R. Van de Walle, E. Wieërs, and C. Morel. GATE: a simulation toolkit for PET and SPECT. Physics in Medicine and Biology, 49(19):4543, [38] S. Jan, D. Benoit, E. Becheva, T. Carlier, F. Cassol, P. Descourt, T. Frisson, L. Grevillot, L. Guigues, L. Maigne, C. Morel, Y. Perrot, N. Rehfeld, D. Sarrut, D. R. Schaart, S. Stute, U. Pietrzyk, D. Visvikis, N. Zahra, and I. Buvat. GATE V6: a major enhancement of the GATE simulation platform enabling modelling of CT and radiotherapy. Physics in Medicine and Biology, 56(4):881, [39] David Sarrut and Laurent Guigues. Region-oriented CT image representation for reducing computing time of Monte Carlo simulations. Med Phys, 35(4): , Apr [40] L. Grevillot, T. Frisson, D. Maneval, N. Zahra, J.-N. Badel, and D. Sarrut. Simulation of a 6 MV Elekta Precise Linac photon beam using GATE/GEANT4. Physics in Medicine and Biology, 56(4):903,
146 BIBLIOGRAPHY [41] M. Fippel and M. Soukup. A monte carlo dose calculation algorithm for proton therapy. Med Phys, 31(8): , Aug [42] A. J. Lomax, T. Böhringer, A. Bolsi, D. Coray, F. Emert, G. Goitein, M. Jermann, S. Lin, E. Pedroni, H. Rutz, O. Stadelmann, B. Timmermann, J. Verwey, and D. C. Weber. Treatment planning and verication of proton therapy using spot scanning: initial experiences. Med Phys, 31(11): , Nov [43] U. Amaldi and G. Kraft. Radiotherapy with beams of carbon ions. Rep. Prog. Phys., 68: , [44] A. Lomax. Intensity modulation methods for proton radiotherapy. Phys Med Biol, 44(1):185205, Jan [45] M. Krämer, O Jäkel, T Haberer, G Kraft, D Schardt, and U Weber. Treatment planning for heavy-ion radiotherapy: physical beam model and dose optimization. Phys Med Biol, 45(11): , May [46] M. Soukup, M. Fippel, and M. Alber. A pencil beam algorithm for intensity modulated proton therapy derived from Monte Carlo simulations. Phys Med Biol, 50(21): , Nov [47] F. Bourhaleb, F. Marchetto, A. Attili, G. Pittà, R. Cirio, M. Donetti, S. Giordanengo, N. Givehchi, S. Iliescu, M. Krengli, A. La Rosa, D. Massai, A. Pecka, J. Pardo, and C. Peroni. A treatment planning code for inverse planning and 3d optimization in hadrontherapy. Comput Biol Med, 38(9):990999, Sep [48] A Gemmel, B Hasch, M Ellerbrock, W K Weyrather, and M Krämer. Biological dose optimization with multiple ion elds. Physics in Medicine and Biology, 53: , [49] O. Jäkel, M. Krämer, C. P. Karger, and J. Debus. Treatment planning for heavy ion radiotherapy: clinical implementation and application. Phys Med Biol, 46(4): , Apr [50] P. L. Petti. Dierential-pencil-beam dose calculations for charged particles. Med Phys, 19(1):137149, [51] P. L. Petti. Evaluation of a pencil-beam dose calculation technique for charged particle radiotherapy. Int J Radiat Oncol Biol Phys, 35(5): , Jul [52] B. Schaner, E. Pedroni, and A. Lomax. Dose calculation models for proton treatment planning using a dynamic beam delivery system: an attempt to include density heterogeneity eects in the analytical dose calculation. Phys Med Biol, 44(1):2741, Jan [53] H. Szymanowski, A. Mazal, C. Nauraye, S. Biensan, R. Ferrand, M. C. Murillo, S. Caneva, G. Gaboriaud, and J. C. Rosenwald. Experimental determination and verication of the parameters used in a proton pencil beam algorithm. Med Phys, 28(6):975987, Jun [54] Ryosuke Kohno, Nobuyuki Kanematsu, Tatsuaki Kanai, and Ken Yusa. Evaluation of a pencil beam algorithm for therapeutic carbon ion beam in presence of bolus. Med Phys, 31(8): , Aug [55] N. Kanematsu. Alternative scattering power for Gaussian beam model of heavy charged particles. Nuclear Instruments and Methods in Physics Research Section B: Beam Interactions with Materials and Atoms, 266(23): , [56] Rintaro Fujimoto, Tsuneya Kurihara, and Yoshihiko Nagamine. GPU-based fast pencil beam algorithm for proton therapy. Phys Med Biol, 56(5): , Mar [57] E. Pedroni, S. Scheib, T. Böhringer, A. Coray, M. Grossmann, S. Lin, and A. Lomax. Experimental characterization and physical modelling of the dose distribution of scanned proton pencil beams. Phys Med Biol, 50(3):541561, Feb
147 BIBLIOGRAPHY [58] M. Krämer and M. Scholz. Treatment planning for heavy-ion radiotherapy: calculation and optimization of biologically eective dose. Phys Med Biol, 45(11): , Nov [59] H. Paganetti, H. Jiang, K. Parodi, R. Slopsema, and M. Engelsman. Clinical implementation of full Monte Carlo dose calculation in proton beam therapy. Phys Med Biol, 53(17): , Sep [60] S. W. Peterson, J. Polf, M. Bues, G. Ciangaru, L. Archambault, S. Beddar, and A. Smith. Experimental validation of a Monte Carlo proton therapy nozzle model incorporating magnetically steered protons. Phys Med Biol, 54(10): , May [61] Gabriel O Sawakuchi, Dragan Mirkovic, Luis A Perles, Narayan Sahoo, X. Ron Zhu, George Ciangaru, Kazumichi Suzuki, Michael T Gillin, Radhe Mohan, and Uwe Titt. An MCNPX Monte Carlo model of a discrete spot scanning proton beam therapy nozzle. Med Phys, 37(9): , Sep [62] Katia Parodi, Harald Paganetti, Ethan Cascio, Jacob B Flanz, Ali A Bonab, Nathaniel M Alpert, Kevin Lohmann, and Thomas Bortfeld. PET/CT imaging for treatment verication after proton therapy: a study with plastic phantoms and metallic implants. Med Phys, 34(2):419435, Feb [63] K. Parodi, A. Ferrari, F. Sommerer, and H. Paganetti. Clinical CT-based calculations of dose and positron emitter distributions in proton therapy using the FLUKA Monte Carlo code. Phys Med Biol, 52(12): , Jun [64] S. España, X. Zhu, J. Daartz, G. El Fakhri, T. Bortfeld, and H. Paganetti. The reliability of proton-nuclear interaction cross-section data to predict proton-induced PET images in proton therapy. Phys Med Biol, 56(9): , May [65] M. Moteabbed, S. España, and H. Paganetti. Monte Carlo patient study on the comparison of prompt gamma and PET imaging for range verication in proton therapy. Phys Med Biol, 56(4): , Feb [66] F. Roellingho, M.-H. Richard, M. Chevallier, J. Constanzo, D. Dauvergne, N. Freud, P. Henriquet, F. Le Foulher, J.M. Létang, G. Montarou, C. Ray, E. Testa, M. Testa, and A.H. Walenta. Design of a Compton camera for 3D prompt-gamma imaging during ion beam therapy. Nuclear Instruments and Methods in Physics Research Section A: Accelerators and Spectrometers and Detectors and Associated Equipment, In Press and Corrected Proof:, [67] E. Testa, M. Bajard, M. Chevallier, D. Dauvergne, F. Le Foulher, N. Freud, J.M. Létang, J.C. Poizat, C. Ray, and M. Testa. Dose prole monitoring with carbon ions by means of prompt-gamma measurements. Nuclear Instruments and Methods in Physics Research Section B: Beam Interactions with Materials and Atoms, 267(6): , Proceedings of the Seventh International Symposium on Swift Heavy Ions in Matter. [68] F. Le Foulher, M. Bajard, M. Chevallier, D. Dauvergne, N. Freud, P. Henriquet, S. Karkar, J. M. Létang, L. Lestand, R. Plescak, C. Ray, D. Schardt, E. Testa, and M. Testa. Monte Carlo Simulations of Prompt-Gamma Emission During Carbon Ion Irradiation. IEEE Transactions on Nuclear Science, 57(5), [69] G. W. McKinney, J. W. Durkee, J. S. Hendricks, M. R. James, D. B. Pelowitz,, and L. S. Waters. MCNPX New Features Demonstrated. American Nuclear Society - Topical Meeting in Monte Carlo, [70] Koji Niita, Tatsuhiko Sato, Hiroshi Iwase, Hiroyuki Nose, Hiroshi Nakashima, and Lembit Sihver. PHITSa particle and heavy ion transport code system, Space Radiation Transport and Shielding and and Risk Assessment Models. 137
148 BIBLIOGRAPHY [71] A.V.Dementyev and N.M.Sobolevsky. SHIELD - Universal Monte Carlo Hadron Transport Code: Scope and Applications. Radiation Measurements, 30:553, [72] A Fasso, A Ferrari, S Roesler, P R Sala, F Ballarini, A Ottolenghi, G Battistoni, F Cerutti, E Gadioli, M V Garzelli, A Empl, and J Ranft. The physics models of FLUKA: status and recent developments. Computing in High Energy and Nuclear Physics, 24-28, [73] ICRU. International Commission on Radiation Units and Measurements Report 49: Stopping Powers and Ranges for Protons and Alpha Particles, [74] J. F. Ziegler. The Stopping of Energetic Light Ions in Elemental Matter. J. Appl. Phys / Rev. Appl. Phys., 85: , [75] J.F. Janni. Proton Range-Energy Tables and 1KeV - 10 GeV: Energy Loss and Range and Path Length and Time-of-Flight and Straggling and Multiple Scattering and Nuclear Interaction Probability. Part I: For 63 compounds. Atomic Data and Nuclear Data Tables, 27:147349, [76] M.J. Berger, J.S. Coursey, M.A. Zucker, and J. Chang. Stopping Powers and Ranges for Protons, National Institue of Standards and Technology (NIST). [77] B. Gottschalk. passive beam Spreading in Proton radiation Therapy. Technical report, Harvard High Energy Physics Laboratory, [78] P. Andreo. On the clinical spatial resolution achievable with protons and heavier charged particle radiotherapy beams. Phys Med Biol, 54(11):N205N215, Jun [79] W. H. Bragg and R. Kleeman. On the α particles of radium and their loss of range in passing through various atoms and molecules. Philos. Mag., 10:318340, [80] M.J. Berger, J.S. Coursey, M.A. Zucker, and J. Chang. Stopping Powers and Ranges for Electrons [81] ICRU. International Commission on Radiation Units and Measurements Report 16: Linear Energy Transfer, [82] Thomas Bortfeld. An analytical approximation of the Bragg curve for therapeutic proton beams. Med. Phys., 24:doi: / , [83] B. Gottschalk, A.M. Koehler, R.J. Schneider, J.M. Sisterson, and M.S. Wagner. Multiple Coulomb scattering of 160 MeV protons. Nuclear Instruments and Methods in Physics Research Section B: Beam Interactions with Materials and Atoms, 74(4): , [84] Bernard Gottschalk. On the scattering power of radiotherapy protons. Med Phys, 37(1): , Jan [85] ICRU. International Commission on Radiation Units and Measurements report 63: Nuclear Data for Neutron and Proton Radiotherapy and for Radiation Protection. Journal of the ICRU, [86] H. Palmans and F. Verhaegen. Assigning nonelastic nuclear interaction cross sections to Hounseld units for Monte Carlo treatment planning of proton beams. Phys Med Biol, 50(5): , Mar [87] Gunzert-Marx, K., Iwase, H., Schardt, D., Simon, and R. S. Secondary beam fragments produced by 200 MeV u 1 12C ions in water and their dose contributions in carbon ion radiotherapy. New J. Phys., 10(7): , July [88] T. Elsässer and M. Scholz. Cluster eects within the local eect model. Radiat Res, 167(3):319329, Mar
149 BIBLIOGRAPHY [89] M. Scholz, A. M. Kellerer, W. Kraft-Weyrather, and G. Kraft. Computation of cell survival in heavy ion beams for therapy. The model and its approximation. Radiat Environ Biophys, 36(1):5966, Feb [90] Y Furusawa, K Fukutsu, M Aoki, H Itsukaichi, K Eguchi-Kasai, H Ohara, F Yatagai, T Kanai, and K Ando. Inactivation of aerobic and hypoxic cells from three dierent cell lines by accelerated 3 He-, 12 C- and 20 Ne-ion beams. Radiation Research, 154:485496, [91] G Kraft. Tumor Therapy with Heavy Charged Particles. Progress in Particle and Nuclear Physics, 45:473544, [92] M. Krämer and M. Scholz. Rapid calculation of biological eects in ion radiotherapy. Phys Med Biol, 51(8): , Apr [93] Harald Paganetti, Andrzej Niemierko, Marek Ancukiewicz, Leo E Gerweck, Michael Goitein, Jay S Loeer, and Herman D Suit. Relative biological eectiveness (RBE) values for proton beam therapy. Int J Radiat Oncol Biol Phys, 53(2):407421, Jun [94] G Kraft and S D Kraft. Research needed for improving heavy-ion therapy. New Journal of Physics, 11, [95] D Schardt, T Elsässer, and Schulz-Ertner. Heavy-ion tumor therapy: Physical and radiobiological benets. Reviews of Modern Physics, 82:383425, [96] Taku Inaniwa, Takuji Furukawa, Yuki Kase, Naruhiro Matsufuji, Toshiyuki Toshito, Yoshitaka Matsumoto, Yoshiya Furusawa, and Koji Noda. Treatment planning for a scanned carbon beam with a modied microdosimetric kinetic model. Phys Med Biol, 55(22): , Nov [97] Akiko Uzawa, Koichi Ando, Sachiko Koike, Yoshiya Furusawa, Yoshitaka Matsumoto, Nobuhiko Takai, Ryoichi Hirayama, Masahiko Watanabe, Michael Scholz, Thilo Elsässer, and Peter Peschke. Comparison of biological eectiveness of carbon-ion beams in Japan and Germany. Int J Radiat Oncol Biol Phys, 73(5): , Apr [98] Nabil Zahra, Thibault Frisson, Loïc Grevillot, Philippe Lautesse, and David Sarrut. In- uence of Geant4 parameters on dose distribution and computation time for carbon ion therapy simulation. Physica Medica, 26(4): , [99] Geant4-Collaboration. Physics Reference Manual for Geant4. CERN, [100] Christopher J. Mertens, Michael F. Moyers, Steven A. Walker, and John Tweed. Proton lateral broadening distribution comparisons between GRNTRN and MCNPX and and laboratory beam measurements. Advances in Space Research, 45(7): , Life Sciences in Space. [101] B. Gottschalk, R. Platais, and H. Paganetti. Nuclear interactions of 160 MeV protons stopping in copper: a test of Monte Carlo nuclear models. Med Phys, 26(12): , Dec [102] H. Paganetti and B. Gottschalk. Test of GEANT3 and GEANT4 nuclear models for 160 MeV protons stopping in CH2. Med Phys, 30(7): , Jul [103] K Henkner, N Sobolevsky, O Jäkel, and H Paganetti. Test of the nuclear interaction model in SHIELD-HIT and comparison to energy distributions from GEANT4. Phys Med Biol, 54:509517, [104] I Rinaldi, A Ferrari, A Mairani, H Paganetti, K Parodi, and P Sala. An integral test of FLUKA nuclear models with 160 MeV proton beams in multi-layer Faraday cups. Phys Med Biol, 56: , [105] PSI Graphic Transport Framework by U. Rohrer based on a CERN-SLAC-FERMILAB version by K.L. Brown et al. Transport Manual. 139
150 BIBLIOGRAPHY [106] A. Tourovsky, A. J. Lomax, U. Schneider, and E. Pedroni. Monte carlo dose calculations for spot scanned proton therapy. Phys Med Biol, 50(5):971981, Mar [107] L. Grevillot, T. Frisson, N. Zahra, D. Bertrand, F. Stichelbaut, N. Freud, and D. Sarrut. Optimization of GEANT4 settings for Proton Pencil Beam Scanning simulations using GATE. Nuclear Instruments and Methods in Physics Research Section B: Beam Interactions with Materials and Atoms, 268(20): , [108] L. Grevillot, D. Bertrand, F. Dessy, N. Freud, and D. Sarrut. A Monte Carlo pencil beam scanning model for proton treatment plan simulation using GATE/GEANT4. Physics in Medicine and Biology, 56: , [109] Geant4 Electromagnetic Standard Working Group, [110] H. Paganetti, H. Jiang, S. Y. Lee, and H. M. Kooy. Accurate Monte Carlo simulations for nozzle design and commissioning and quality assurance for a proton radiation therapy facility. Med Phys, 31(7): , Jul [111] J. C. Polf, S. Peterson, M. McCleskey, B. T. Roeder, A. Spiridon, S. Beddar, and L. Trache. Measurement and calculation of characteristic prompt gamma ray spectra emitted during proton irradiation. Phys Med Biol, 54(22):N519N527, Nov [112] ICRU. International Commission on Radiation Units and Measurements report 73: Stopping of Ions Heavier than Helium, [113] D. Schardt, P. Steidl, M. Krmer, U. Weber, K. Parodi, and S. Brons. Precision Bragg-curve measurements for light-ion beams in water. Technical report, GSI and Darmstadt and Germany; Rhn-Klinikum AG and Marburg and Germany; HIT and Heidelberg and Germany, Darmstadt and Germany; Rhn-Klinikum AGDarmstadt and Germany; Rhn-Klinikum AG, [114] F. Rademakers and R. Brun. ROOT: An Object-Oriented Data Analysis Framework. Linux Journal and Issue 51 and July, [115] Harald Paganetti. Dose to water versus dose to medium in proton beam therapy. Phys Med Biol, 54(14): , Jul [116] Bryan Bednarz, Juliane Daartz, and Harald Paganetti. Dosimetric accuracy of planning and delivering small proton therapy elds. Phys Med Biol, 55(24): , Dec [117] S. Camarasu-Pop, T. Glatard, J. Mo±cicki, H. Benoit-Cattin, and D. Sarrut. Dynamic Partitioning of GATE Monte-Carlo Simulations on EGEE. Journal of Grid Computing, 8:241259, /s [118] H. Paganetti. Four-dimensional Monte Carlo simulation of time-dependent geometries. Phys Med Biol, 49(6):N75N81, Mar [119] B. Bednarz, H.-M. Lu, M. Engelsman, and H. Paganetti. Uncertainties and correction methods when modeling passive scattering proton therapy treatment heads with Monte Carlo. Phys Med Biol, 56(9): , May [120] K Parodi, S Brons, F Cerutti, A Ferrari, A Mairani, H Paganetti, and F Sommerer. The FLUKA code for application of Monte Carlo methods to promote high precision ion beam therapy th International Conference on Nuclear Reaction Mechanisms, Villa Monastero, Varenna, Italy. CERN-Proceedings [121] M J Berger. Proton Monte Carlo Transport Program PTRAN. Technical report, National Institute for Standards and Technology Report NISTIR 5113, [122] U. Schneider and E. Pedroni. Proton radiography as a tool for quality control in proton therapy. Med Phys, 22(4):353363, Apr
151 BIBLIOGRAPHY [123] Uwe Schneider, Jürgen Besserer, Peter Pemler, Matthias Dellert, Martin Moosburger, Eros Pedroni, and Barbara Kaser-Hotz. First proton radiography of an animal patient. Med Phys, 31(5): , May [124] Nicolas Depauw and Joao Seco. Sensitivity study of proton radiography and comparison with kv and MV x-ray imaging using GEANT4 Monte Carlo simulations. Phys Med Biol, 56(8): , Apr [125] Gabriel O Sawakuchi, X. Ronald Zhu, Falk Poenisch, Kazumichi Suzuki, George Ciangaru, Uwe Titt, Aman Anand, Radhe Mohan, Michael T Gillin, and Narayan Sahoo. Experimental characterization of the low-dose envelope of spot scanning proton beams. Phys Med Biol, 55(12): , Jun [126] W. Schneider, T. Bortfeld, and W. Schlegel. Correlation between CT numbers and tissue parameters needed for Monte Carlo simulations of clinical dose distributions. Phys Med Biol, 45(2):459478, Feb
Monte Carlo simulation of active scanning proton therapy system with Gate/Geant4:
 Institut National des Sciences Appliquées de Lyon Ecole Doctorale : Electronique, Electrotechnique et Automatique THESE DE DOCTORAT Présentée et soutenue publiquement par : M. Loïc Grevillot le 14 Octobre
Natixis Asset Management Response to the European Commission Green Paper on shadow banking
 European Commission DG MARKT Unit 02 Rue de Spa, 2 1049 Brussels Belgium [email protected] 14 th June 2012 Natixis Asset Management Response to the European Commission Green
Exemple PLS avec SAS
 Exemple PLS avec SAS This example, from Umetrics (1995), demonstrates different ways to examine a PLS model. The data come from the field of drug discovery. New drugs are developed from chemicals that
Instructions Mozilla Thunderbird Page 1
 Instructions Mozilla Thunderbird Page 1 Instructions Mozilla Thunderbird Ce manuel est écrit pour les utilisateurs qui font déjà configurer un compte de courrier électronique dans Mozilla Thunderbird et
APPENDIX 6 BONUS RING FORMAT
 #4 EN FRANÇAIS CI-DESSOUS Preamble and Justification This motion is being presented to the membership as an alternative format for clubs to use to encourage increased entries, both in areas where the exhibitor
Application Form/ Formulaire de demande
 Application Form/ Formulaire de demande Ecosystem Approaches to Health: Summer Workshop and Field school Approches écosystémiques de la santé: Atelier intensif et stage d été Please submit your application
Comprendre l impact de l utilisation des réseaux sociaux en entreprise SYNTHESE DES RESULTATS : EUROPE ET FRANCE
 Comprendre l impact de l utilisation des réseaux sociaux en entreprise SYNTHESE DES RESULTATS : EUROPE ET FRANCE 1 Objectifs de l étude Comprendre l impact des réseaux sociaux externes ( Facebook, LinkedIn,
CEPF FINAL PROJECT COMPLETION REPORT
 CEPF FINAL PROJECT COMPLETION REPORT I. BASIC DATA Organization Legal Name: Conservation International Madagascar Project Title (as stated in the grant agreement): Knowledge Management: Information & Monitoring.
Face Recognition Performance: Man vs. Machine
 1 Face Recognition Performance: Man vs. Machine Andy Adler Systems and Computer Engineering Carleton University, Ottawa, Canada Are these the same person? 2 3 Same person? Yes I have just demonstrated
RISK-BASED TRANSPORTATION PLANNING PRACTICE: OVERALL METIIODOLOGY AND A CASE EXAMPLE"' RESUME
 RISK-BASED TRANSPORTATION PLANNING PRACTICE: OVERALL METIIODOLOGY AND A CASE EXAMPLE"' ERTUGRULALP BOVAR-CONCORD Etwiromnental, 2 Tippet Rd. Downsviel+) ON M3H 2V2 ABSTRACT We are faced with various types
Deadline(s): Assignment: in week 8 of block C Exam: in week 7 (oral exam) and in the exam week (written exam) of block D
: Assignment: in week 8 of block C Exam: in week 7 (oral exam) and in the exam week (written exam) of block D") ICM STUDENT MANUAL French 2 JIC-FRE2.2V-12 Module Change Management and Media Research Study Year 2 1. Course overview Books: Français.com, niveau intermédiaire, livre d élève+ dvd- rom, 2ième édition,
ICM STUDENT MANUAL French 2 JIC-FRE2.2V-12 Module Change Management and Media Research Study Year 2 1. Course overview Books: Français.com, niveau intermédiaire, livre d élève+ dvd- rom, 2ième édition,
SMALL CITY COMMERCE (EL PEQUEÑO COMERCIO DE LAS PEQUEÑAS CIUDADES)
") CIUDADES) ES/08/LLP-LdV/TOI/149019 1 Project Information Title: Project Number: SMALL CITY COMMERCE (EL PEQUEÑO COMERCIO DE LAS PEQUEÑAS CIUDADES) ES/08/LLP-LdV/TOI/149019 Year: 2008 Project Type: Status:
CIUDADES) ES/08/LLP-LdV/TOI/149019 1 Project Information Title: Project Number: SMALL CITY COMMERCE (EL PEQUEÑO COMERCIO DE LAS PEQUEÑAS CIUDADES) ES/08/LLP-LdV/TOI/149019 Year: 2008 Project Type: Status:
NOM ENTREPRISE. Document : Plan Qualité Spécifique du Projet / Project Specific Quality Plan
 Document : Plan Qualité Spécifique du Projet Project Specific Quality Plan Référence Reference : QP-3130-Rev 01 Date Date : 12022008 Nombre de Pages Number of Pages : 6 Projet Project : JR 100 Rédacteur
Le passé composé. C'est le passé! Tout ça c'est du passé! That's the past! All that's in the past!
 > Le passé composé le passé composé C'est le passé! Tout ça c'est du passé! That's the past! All that's in the past! «Je suis vieux maintenant, et ma femme est vieille aussi. Nous n'avons pas eu d'enfants.
Institut français des sciences et technologies des transports, de l aménagement
 Institut français des sciences et technologies des transports, de l aménagement et des réseaux Session 3 Big Data and IT in Transport: Applications, Implications, Limitations Jacques Ehrlich/IFSTTAR h/ifsttar
INSTITUT MARITIME DE PREVENTION. For improvement in health and security at work. Created in 1992 Under the aegis of State and the ENIM
 INSTITUT MARITIME DE PREVENTION For improvement in health and security at work Created in 1992 Under the aegis of State and the ENIM Maritime fishing Shellfish-farming Sea transport 2005 Le pilier social
Nouveautés printemps 2013
 » English Se désinscrire de la liste Nouveautés printemps 2013 19 mars 2013 Dans ce Flash Info, vous trouverez une description des nouveautés et mises à jour des produits La Capitale pour le printemps
Dans une agence de location immobilière...
 > Dans une agence de location immobilière... In a property rental agency... dans, pour et depuis vocabulaire: «une location» et «une situation» Si vous voulez séjourner à Lyon, vous pouvez louer un appartement.
Editing and managing Systems engineering processes at Snecma
 Editing and managing Systems engineering processes at Snecma Atego workshop 2014-04-03 Ce document et les informations qu il contient sont la propriété de Ils ne doivent pas être copiés ni communiqués
Quatre axes au service de la performance et des mutations Four lines serve the performance and changes
 Le Centre d Innovation des Technologies sans Contact-EuraRFID (CITC EuraRFID) est un acteur clé en matière de l Internet des Objets et de l Intelligence Ambiante. C est un centre de ressources, d expérimentations
Object Oriented Parallel Discrete Event Simulation: The PROSIT Approach
 INSTITUT NATIONAL DE RECHERCHE EN INFORMATIQUE ET AUTOMATIQUE Object Oriented Parallel Discrete Event Simulation: The PROSIT Approach Lionel Mallet and Philippe Mussi N 2232 Avril 1994 PROGRAMME 1 Architectures
Consultants en coûts - Cost Consultants
 Respecter l échéancier et le budget est-ce possible? On time, on budget is it possible? May, 2010 Consultants en coûts - Cost Consultants Boulletin/Newsletter Volume 8 Mai ( May),2010 1 866 694 6494 [email protected]
Forthcoming Database
 DISS.ETH NO. 15802 Forthcoming Database A Framework Approach for Data Visualization Applications A dissertation submitted to the SWISS FEDERAL INSTITUTE OF TECHNOLOGY ZURICH for the degree of Doctor of
Discours du Ministre Tassarajen Pillay Chedumbrum. Ministre des Technologies de l'information et de la Communication (TIC) Worshop on Dot.
 Worshop on Dot.") Discours du Ministre Tassarajen Pillay Chedumbrum Ministre des Technologies de l'information et de la Communication (TIC) Worshop on Dot.Mu Date: Jeudi 12 Avril 2012 L heure: 9h15 Venue: Conference Room,
Discours du Ministre Tassarajen Pillay Chedumbrum Ministre des Technologies de l'information et de la Communication (TIC) Worshop on Dot.Mu Date: Jeudi 12 Avril 2012 L heure: 9h15 Venue: Conference Room,
Lean approach on production lines Oct 9, 2014
 Oct 9, 2014 Dassault Mérignac 1 Emmanuel Théret Since sept. 2013 : Falcon 5X FAL production engineer 2011-2013 : chief project of 1st lean integration in Merignac plant 2010 : Falcon 7X FAL production
POSITION DESCRIPTION DESCRIPTION DE TRAVAIL
 Supervisor Titre du poste de la superviseure ou du superviseur : Coordinator, Communications & Political Action & Campaigns Coordonnatrice ou coordonnateur de la Section des communications et de l action
MANAGEMENT SOFTWARE FOR STEEL CONSTRUCTION
 Ficep Group Company MANAGEMENT SOFTWARE FOR STEEL CONSTRUCTION KEEP ADVANCING " Reach your expectations " ABOUT US For 25 years, Steel Projects has developed software for the steel fabrication industry.
Revision of hen1317-5: Technical improvements
 Revision of hen1317-5: Technical improvements Luca Felappi Franz M. Müller Project Leader Road Safety Consultant AC&CS-CRM Group GDTech S.A., Liège Science Park, rue des Chasseurs-Ardennais, 7, B-4031
Eléments de statistique
 Eléments de statistique L. Wehenkel Cours du 9/12/2014 Méthodes multivariées; applications & recherche Quelques méthodes d analyse multivariée NB: illustration sur base de la BD résultats de probas en
Contents Windows 8.1... 2
 Workaround: Installation of IRIS Devices on Windows 8 Contents Windows 8.1... 2 English Français Windows 8... 13 English Français Windows 8.1 1. English Before installing an I.R.I.S. Device, we need to
Quick Start Guide This guide is intended to get you started with Rational ClearCase or Rational ClearCase MultiSite.
 Rational ClearCase or ClearCase MultiSite Version 7.0.1 Quick Start Guide This guide is intended to get you started with Rational ClearCase or Rational ClearCase MultiSite. Product Overview IBM Rational
The new consumables catalogue from Medisoft is now updated. Please discover this full overview of all our consumables available to you.
 General information 120426_CCD_EN_FR Dear Partner, The new consumables catalogue from Medisoft is now updated. Please discover this full overview of all our consumables available to you. To assist navigation
Syllabus Dossiers d études
 Syllabus Dossiers d études General Course Details: Course No.: IBU 4090 Title: Dossiers d études Language: French Credits: ECTS 5 (1,5 weekly contact hours) Level: Advanced (Bachelor 6 th semester) Sessions:
RÉSUMÉ DE THÈSE. L implantation des systèmes d'information (SI) organisationnels demeure une tâche difficile
 organisationnels demeure une tâche difficile") RÉSUMÉ DE THÈSE L implantation des systèmes d'information (SI) organisationnels demeure une tâche difficile avec des estimations de deux projets sur trois peinent à donner un résultat satisfaisant (Nelson,
RÉSUMÉ DE THÈSE L implantation des systèmes d'information (SI) organisationnels demeure une tâche difficile avec des estimations de deux projets sur trois peinent à donner un résultat satisfaisant (Nelson,
UML : Unified Modeling Language
 UML : Unified Modeling Language Recommended: UML distilled A brief guide to the standard Object Modeling Language Addison Wesley based on Frank Maurer lecture, Univ. of Calgary in french : uml.free.fr/index.html
THE EVOLUTION OF CONTENT CONSUMPTION ON MOBILE AND TABLETS
 THE EVOLUTION OF CONTENT CONSUMPTION ON MOBILE AND TABLETS OPPA investigated in March 2013 its members, in order to design a clear picture of the traffic on all devices, browsers and apps. One year later
Frequently Asked Questions
 GS1 Canada-1WorldSync Partnership Frequently Asked Questions 1. What is the nature of the GS1 Canada-1WorldSync partnership? GS1 Canada has entered into a partnership agreement with 1WorldSync for the
Présentation par François Keller Fondateur et président de l Institut suisse de brainworking et M. Enga Luye, CEO Belair Biotech
 Présentation par François Keller Fondateur et président de l Institut suisse de brainworking et M. Enga Luye, CEO Belair Biotech Le dispositif L Institut suisse de brainworking (ISB) est une association
An Ontology-Based Approach for Closed-Loop Product Lifecycle Management
 An Ontology-Based Approach for Closed-Loop Product Lifecycle Management THÈSE N O 4823 (2010) PRÉSENTÉE LE 15 OCTOBRE 2010 À LA FACULTÉ SCIENCES ET TECHNIQUES DE L'INGÉNIEUR LABORATOIRE DES OUTILS INFORMATIQUES
COUNCIL OF THE EUROPEAN UNION. Brussels, 18 September 2008 (19.09) (OR. fr) 13156/08 LIMITE PI 53
 (OR. fr) 13156/08 LIMITE PI 53") COUNCIL OF THE EUROPEAN UNION Brussels, 18 September 2008 (19.09) (OR. fr) 13156/08 LIMITE PI 53 WORKING DOCUMENT from : Presidency to : delegations No prev. doc.: 12621/08 PI 44 Subject : Revised draft
COUNCIL OF THE EUROPEAN UNION Brussels, 18 September 2008 (19.09) (OR. fr) 13156/08 LIMITE PI 53 WORKING DOCUMENT from : Presidency to : delegations No prev. doc.: 12621/08 PI 44 Subject : Revised draft
How to Login to Career Page
 How to Login to Career Page BASF Canada July 2013 To view this instruction manual in French, please scroll down to page 16 1 Job Postings How to Login/Create your Profile/Sign Up for Job Posting Notifications
Règlement sur le télémarketing et les centres d'appel. Call Centres Telemarketing Sales Regulation
 THE CONSUMER PROTECTION ACT (C.C.S.M. c. C200) Call Centres Telemarketing Sales Regulation LOI SUR LA PROTECTION DU CONSOMMATEUR (c. C200 de la C.P.L.M.) Règlement sur le télémarketing et les centres d'appel
EN UNE PAGE PLAN STRATÉGIQUE
 EN UNE PAGE PLAN STRATÉGIQUE PLAN STRATÉGIQUE EN UNE PAGE Nom de l entreprise Votre nom Date VALEUR PRINCIPALES/CROYANCES (Devrait/Devrait pas) RAISON (Pourquoi) OBJECTIFS (- AN) (Où) BUT ( AN) (Quoi)
This is a preview - click here to buy the full publication NORME INTERNATIONALE INTERNATIONAL STAN DARD. Telecontrol equipment and systems
 NORME INTERNATIONALE INTERNATIONAL STAN DARD CEI IEC 870-3 Première édition First edition 1989-03 Matériels et systèmes de téléconduite Troisième partie: Interfaces (caractéristiques électriques) Telecontrol
Qualité de la conception de tests logiciels : plate-forme de conception et processus de test
 Ecole Doctorale en Sciences de l Ingénieur de l ECP Formation doctorale en Génie Industriel Qualité de la conception de tests logiciels : plate-forme de conception et processus de test Quality of the design
SCHOLARSHIP ANSTO FRENCH EMBASSY (SAFE) PROGRAM 2015-2 APPLICATION FORM
 PROGRAM 2015-2 APPLICATION FORM") SCHOLARSHIP ANSTO FRENCH EMBASSY (SAFE) PROGRAM 2015-2 APPLICATION FORM APPLICATION FORM / FORMULAIRE DE CANDIDATURE Note: If there is insufficient space to answer a question, please attach additional
SCHOLARSHIP ANSTO FRENCH EMBASSY (SAFE) PROGRAM 2015-2 APPLICATION FORM APPLICATION FORM / FORMULAIRE DE CANDIDATURE Note: If there is insufficient space to answer a question, please attach additional
iqtool - Outil e-learning innovateur pour enseigner la Gestion de Qualité au niveau BAC+2
 iqtool - Outil e-learning innovateur pour enseigner la Gestion de Qualité au niveau BAC+2 134712-LLP-2007-HU-LEONARDO-LMP 1 Information sur le projet iqtool - Outil e-learning innovateur pour enseigner
Notice Technique / Technical Manual
 Contrôle d accès Access control Encodeur USB Mifare ENCOD-USB-AI Notice Technique / Technical Manual SOMMAIRE p.2/10 Sommaire Remerciements... 3 Informations et recommandations... 4 Caractéristiques techniques...
INDIVIDUALS AND LEGAL ENTITIES: If the dividends have not been paid yet, you may be eligible for the simplified procedure.
 Recipient s name 5001-EN For use by the foreign tax authority CALCULATION OF WITHHOLDING TAX ON DIVIDENDS Attachment to Form 5000 12816*01 INDIVIDUALS AND LEGAL ENTITIES: If the dividends have not been
Support Orders and Support Provisions (Banks and Authorized Foreign Banks) Regulations
 Regulations") CANADA CONSOLIDATION CODIFICATION Support Orders and Support Provisions (Banks and Authorized Foreign Banks) Regulations Règlement sur les ordonnances alimentaires et les dispositions alimentaires (banques
CANADA CONSOLIDATION CODIFICATION Support Orders and Support Provisions (Banks and Authorized Foreign Banks) Regulations Règlement sur les ordonnances alimentaires et les dispositions alimentaires (banques
La solution idéale de personnalisation interactive sur internet
 FACTORY121 Product Configurator (summary) La solution idéale de personnalisation interactive sur internet FACTORY121 cité comme référence en «Mass Customization» au MIT et sur «mass-customization.de» Specifications
First Nations Assessment Inspection Regulations. Règlement sur l inspection aux fins d évaluation foncière des premières nations CONSOLIDATION
 CANADA CONSOLIDATION CODIFICATION First Nations Assessment Inspection Regulations Règlement sur l inspection aux fins d évaluation foncière des premières nations SOR/2007-242 DORS/2007-242 Current to September
Le projet WIKIWATER The WIKIWATER project
 Le projet WIKIWATER The WIKIWATER project Eau et assainissement pour tous Water and sanitation for all Faire connaitre facilement les moyens techniques, financiers, éducatifs ou de gouvernance pour faciliter
Marie Curie Individual Fellowships. Jean Provost Marie Curie Postdoctoral Fellow, Institut Langevin, ESCPI, INSERM, France
 Marie Curie Individual Fellowships Jean Provost Marie Curie Postdoctoral Fellow, Institut Langevin, ESCPI, INSERM, France Deux Soumissions de Projet Marie Curie International Incoming Fellowship Finance
Consultation Report / Rapport de consultation REGDOC-2.3.3, Periodic Safety Reviews / Bilans périodiques de la sûreté
 Consultation Report / Rapport de consultation REGDOC-2.3.3, Periodic Safety Reviews / Bilans périodiques de la sûreté Introduction Regulatory document REGDOC-2.3.3, Periodic Safety Reviews, sets out the
Paxton. ins-20605. Net2 desktop reader USB
 Paxton ins-20605 Net2 desktop reader USB 1 3 2 4 1 2 Desktop Reader The desktop reader is designed to sit next to the PC. It is used for adding tokens to a Net2 system and also for identifying lost cards.
1.The pronouns me, te, nous, and vous are object pronouns.
 1.The pronouns me, te, nous, and vous are object pronouns.! Marie t invite au théâtre?!! Oui, elle m invite au théâtre.! Elle te parle au téléphone?!! Oui, elle me parle au téléphone.! Le prof vous regarde?!!!
NORME INTERNATIONALE INTERNATIONAL STANDARD. Dispositifs à semiconducteurs Dispositifs discrets. Semiconductor devices Discrete devices
 NORME INTERNATIONALE INTERNATIONAL STANDARD CEI IEC 747-6-3 QC 750113 Première édition First edition 1993-11 Dispositifs à semiconducteurs Dispositifs discrets Partie 6: Thyristors Section trois Spécification
Instructions pour mettre à jour un HFFv2 v1.x.yy v2.0.00
 Instructions pour mettre à jour un HFFv2 v1.x.yy v2.0.00 HFFv2 1. OBJET L accroissement de la taille de code sur la version 2.0.00 a nécessité une évolution du mapping de la flash. La conséquence de ce
THÈSE. présentée à TÉLÉCOM PARISTECH. pour obtenir le grade de. DOCTEUR de TÉLÉCOM PARISTECH. Mention Informatique et Réseaux. par.
 École Doctorale d Informatique, Télécommunications et Électronique de Paris THÈSE présentée à TÉLÉCOM PARISTECH pour obtenir le grade de DOCTEUR de TÉLÉCOM PARISTECH Mention Informatique et Réseaux par
Agile&:&de&quoi&s agit0il&?&
 Association Nationale des Directeurs des Systèmes d Information &:&de&quoi&s agit0il&?& Pierre Delort, Président, Association Nationale des DSI http://www.andsi.fr/tag/delort/ Document confidentiel Ne
Stratégie DataCenters Société Générale Enjeux, objectifs et rôle d un partenaire comme Data4
 Stratégie DataCenters Société Générale Enjeux, objectifs et rôle d un partenaire comme Data4 Stéphane MARCHINI Responsable Global des services DataCenters Espace Grande Arche Paris La Défense SG figures
Don't put socks on the Hippopotamus. Bill BELT Emmanuel DE RYCKEL
 Don't put socks on the Hippopotamus Bill BELT Emmanuel DE RYCKEL BEECHFIELD ASSOCIATES 2009 or you will screw up your Supply Chain. BEECHFIELD ASSOCIATES 2009 HIPPO ATTITUDE - inappropriate behavior -
IDENTITÉ DE L ÉTUDIANT / APPLICANT INFORMATION
 vice Direction des Partenariats Internationaux Pôle Mobilités Prrogrramme de bourrses Intterrnattiionalles en Mastterr (MIEM) Intterrnattiionall Mastterr Schollarrshiip Prrogrramme Sorrbonne Parriis Ciitté
Package Contents. System Requirements. Before You Begin
 Package Contents DWA-125 Wireless 150 USB Adapter CD-ROM (contains software, drivers, and manual) Cradle If any of the above items are missing, please contact your reseller. System Requirements A computer
Township of Russell: Recreation Master Plan Canton de Russell: Plan directeur de loisirs
 Township of Russell: Recreation Master Plan Canton de Russell: Plan directeur de loisirs Project Introduction and Stakeholder Consultation Introduction du projet et consultations publiques Agenda/Aperçu
PROFESSOR. Masters in Development (MDEV)
") Masters in Development (MDEV) Academic year 2014-2015 Strategic Project Management: Preparation, Actor Analysis and Implementation for development projects/gestion stratégique de projets de développement:
Masters in Development (MDEV) Academic year 2014-2015 Strategic Project Management: Preparation, Actor Analysis and Implementation for development projects/gestion stratégique de projets de développement:
ETABLISSEMENT D ENSEIGNEMENT OU ORGANISME DE FORMATION / UNIVERSITY OR COLLEGE:
 8. Tripartite internship agreement La présente convention a pour objet de définir les conditions dans lesquelles le stagiaire ci-après nommé sera accueilli dans l entreprise. This contract defines the
RAPID 3.34 - Prenez le contrôle sur vos données
 RAPID 3.34 - Prenez le contrôle sur vos données Parmi les fonctions les plus demandées par nos utilisateurs, la navigation au clavier et la possibilité de disposer de champs supplémentaires arrivent aux
that the child(ren) was/were in need of protection under Part III of the Child and Family Services Act, and the court made an order on
 was/were in need of protection under Part III of the Child and Family Services Act, and the court made an order on") ONTARIO Court File Number at (Name of court) Court office address Applicant(s) (In most cases, the applicant will be a children s aid society.) Full legal name & address for service street & number, municipality,
ONTARIO Court File Number at (Name of court) Court office address Applicant(s) (In most cases, the applicant will be a children s aid society.) Full legal name & address for service street & number, municipality,
Syllabus (English Version see page 4) PROFESSOR. Interdisicplinary Programme (MDEV and MIA)
 PROFESSOR. Interdisicplinary Programme (MDEV and MIA)") Interdisicplinary Programme (MDEV and MIA) Academic year 2014-2015 Strategic Project Management: Monitoring and Evaluation/Gestion stratégique de projets de développement: Suivi et évaluation MINT011 -
Interdisicplinary Programme (MDEV and MIA) Academic year 2014-2015 Strategic Project Management: Monitoring and Evaluation/Gestion stratégique de projets de développement: Suivi et évaluation MINT011 -
Projet de réorganisation des activités de T-Systems France
 Informations aux medias Saint-Denis, France, 13 Février 2013 Projet de réorganisation des activités de T-Systems France T-Systems France a présenté à ses instances représentatives du personnel un projet
Mon Service Public - Case study and Mapping to SAML/Liberty specifications. Gaël Gourmelen - France Telecom 23/04/2007
 Mon Service Public - Case study and Mapping to SAML/Liberty specifications Gaël Gourmelen - France Telecom 23/04/2007 Agenda Brief presentation of the "Mon Service Public" project (main features) Detailed
Tier 1 / Tier 2 relations: Are the roles changing?
 Tier 1 / Tier 2 relations: Are the roles changing? Alexandre Loire A.L.F.A Project Manager July, 5th 2007 1. Changes to roles in customer/supplier relations a - Distribution Channels Activities End customer
Networking Solutions. Worldwide VSAT Maintenance VSAT dans le Monde Entretien. Satellite Communications Les Communications par Satellite
 www.dcs-eg.com DCS TELECOM SAE is an Egyptian based Information Technology System Integrator company specializes in tailored solutions and integrated advanced systems, while also excelling at consulting
I. COORDONNÉES PERSONNELLES / PERSONAL DATA
 DOSSIER DE CANDIDATUREAPPLICATION FORM 2012 Please tick the admission session of your choice FévrierFebruary SeptembreSeptember MASTER OF ART (Mention the subject) MASTER OF SCIENCE (Mention the subject)
RULE 5 - SERVICE OF DOCUMENTS RÈGLE 5 SIGNIFICATION DE DOCUMENTS. Rule 5 / Règle 5
 RULE 5 - SERVICE OF DOCUMENTS General Rules for Manner of Service Notices of Application and Other Documents 5.01 (1) A notice of application or other document may be served personally, or by an alternative
TABLE DES MATIERES A OBJET PROCEDURE DE CONNEXION
 1 12 rue Denis Papin 37300 JOUE LES TOURS Tel: 02.47.68.34.00 Fax: 02.47.68.35.48 www.herve consultants.net contacts@herve consultants.net TABLE DES MATIERES A Objet...1 B Les équipements et pré-requis...2
Contrôle d'accès Access control. Notice technique / Technical Manual
 p.1/18 Contrôle d'accès Access control INFX V2-AI Notice technique / Technical Manual p.2/18 Sommaire / Contents Remerciements... 3 Informations et recommandations... 4 Caractéristiques techniques... 5
INSTRUMENTS DE MESURE SOFTWARE. Management software for remote and/or local monitoring networks
 INSTRUMENTS DE MESURE SOFTWARE SOFTWARE Logiciel de supervision des réseaux locaux et/ou distants Management software for remote and/or local monitoring networks MIDAs EVO 4 niveaux de fonctionnalités
Small Businesses support Senator Ringuette s bill to limit credit card acceptance fees
 For Immediate Release October 10, 2014 Small Businesses support Senator Ringuette s bill to limit credit card acceptance fees The Senate Standing Committee on Banking, Trade, and Commerce resumed hearings
L. Obert, T. Lascar, A. Adam
 Améliorer la consolidation des tubérosités grâce au système OMS (Offset Modular System) et l autogreffe Improving tuberosity consolidation using the OMS system (Offset Modular System) L. Obert, T. Lascar,
8. Cours virtuel Enjeux nordiques / Online Class Northern Issues Formulaire de demande de bourse / Fellowship Application Form
 F-8a-v1 1 / 7 8. Cours virtuel Enjeux nordiques / Online Class Northern Issues Formulaire de demande de bourse / Fellowship Application Form Nom de famille du candidat Langue de correspondance Français
Le Cloud Computing est-il l ennemi de la Sécurité?
 Le Cloud Computing est-il l ennemi de la Sécurité? Eric DOMAGE Program manager IDC WE Security products & Solutions Copyright IDC. Reproduction is forbidden unless authorized. All rights reserved. Quelques
accidents and repairs:
 accidents and repairs: putting the pieces together accidents et réparations : réunir le tout nobody can repair your Toyota like Toyota Unfortunately, accidents do happen. And the best way to restore your
PRACTICE DIRECTION ON THE LENGTH OF BRIEFS AND MOTIONS ON APPEAL
 Tribunal pénal international pour le Rwanda International Criminal Tribunal for Rwanda PRACTICE DIRECTION ON THE LENGTH OF BRIEFS AND MOTIONS ON APPEAL INTRODUCTION In accordance with Rule 107bis of the
Utiliser une WebCam. Micro-ordinateurs, informations, idées, trucs et astuces
 Micro-ordinateurs, informations, idées, trucs et astuces Utiliser une WebCam Auteur : François CHAUSSON Date : 8 février 2008 Référence : utiliser une WebCam.doc Préambule Voici quelques informations utiles
EU- Luxemburg- WHO Universal Health Coverage Partnership:
 EU- Luxemburg- WHO Universal Health Coverage Partnership: Supporting policy dialogue on national health policies, strategies and plans and universal coverage Year 2 Report Jan. 2013 - - Dec. 2013 [Version
POLICY: FREE MILK PROGRAM CODE: CS-4
 POLICY: FREE MILK PROGRAM CODE: CS-4 Origin: Authority: Reference(s): Community Services Department Cafeteria Services and Nutrition Education Division Resolution #86-02-26-15B.1 POLICY STATEMENT All elementary
&KQBOFJ"UB@RQFSBP0. Notre métier: «offrir aux entreprises la possibilité. d accéder de façon temporaire à des. cadres supérieurs, rapidement, sans
 &KQBOFJ"UB@RQFSBP0 Our Business: the temporary provision of additional senior management resources, when and where they are needed, without long- term obligations, at an optimal cost Notre métier: «offrir
CLIQUEZ ET MODIFIEZ LE TITRE
 IUFRO International Congress, Nice 2015 Global challenges of air pollution and climate change to the public forest management in France Cliquez pour modifier le style des sous-titres du masque Manuel Nicolas
Bourses d excellence pour les masters orientés vers la recherche
 Masters de Mathématiques à l'université Lille 1 Mathématiques Ingénierie Mathématique Mathématiques et Finances Bourses d excellence pour les masters orientés vers la recherche Mathématiques appliquées
Analysis of Water Transport in Polymer Electrolyte Fuel Cells using Neutron Imaging
 DISS. ETH NO. 20548 Analysis of Water Transport in Polymer Electrolyte Fuel Cells using Neutron Imaging A dissertation submitted to ETH ZURICH for the degree of Doctor of Sciences presented by Pierre Oberholzer
Integrated Music Education: Challenges for Teaching and Teacher Training Presentation of a Book Project
 Integrated Music Education: Challenges for Teaching and Teacher Training Presentation of a Book Project L enseignement intégré de la musique: Un défi pour l enseignement et la formation des enseignants
BNP Paribas Personal Finance
 BNP Paribas Personal Finance Financially fragile loan holder prevention program CUSTOMERS IN DIFFICULTY: QUICKER IDENTIFICATION MEANS BETTER SUPPORT Brussels, December 12th 2014 Why BNPP PF has developed
Lesson Plan Physical Descriptions. belle vieille grande petite grosse laide mignonne jolie. beau vieux grand petit gros laid mignon
 Lesson Plan Physical Descriptions Objective: Students will comprehend and describe the physical appearance of others. Vocabulary: Elle est Il est Elle/Il est Elle/Il a les cheveux belle vieille grande
Improving the breakdown of the Central Credit Register data by category of enterprises
 Improving the breakdown of the Central Credit Register data by category of enterprises Workshop on Integrated management of micro-databases Deepening business intelligence within central banks statistical
Mise en place d un système de cabotage maritime au sud ouest de l Ocean Indien. 10 Septembre 2012
 Mise en place d un système de cabotage maritime au sud ouest de l Ocean Indien 10 Septembre 2012 Les défis de la chaine de la logistique du transport maritime Danielle T.Y WONG Director Logistics Performance
CONVENTION DE STAGE TYPE STANDART TRAINING CONTRACT
 CONVENTION DE STAGE TYPE STANDART TRAINING CONTRACT La présente convention a pour objet de définir les conditions dans lesquelles le stagiaire ci-après nommé sera accueilli dans l entreprise. This contract