Université de Montréal. Hématopoïétique. par Eric Deneault. Programme de biologie moléculaire Faculté de médecine. Novembre 2012
|
|
|
- Corinne Marie-Madeleine Champagne
- il y a 8 ans
- Total affichages :
Transcription
1

2 Université de Montréal Activité des Cellules Souches: Identification de Nouveaux Effecteurs dans le Système Hématopoïétique par Eric Deneault Programme de biologie moléculaire Faculté de médecine Thèse présentée à la Faculté de médecine en vue de l obtention du grade de Docteur en biologie moléculaire Novembre 2012 Eric Deneault, 2012

3 Université de Montréal Faculté de médecine Cette thèse intitulée : Activité des Cellules Souches: Identification de Nouveaux Effecteurs dans le Système Hématopoïétique présentée par : Eric Deneault a été évaluée par un jury composé des personnes suivantes : Sylvie Mader, Présidente-rapporteure Guy Sauvageau, Directeur de recherche Tarik Möröy, Membre du jury Zhu Chen, Examinateur externe Richard Bertrand, Représentant du doyen

4 iii RÉSUMÉ Les cellules souches somatiques présentent habituellement un comportement très différent des cellules souches pluripotentes. Les bases moléculaires de l auto-renouvellement des cellules souches embryonnaires ont été récemment déchiffrées grâce à la facilité avec laquelle nous pouvons maintenant les purifier et les maintenir en culture durant de longues périodes de temps. Par contre, il en va tout autrement pour les cellules souches hématopoïétiques. Dans le but d en apprendre davantage sur le fonctionnement moléculaire de l auto-renouvellement des cellules souches hématopoïétiques, j ai d abord conçu une nouvelle méthode de criblage gain-de-fonction qui répond aux caprices particuliers de ces cellules. Partant d une liste de plus de 700 facteurs nucléaires et facteurs de division asymétrique candidats, j ai identifié 24 nouveaux facteurs qui augmentent l activité des cellules souches hématopoïétiques lorsqu ils sont surexprimés. J ai par la suite démontré que neuf de ces facteurs agissent de manière extrinsèque aux cellules souches hématopoïétiques, c est-à-dire que l effet provient des cellules nourricières modifiées en co-culture. J ai également mis à jour un nouveau réseau de régulation de transcription qui implique cinq des facteurs identifiés, c est-à-dire PRDM16, SPI1, KLF10, FOS et TFEC. Ce réseau ressemble étrangement à celui soutenant l ostéoclastogénèse. Ces résultats soulèvent l hypothèse selon laquelle les ostéoclastes pourraient aussi faire partie de la niche fonctionnelle des cellules souches hématopoïétiques dans la moelle osseuse. De plus, j ai identifié un second réseau de régulation impliquant SOX4, SMARCC1 et plusieurs facteurs identifiés précédemment dans le laboratoire, c est-à-dire BMI1, MSI2 et KDM5B. D autre part, plusieurs indices accumulés tendent à démontrer qu il existe des différences fondamentales entre le fonctionnement des cellules souches hématopoïétiques murines et humaines. Mots-clés : criblage fonctionnel, surexpression génétique, cellule souche hématopoïétique, auto-renouvellement, expansion extrinsèque, niche, réseau de régulation transcriptionnelle

5 iv ABSTRACT Somatic stem cells usually exhibit a very different behavior compared to pluripotent stem cells. The molecular basis of embryonic stem cell self-renewal was recently decrypted by the relative straightforwardness with which we can now purify and maintain these cells in culture for long periods of time. However, this is not the case with hematopoietic stem cells. In order to elucidate the molecular mechanisms of hematopoietic stem cell self-renewal, I developed a novel gain-of-function screening strategy, which bypasses some constraints found with these cells. Starting from a list of more than 700 candidate nuclear factors and asymmetric division factors, I have identified 24 new factors that increase hematopoietic stem cell activity when overexpressed. I have also found that nine of these factors act extrinsically to hematopoietic stem cells, i.e., the effect comes from the engineered feeder cells in co-culture. Moreover, I have revealed a new transcriptional regulatory network including five of the factors identified, i.e., PRDM16, SPI1, KLF10, FOS and TFEC. This network is particularly similar to that involved in osteoclastogenesis. These results raise the hypothesis that osteoclasts might also be part of the functional hematopoietic stem cell niche in the bone marrow. Furthermore, I have identified a second regulatory network involving SOX4, SMARCC1 and several factors previously identified in the laboratory, i.e., BMI1, MSI2 and KDM5B. Besides, several lines of evidence tend to show that there are fundamental differences between mouse and human hematopoietic stem cells. Keywords : functional screen, gene overexpression, hematopoietic stem cell, self-renewal, extrinsic expansion, niche, transcriptional regulatory network

6 v Table des matières RÉSUMÉ iii ABSTRACT iv Table des matières v Liste des figures x Liste des tableaux xii Liste des abréviations xiii Remerciements xxiv But et Plan de la Thèse xxv CHAPITRE Introduction Cellule Souche Auto-Renouvellement Plasticité Phénotypique et Fonctionnelle SCNT Cellules ips Interconversion Cellulaire Régulation Extrinsèque des Cellules Souches Sources Documentaires 10 CHAPITRE Régulation Moléculaire des Cellules Souches Hématopoïétiques Émergence Évaluation Fonctionnelle Méthodes d Évaluation In Vitro Méthodes d Évaluation In Vivo Discrimination Phénotypique Cinétique de Prolifération Destin Cellulaire Niche Ostéoblastes Ostéoclastes Macrophages Cellules Souches Mésenchymateuses Quiescence Interprétation des Stimuli Extracellulaires Voies de Signalisation des Cytokines 30

7 vi IL IL THPO SCF Voie de Signalisation Notch Voie de Signalisation Wnt Voie de Signalisation Smad Voie de Signalisation ANGPT1/TEK Voie de Signalisation FGF Traitement des Instructions dans le Noyau Régulateurs du Cycle Cellulaire Facteurs de Transcription et Cofacteurs AHR CBP FOXO GFI HOXB ID MYC STAT Modificateurs Épigénétiques BMI MLL MOZ Fidélité Génomique Réponse aux Dommages à l ADN Dérivés Réactifs de l Oxygène Fortification des Télomères Sources Documentaires 47 CHAPITRE A Functional Screen to Identify Novel Effectors of Hematopoietic Stem Cell Activity Contribution des Co-Auteurs Summary Introduction Results Selection and Ranking of Candidate Genes Design and Principle of the Screen Primary Screen and Validation 76

8 vii Most Genes Identified Confer Enhancement in HSC Activity Impact of Candidate Genes on Cell Proliferation, Death and Differentiation In Vitro Transduced HSC Differentiate In vivo Evidence of Self-Renewal Divisions by Transduced HSC Evidence of a Non-Cell Autonomous Activity for Selected Genes Discussion Identified Hits Display Hoxb4-like HSC Activity Non-Cell Autonomous Enhancement in HSC Activity Future of the resource Experimental Procedures Retroviral Vectors Animals CRU Assay on HSC-Enriched Populations Bone Marrow Cells Culture, Retroviral Infection and Transplantation Flow Cytometry Assessment of Donor-Derived Hematopoiesis Analysis of Proliferation and Cell Death Resource Database and Web Application Statistical Analysis Acknowledgments References Supplemental Figures and Tables Supplemental Experimental Procedures Retroviral Vectors Animals Hematopoietic Stem Cell Isolation Bone Marrow Cells Culture, Retroviral Infection and Transplantation Flow Cytometry Assessment of Donor-Derived Hematopoiesis Southern Blot Analysis of Genomic DNA Western Blot Analysis Q-RT-PCR Expression Studies Supplemental References 114 CHAPITRE Asymmetrical segregation and self-renewal of hematopoietic stem and progenitor cells with endocytic Ap2a Contribution des Co-Auteurs Abstract Introduction Material and Methods 123

9 viii Retroviral vectors; Animal husbandry; Hematopoietic stem cell isolation; Q-RT- PCR expression studies; Bone marrow cells culture, retroviral infection and transplantation; Flow cytometry assessment of donor-derived hematopoiesis; Southern blot analysis of genomic DNA; CRU assay on HSC-enriched cells; and Cell proliferation and cell death analyses Resource database and web application Confocal Microscopy Videomicroscopy Statistical analysis Results Candidate polarity screen for HSC expansion Validation and self-renewal of Ap2a2-transduced HSCs in vitro Self-renewal of Ap2a2-transduced HSCs in vivo Effect of Ap2a2 shrna in HSCs Evaluation of Ap2a2-transduced HSCs Disparate Ap2a2 and Numb localization in HSC Ap2a2 segregation during HSC mitosis Discussion Acknowledgements Author Contributions Disclosure of Conflicts of Interest References Supplemental Figures and Tables 153 CHAPITRE A Novel Osteoclastic Network Determines Niche for Mouse Hematopoietic Stem Cells In Vitro Contribution des Co-Auteurs Summary Introduction Results Uncovering non-hsc autonomous activity for additional nuclear factors In vivo evaluation of HSC exposed to engineered feeder cells Assessment of soluble versus cell-cell contact determinants Identification of NHA networks agonists of HSC activity Discussion Experimental Procedures Retroviral vectors Animals Hematopoietic cell culture, retroviral infection and transplantation 171

10 ix Flow cytometry assessment of donor-derived hematopoiesis Microarray hybridization and analyses Statistical analysis Acknowledgments References Supplemental Figures and Tables Supplemental Experimental Procedures Animals Hematopoietic stem cell isolation Hematopoietic cell culture, retroviral infection and transplantation Flow cytometry assessment of donor-derived hematopoiesis Q-RT-PCR expression studies Microarray hybridization and analyses Detection of secreted factors in culture media Supplemental References 189 CHAPITRE Discussion Choix d un Débit de Criblage Gain-de-Fonction Modéré Méthode de Détection du Criblage Améliorer la Spécificité du Criblage Biais Insoupçonné vers l Identification de Facteurs Augmentant l Activité des HSCs de Manière Extrinsèque Quantifier l Expansion Extrinsèque du Nombre de HSCs Divergence Inter-Espèces Co-Surexpression pour une Synergie d Expansion Intégration de Facteurs Déterminants en Différents Réseaux GPX Facteurs Sécrétés par le Réseau Ostéoclastique Conclusion, Impact et Perspective Sources Documentaires 204 ANNEXE 1 xxvi

11 x Liste des figures Figure 1.1 Méthode de détection de l auto-renouvellement des cellules souches et progénitrices hématopoïétiques en révélant l existence d unités formant des colonies sur la rate. 5 Figure 2.1 Organisation hiérarchique du développement du système hématopoïétique murin. 15 Figure 2.2 La taille de la réserve de HSCs est influencée par différents types de division cellulaire. 22 Figure 2.3 La division asymétrique des cellules souches peut être accomplie par différents mécanismes. 23 Figure 2.4 Représentation schématique de la niche des HSCs dans la moelle osseuse. 26 Figure 3.1 Experimental design of nuclear factors screening strategy. 75 Figure 3.2 Identification of positive candidates with Hoxb4-like activity. 77 Figure 3.3 HSC activity is enhanced by overexpression of the newly identified Hoxb4- like genes. 79 Figure 3.4 In vitro differentiation, survival and proliferation profiles of cultured cells. 81 Figure 3.5 In vivo differentiation potential of HSC overexpressing validated hits. 83 Figure 3.6 Clonal analysis to track HSC self-renewal divisions. 85 Figure S3.1 Expression levels of confirmed hits in purified HSC. 97 Figure S3.2 Purity and activity of sorted HSC subpopulation. 98 Figure S3.3 In vivo differentiation of HSC transduced with newly identified genes. 99 Figure S3.4 Importance of the ex vivo culture in the specificity of the screen. 100 Figure S3.5 Different forms of Trim27 with different potential. 101 Figure 4.1 Gene expression profiles of HSC polarity fate determinants. 126 Figure 4.2 Polarity screen to identify agonists of HSC expansion. 128 Figure 4.3 Analyses of Ap2a2-transduced HSCs In vitro. 129 Figure 4.4 Self-renewal of Ap2a2-transduced HSCs in vivo. 131 Figure 4.5 Qualitative effects of Ap2a2-transduced HSCs. 134 Figure 4.6 Endogenous AP2A2 localization in hematopoietic and leukemic cells. 136 Figure 4.7 Asymmetrical and symmetrical AP2A2 during mitosis. 139 Figure S4.1. Self-renewal of Ap2a2-transduced HSCs in vivo. 153 Figure S4.2. Effect of Ap2a2 shrna in HSCs. 154 Figure 5.1 Co-cultures with feeder cells overexpressing selected genes increase HSC activity. 164 Figure 5.2 Identification of an osteoclastic network in engineered feeder cells. 166 Figure 5.3 Osteoclastic network is responsible for production of putative HSC growth factors. 167

12 xi Figure S5.1 Cell-cell contact prevention reveals secreted factors. 178 Figure S5.2 Candidate factors are overexpressed in feeder cells. 179 Figure 5.3 Osteoclastic network is responsible for production of putative HSC growth factors. 180 Figure S5.4 Expansion of human CD34 + CD45RA - cord blood cell numbers in vitro. 181 Figure S5.5 Amplification of human HSC activity in co-cultures with engineered feeder cells. 182 Figure 6.1 Identification d un nouveau réseau de régulation transcriptionnelle SOX Figure 6.2 Évaluation de la présence de membres du système rénine-angiotensine dans les milieux conditionnés. 200 Figure 6.3 Casse-tête dont les pièces représentent les facteurs déterminants de l activité des HSCs. 202

13 xii Liste des tableaux Tableau 1.1 Exemples d interconversion cellulaire par modification de l expression génétique. 7 Table 3.1 HSC activity is enhanced extrinsically. 87 Table S3.1 Scoring system used in candidate selection. 103 Table S3.2 Subcloning strategy and protein expression of candidates. 104 Table S3.3 Summary of gene transfer and reconstitution data obtained from primary screen and validation experiments. 105 Table S3.4 Summary of Hoxb4-like candidates on HSC activity and clonality of reconstitution. 106 Table S3.5 Secondary transplantation assay for selected genes. 108 Table S3.6 Primer sequences and Universal ProbeLibrary probe numbers used in Q-RT- PCR assays. 109 Table S4.1 Candidates genes for expression profile. 155 Table S4.2 Polarity overexpression screen summary. 156 Tableau S5.1 Description of genes that meet our selection criteria after analysis of microarray expression profiles in engineered feeder cells. 183 Tableau S5.2 Genes upregulated at least 2-fold (2 nd column) following overexpression of NHA factors (1 st column) in engineered feeder cells. 184

14 xiii Liste des abréviations ABL : oncogène homologue au virus de la leucémie murine Abelson v-abl ACBD : centre australien pour les maladies du sang ACD : division cellulaire asymétrique ACE : enzyme de conversion de l AGT I ACP5 : phosphatase acide 5 résistante au tartrate (TRAP) ADN : acide désoxyribonucléique ADNc : acide désoxyribonucléique complémentaire AGM : région de l aorte, des gonades et du mésonéphros AGT : angiotensinogène AGT I : angiotensine I AGT II : angiotensine II AGTR1 : récepteur de l angiotensine II AHR : récepteur d hydrocarbure aryle AKT : famille d oncogènes homologues au virus du thymome murin v-akt AML : leucémie myéloïde aigüe AMPc : adénosine monophosphate cyclique ANGPT1 : angiopoïétine 1 ANGPTL : famille de protéines ressemblant à l angiopoïétine AP2A2 : sous-unité alpha adaptine 2 du complexe de protéines adaptatrices 2 AP : phosphatase alcaline APC : allophycocyanine apkc: famille de protéines kinases atypiques ARF : inhibiteur de protéines kinases dépendantes des cyclines (p19 INK4D/ARF) ARN : acide ribonucléique ARNi : acide ribonucléique interférant ASCL1 : protéine homologue au complexe achaete-scute 1 ASH : société américaine d hématologie ATM : protéine mutée dans le syndrome d ataxie télangiectasie ATR : protéine associée à l ataxie télangiectasie et à RAD3 B220 : marqueur de surface cellulaire des lymphocytes B BAALC : protéine cytoplasmique de la leucémie aigüe et du cerveau Ba/F3-p210 : lignée cellulaire immortalisée pro-b de souris exprimant p210 BCL2 : protéine associée au lymphome B BCLQ : banque de cellules leucémiques du Québec BCR : région de rassemblement de points d arrêt

15 xiv BM : moelle osseuse BMI1 : protéine de région d insertion du virus de leucémie murine Moloney dans les lymphomes B BMPR1A : récepteur 1A de la protéine morphogène des os Bnx : lignée de souris consanguines beige-nude-xid BRCA : famille de protéines associées à l apparition précoce du cancer du sein BrdU : bromodésoxyuridine BSA : albumine de sérum bovin C3H/HeJ: lignée de souris consanguines C3H/HeJ C57Bl/6J: lignée de souris consanguines C57 noire 6 CAFC : cellule formant une zone pavée CB : sang de cordon ombilical CBP : protéine de liaison à CREB CCNB1 : cycline B1 CCND2 : cycline D2 CCNG2 : cycline G2 CD : famille d antigènes de surface cellulaire CDC42 : facteur de cycle de division cellulaire 42 CDH2 : N-cadhérine CDK : famille de kinases dépendantes des cyclines CDKI : famille d inhibiteurs de kinase dépendante des cyclines CDKN1A : inhibiteur de kinase dépendante des cyclines 1A (p21cip1) CDKN1B : inhibiteur de kinase dépendante des cyclines 1B (p27kip1) CDKN1C : inhibiteur de kinase dépendante des cyclines 1C (p57kip2) CDKN2A : inhibiteur de kinase dépendante des cyclines 2A (p16ink4a) CDKN2B : inhibiteur de kinase dépendante des cyclines 2B (p15ink4b) CDKN2C : inhibiteur de kinase dépendante des cyclines 2C (p18ink4c) CDKN2D : inhibiteur de kinase dépendante des cyclines 2D (p19ink4d/arf) cdna : acide désoxyribonucléique complémentaire CEBPA : protéine de liaison à CCAAT/amplificateur alpha CEBPB : protéine de liaison à CCAAT/amplificateur beta CFC : cellule formant une colonie CFU-C : unité formant une colonie en culture CFU-nmEM : unité formant des colonies de neutrophiles, de macrophages, d érythroblastes et de mégacaryocytes CFU-S : unité formant une colonie sur la rate cgy : centigray CHUL : centre hospitalier de l Université Laval CIHR : Instituts de recherche en santé du Canada

16 xv CIP1 : protéine interagissant avec des kinases dépendantes des cyclines CML : leucémie myéloïde chronique CNBP : protéine de liaison aux acides nucléiques de type CCHC en forme de doigt de zinc CPA : comité de protection des animaux CRA : méthode de reconstitution hématopoïétique compétitive CREB : famille de protéines de liaison aux éléments de réponse à l AMPc CRU : unité de reconstitution hématopoïétique compétitive 137Cs : césium 137 CSF1 : facteur de stimulation de colonies de macrophages CSF1R : récepteur du facteur de stimulation de colonies de macrophages CSF2 : facteur de stimulation de colonies de granulocytes et de macrophages CSF2R : récepteur du facteur de stimulation de colonies de granulocytes et de macrophages CSF3 : facteur de stimulation de colonies de granulocytes CSF3R : récepteur du facteur de stimulation de colonies de granulocytes Ct : cycle seuil CTNNB1 : beta-caténine CTSK : cathepsine K CXCL12 : chimiokine dérivée de cellules stromales avec motif C-X-C CXCR4 : récepteur de CXCL12 Cy : famille de cyanines dct : différence entre cycles seuils dctp : déoxycytidine triphosphate DAPI : 4,6 -diamidino-2-phénylindole DLL1 : protéine 1 ressemblant à delta chez Drosophila melanogaster DMEM : milieu de culture cellulaire Eagle modifié Dulbecco DNA : acide désoxyribonucléique EcoR1 : enzyme de restriction provenant de Escherichia coli EGFP : protéine fluorescente verte amplifiée EGR1 : facteur de réponse à croissance précoce ELF4 : facteur de transcription 4 avec domaine ets ressemblant à E74 ELISA : méthode de détection immunosorbante couplée à une enzyme EPAS1 : protéine endothéliale avec domaine PAS (HIF2A) EPO : érythropoïétine ERCC : famille de protéines de complémentation de réparation d excision chez les rongeurs ERDR1 : facteur de différenciation érythroïde 1 ES : cellule souche embryonnaire

17 xvi ESC : cellule souche embryonnaire ETV2 : protéine variante ets 2 EYFP : protéine fluorescente jaune amplifiée F1 : progéniture de première génération FACS : méthode de tri de cellules activées par fluorescence FAS : membre 6 de la superfamille des récepteurs du facteur de nécrose de tumeur FASLG : ligand de FAS FBS : sérum de fœtus bovin FBXW7 : facteur 7 avec domaine de répétition WD et boîte F FCS : sérum de fœtus de veau FGF : famille de facteurs de croissance de fibroblaste FGFR1 : récepteur du facteur de croissance de fibroblaste 1 FITC : isothiocyanate de fluorescéine FL: foie fœtal FLA2 : lignée de cellules souches leucémiques provenant de foie fœtal, induites par HOXA9 et MEIS1 FLAG : octapeptide épitope FLB1 : lignée de cellules souches leucémiques provenant de la moelle osseuse, induites par HOXA9 et MEIS1 FLT3 : tyrosine kinase reliée à fms 3 FLT3LG : ligand de FLT3 FOS : oncogène homologue au virus d ostéosarcome murin FBJ FOXO : famille de protéines avec domaine en forme de tête de fourche de sous-classe O FRSQ : Fonds de recherche en santé du Québec G0 : phase de quiescence du cycle cellulaire G1 : première phase de croissance du cycle cellulaire G2 : deuxième phase de croissance du cycle cellulaire GAPDH : glycéraldéhyde-3-phosphate déshydrogénase GATA2 : protéine 2 de liaison à GATA GFI1 : répresseur de transcription 1 indépendant des facteurs de croissance GFP : protéine fluorescente verte GP130 : glycoprotéine 130, récepteur d OSM, et transducteur de signaux d IL6 (IL6ST) GP+E-86 : lignée de cellules encapsidatrices de rétrovirus dérivées des cellules NIH 3T3 GPR110 : récepteur 110 couplé aux protéines G GPSM2 : modulateur 2 de la signalisation des protéines G GPX3 : glutathion peroxidase 3 Gr1 : marqueur de surface cellulaire des granulocytes H2B : histone H2B

18 xvii H3 : histone H3 H3K4 : lysine 4 de l histone H3 H3K27me3 : lysine 27 triméthylée de l histone H3 HDAC1 : déacétylase 1 d histone HES1 : facteur de transcription velu et amplificateur de scission 1 HIF1A : sous-unité alpha du facteur 1 inductible par l hypoxie HindIII : enzyme de restriction provenant de Haemophilus influenzae HMGB1 : protéine de groupe à haute mobilité à boîte 1 HNRPDL : ribonucléoprotéine nucléaire hétérogène de type D HOX : famille de protéines avec domaine homéotique HPP-CFC : cellule formant une colonie à haut potentiel prolifératif HSC : cellules souche hématopoïétique ICN : domaine intracellulaire de NOTCH1 ID : famille d inhibiteurs de liaison à l ADN IGFBP2 : protéine 2 de liaison au facteur de croissance ressemblant à l insuline IL : famille d interleukines IL1R1 : récepteur d interleukine 1 IL2RG : récepteur gamma de l interleukine 2 IL3R : récepteur d interleukine 3 IL6ST : glycoprotéine 130, récepteur d OSM, et transducteur de signaux d IL6 in : neurone induit INK4 : famille d inhibiteurs de kinase dépendante des cyclines ips : cellule souche pluripotente induite IRES : site d entrée ribosomal interne IRIC : Institut de recherche en immunologie et cancérologie IRSC : Instituts de recherche en santé du Canada ITGA6 : intégrine alpha 6 (CD49f) ITGB1 : intégrine beta 1 IT-HSC : cellule souche hématopoïétique à moyen terme JAG1 : protéine Jagged 1 JAK : famille de protéines janus kinase JUN : oncogène homologue au virus du sarcome aviaire v-jun 17 kb : kilobase KDM5B : déméthylase 5B spécifique à la lysine Ki67 : antigène identifié par l anticorps Ki67 KIF3A : membre 3A de la famille des kinésines KIP : famille d inhibiteurs de kinase dépendante des cyclines KIT : oncogène homologue au virus du sarcome félin Hardy-Zuckerman v-kit 4 KLF : famille de facteurs de transcription ressemblant à Kruppel

19 xviii KLS : cellule KIT+Lin-Sca1+ KU80 : autoantigène Ku (XRCC5) LCN2 : lipocaline 2 LDA : méthode de dilution limite LIC : cellule initiatrice de leucémie LIF : facteur d inhibition de leucémie LIG4 : ligase d ADN 4 Lin : antigènes de différenciation hématopoïétique incluant Gr1, B220 et Ter119 LIN28A : facteur A homologue à lin-28 chez Caenorhabditis elegans LMPP : cellule progénitrice multipotente avec biais lymphoïde LRP : famille de protéines reliées au récepteur de lipoprotéine à faible densité LSC : cellule souche leucémique LSK : cellule Lin-Sca1+KIT+ LTC-IC : cellule initiant une culture à long terme LT-HSC : cellules souche hématopoïétique à long terme LYPD5 : protéine 5 avec domaine LY6/PLAUR M : phase de mitose du cycle cellulaire Mac : marqueur de surface cellulaire des macrophages MACS : système de tri cellulaire par magnétisme MAFA : oncogène homologue au fibrosarcome musculoaponeurotique v-maf de type A MAMDC2 : protéine 2 avec domaine MAM MAML1 : protéine 1 ressemblant à mastermind chez Drosophila melanogaster MAPK : famille de kinases activées par des agents mitogènes MAS : activité moyenne des cellules souches MEIS1 : protéine MEIS avec homéodomaine 1 Mfe1 : enzyme de restriction provenant de Mycoplasma fermentas mg : milligramme µg : microgramme miarn : microacide ribonucléique MITF : protéine associée à la microphthalmie ml : millilitre µl : microlitre MLL : protéine de leucémie à lignées mixtes MMLV-RT : transcriptase inverse du virus de la leucémie murine Moloney MOZ : protéine de leucémie monocytaire en forme de doigt de zinc MPL : protéine de la leucémie myéloproliférative MPP : cellule progénitrice multipotente mrna : acide ribonucléique messager MSC : cellule souche mésenchymateuse

20 xix MSCV : virus de cellule souche murine MSH2 : protéine 2 homologue à muts chez Escherichia coli MSI2 : protéine 2 homologue à musashi chez Drosophila melanogaster MYB : oncogène homologue au virus de la myéloblastose aviaire v-myb MYC : oncogène homologue au virus de la myélocytomatose aviaire v-myc MYCN : protéine MYC associée au neuroblastome MYOD1 : facteur de différenciation myogénique 1 MYT1L : protéine 1 ressemblant à la myéline NA10HD : protéine de fusion de NUP98 avec l homéodomaine d HOXA10 NAC : N-acétyl-L-cystéine NANOG : protéine NANOG avec homéodomaine NCIC : Institut national du cancer du Canada NCOA2 : récepteur nucléaire coactivateur 2 NES : nestine NEUROG3 : neurogénine 3 NFATC1 : facteur nucléaire 1 des lymphocytes T activés, dépendant de la calcineurine NGAL : lipocaline associée à la gélatinase des neutrophiles (LCN2) NHA : extrinsèque aux cellules souches hématopoïétiques NHEJ : fusion d extrémités non homologues NHMRC: Conseil de recherche médicale et de santé nationale d Australie NIH 3T3 : lignée de fibroblastes embryonnaires de souris NK : cellule tueuse naturelle NOD : souris diabétique non obèse Not1 : enzyme de restriction provenant de Nocardia otitidis NOTCH : famille de protéines homologues à notch chez Drosophila melanogaster NSG : souris NOD/SCID mutante pour IL2RG NUMB : protéine homologue à numb chez Drosophila melanogaster NUP98 : nucléoporine 98 OAF : facteur d activation des ostéoclastes OCT4 : protéine 1 de classe 5 à domaine POU (POU5F1) OLFM1 : olfactomédine 1 OP9 : lignée cellulaire murine établie à partir de souris ostéopétrotiques mutantes pour Csf1 ORF : phase ouverte de lecture OSM : oncostatine M 32P : phosphore 32 p15ink4b : inhibiteur de kinase dépendante des cyclines 2B (CDKN2B) p16ink4a : inhibiteur de kinase dépendante des cyclines 2A (CDKN2A) p18ink4c : inhibiteur de kinase dépendante des cyclines 2C (CDKN2C)

21 xx p19ink4d/arf : inhibiteur de kinase dépendante des cyclines 2D (CDKN2D) p21cip1 : inhibiteur de kinase dépendante des cyclines 1A (CDKN1A) p27kip1 : inhibiteur de kinase dépendante des cyclines 1B (CDKN1B) p38 : protéine activée par des agents mitogènes 14 (MAPK14) p57kip2 : inhibiteur de kinase dépendante des cyclines 1C (CDKN1C) PAR6A : protéine 6 alpha homologue à la protéine de partitionnement défectueuse par-6 chez Caenorhabditis elegans (PARD6A) PAX5 : facteur de transcription avec paires de boîtes homéotiques 5 PBS : tampon phosphate salin PBX1 : facteur de transcription de leucémie pre-b avec boîte homéotique 1 PcG : famille de protéines Polycomb PCR : réaction en chaîne par polymérase PDGF : famille de facteurs de croissance dérivés des plaquettes PDX1 : facteur de transcription pancréatique et duodénal à boîte homéotique 1 PE : phycoérythrine Pep3b: lignée de souris consanguines Pep3b PGK : phosphoglycérate kinase 1 PI3K : phosphoinositide-3-kinase PIM1 : proto-oncogène sérine/thréonine kinase 1 pkof : vecteur rétrovial contenant la séquence Kozak, un oligonucléotide et un tag FLAG PML : protéine de leucémie promyélocytique postgresql: système de gestion de base de données relationnelles POU3F2 : facteur de transcription 2 de classe 3 à domaine POU POU5F1 : facteur de transcription 1 de classe 5 à domaine POU (OCT4) PPARG : récepteur gamma activé par le proliférateur de peroxysome PPV: valeur de prédiction positive PRC : complexe répresseur Polycomb PRDM16 : protéine 16 avec domaine PR PRKCZ : protéine kinase C, zeta PTEN : protéine phosphatase homologue à la tensine PTGDR : récepteur de la prostaglandine D2 synthase PTGDS : prostaglandine D2 synthase PTN : pléiotropine Q-RT-PCR : réaction en chaîne quantitative par polymérase en temps réel RAC : famille de substrats de la toxine du botulinum C3 relié à RAS RACGAP1 : protéine activatrice de la GTPase de RAC RAD50 : protéine homologue à rad50 chez Caenorhabditis elegans RANK: membre 11A de la superfamille des récepteurs du facteur de nécrose de tumeur
22 xxi (TNFRSF11A) RAS : famille d oncogènes homologues au virus du sarcome de rat RAS : système rénine-angiotensine RB1 : protéine associée au rétinoblastome 1 RBPJ : protéine de liaison des signaux de recombinaison pour l immunoglobulin kappa J RCAP : collège royal des médecins d Australie Rho123 : rhodamine 123 RNA : acide ribonucléique RNAi : acide ribonucléique interférant ROS : dérivés réactifs de l oxygène RQ : quantité de différences relative R-SMAD : protéines de la famille SMAD régulées par un récepteur RT-PCR : réaction en chaîne par polymérase en temps réel RU : unité de reconstitution hématopoïétique RUNX : famille de protéines avec domaine runt S : phase de synthèse du cycle cellulaire S1 : souche de souris avec mutation dans le gène Scf Sca1 : antigène de cellule souche 1 SCD : division cellulaire symétrique SCF : facteur de cellule souche SCID : souris immunodéficiente combinée sévère SCNT : transfert nucléaire de cellules somatiques SD : écart-type SEM : erreur-type de la moyenne SF : facteur de cellule souche (SCF) SFPI1 : oncogène d intégration du provirus formant des foci sur la rate (SFFV) 1 (SPI1) SH2 : famille 2 de protéines de signalisation avec domaine d homologie Src SH2B3 : protéine de transduction de signaux LNK shrna : acide ribonucléique en forme de courte épingle à cheveux SKI : oncogène homologue au virus du sarcome aviaire v-ski SLAM : molécule d activation de signalisation de lymphocyte SLC22A17 : membre 17 de la famille 22 des transporteurs de soluté SMAD : famille de protéines homologues aux mères contre les décapentaplégiques SMARCC1 : membre 1 de la sous-famille C des régulateurs de chromatine dépendants de l actine, associés à la matrice et reliés aux facteurs SWI/SNF SOX : famille de protéines de la région déterminante du sexe Y SPF : sans pathogène spécifique SPI1 : oncogène d intégration du provirus formant des foci sur la rate (SFFV) 1 (SFPI1)
23 xxii SPP1 : phosphoprotéine sécrétée 1 (OPN : ostéopontine) SR : auto-renouvellement SR1 : stemrégénine1 SRC : cellule de reconstitution hématopoïétique de souris NOD/SCID SSEA1 : fucosyltransférase 4 (FUT4) STAT : famille d activateurs de transcription et transducteurs de signaux ST-HSC : cellules souche hématopoïétique à court terme TAT : transactivateur de transcription TBP : protéine de liaison à la boîte TATA TCDD : 2,3,7,8-tétrachlorodibenzo-p-dioxine TCF : famille de facteurs de transcription TCFEC : facteur de transcription EC (TFEC) TEK : récepteur tyrosine kinase endothelial Ter119 : marqueur de surface cellulaire des érythrocytes TFEC : facteur de transcription EC (TCFEC) TGFB : facteur de croissance transformant beta THPO : thrombopoïétine THY1 : antigène THY1 (CD90) TMOD1 : tropomoduline 1 TNFRSF11A: membre 11A de la superfamille des récepteurs du facteur de nécrose de tumeur (RANK) TP53 : suppresseur de tumeur p53 TRAP : phosphatase acide 5 résistante au tartrate (ACP5) TRIM27 : protéine avec motif tripartite 27 TrxG : famille de protéines trithorax TTAGGG : séquence répétitive de nucléotides retrouvée dans les télomères VPS72 : protéine associée au tri des protéines vacuolaires W : souche de souris avec mutation dans le gene Kit W41 : mutation dans le gène Kit WFDC1 : protéine 1 avec quatre domaines nucléaires disulfures WAP WNT : famille de protéines de site d intégration MMTV de type sans aile XBP1 : protéine 1 de liaison aux boîtes X XPA : protéine du groupe de complémentation A du xeroderma pigmentosum XRCC5 : protéine 5 de complémentation de réparation de rayon X (KU80) ZFP472 : protéine en forme de doigt de zinc 472
24 xxiii À Gabriel, Annabelle et Soléï
25 xxiv Remerciements Merci à mon directeur de thèse Dr Guy Sauvageau pour la qualité inestimable de ton enseignement et pour ton enthousiasme inébranlable. Merci à tous mes collègues du labo, aux professionnels des différentes plateformes technologiques de l IRIC ainsi qu aux membres de mon comité de thèse pour vos précieux conseils. Merci au Programme de Biologie Moléculaire de l Université de Montréal, à la Fondation Cole et aux Instituts de Recherche en Santé du Canada pour votre soutien financier.
26 xxv But et Plan de la Thèse Le but ultime de cette thèse est d identifier de nouveaux facteurs pouvant stimuler l expansion du nombre de cellules souches hématopoïétiques (HSCs) in vitro afin d améliorer l efficacité de leur transplantation. Cette thèse est présentée en six chapitres et une annexe. Le premier chapitre définit différents types de cellule souche et décrit la possibilité de réorienter leur destinée en reconfigurant leur profil d expression génétique. Le deuxième chapitre met à jour un état des connaissances sur la régulation moléculaire des HSCs. Le troisième chapitre dévoile la stratégie et les résultats d un nouveau criblage fonctionnel que j ai effectué. Ce criblage a mené à l identification de 18 facteurs nucléaires stimulant l activité des HSCs, à savoir CNBP, ERDR1, FOS, HDAC1, HMGB1, HNRPDL, KLF10, PML, PRDM16, SFPI1 (SPI1), SKI, SMARCC1, SOX4, TCFEC (TFEC), TRIM27, VPS72, XBP1 et ZFP472. J ai également identifié, lors de ce même criblage, cinq facteurs de division asymétrique intensifiant l activité des HSCs, c est-à-dire AP2A2, GPSM2, TMOD1, KIF3A et CCNB1. Ces facteurs de division asymétrique sont présentés au quatrième chapitre, qui focalise principalement sur le rôle d AP2A2 au cours de la division asymétrique des HSCs. Le cinquième chapitre révèle que plusieurs des facteurs nucléaires identifiés au chapitre 3 agissent en fait de manière extrinsèque aux HSCs, et que certains d entre eux forment différents réseaux de régulation de transcription, dont un qui supporte l ostéoclastogénèse. Tous ces résultats sont discutés dans le sixième chapitre, qui se termine par une conclusion générale. L annexe 1 contient une publication montrant que l activité des HSCs normales et des cellules souches leucémiques peut être modulée par le suppresseur de dérivés réactifs de l oxygène GPX3, que j ai aussi identifié lors du criblage décrit au chapitre 3.
27 CHAPITRE 1 INTRODUCTION Cellule Souche et Reprogrammation
28 2 1 Introduction Le chapitre 1 est une introduction aux différents concepts et définitions entourant les cellules souches en général. Des propriétés diamétralement opposées distinguent les cellules souches pluripotentes des cellules souches somatiques. Une emphase est mise sur la découverte récente de moyens pour convertir un type de cellule en un autre, au choix, simplement en modifiant son profil d expression génétique. La possibilité fascinante de remanier le destin d une cellule souche en surexprimant un gène en particulier constitue d ailleurs le centre d intérêt du chapitre 3. Le chapitre 1 se termine avec l importance de l environnement externe dans lequel se trouve une cellule souche pour le maintien de son intégrité ainsi que pour son développement.
29 3 1.1 Cellule Souche Une cellule souche est généralement définie en vertu de ses caractéristiques fonctionnelles. Plutôt que de se référer à une entité cellulaire distincte, ce concept met l accent sur le potentiel d un groupe de cellules en tant que fondateur d un système vivant. Les cellules souches d un tissu adulte représentent une population potentiellement hétérogène de cellules indifférenciées par rapport au reste du tissu fonctionnel. Les cellules souches doivent être en mesure de remplir plusieurs fonctions comme de s installer dans un environnement approprié, de produire un grand nombre de cellules-filles matures et de s autorenouveler. De plus, les différents types de cellules souches bénéficient d une flexibilité et d une réversibilité dans l utilisation de ces options. Cependant, la qualification d une cellule à titre de véritable cellule souche requiert inévitablement certaines manipulations comme des tests de prolifération in vitro ou de transplantation in vivo. Malheureusement, ces expérimentations sont souvent dommageables pour les cellules souches et peuvent être à l origine de résultats biaisés. Comparable au principe d incertitude en mécanique quantique, ce fait est reconnu comme le «principe d incertitude de la biologie des cellules souches» (Potten and Loeffler, 1990). De plus, la définition d une cellule souche est davantage compliquée par le fait que certains adjectifs, sujets à diverses interprétations, sont employés pour illustrer une fonction quelconque. Ainsi, la prudence est de mise lors de l attribution de l épithète «souche» à une cellule donnée. Les cellules souches sont indispensables au développement, à la restauration posttraumatique des tissus et au remplacement cellulaire homéostatique. Toutes les cellules souches détiennent simultanément les potentiels d auto-renouvellement et de différenciation en une ou plusieurs lignées cellulaires différentes. Toutefois, l ampleur de la capacité d auto-renouvellement et de différenciation peut varier considérablement d un type de cellule souche à l autre. Par exemple, les cellules souches embryonnaires (ES) peuvent être isolées de la masse cellulaire interne du blastocyste, avant son implantation dans l endomètre, et peuvent engendrer presque tous les types cellulaires : elles sont pluripotentes. Les cellules ES détiennent également un potentiel d auto-renouvellement pratiquement infini dans un milieu de culture approprié. En revanche, les cellules souches adultes sont généralement multipotentes. Par exemple, les cellules souches hématopoïétiques (HSCs) peuvent se différencier en plusieurs types de cellules mais leur potentiel de régénération est limité uniquement au système hématopoïétique. Les HSCs ont aussi un potentiel d auto-renouvellement beaucoup plus limité que les cellules ES. Suite à une transplantation tertiaire ou quaternaire chez la souris, les HSCs subissent habituellement une extinction totale.
30 4 Le degré de restriction du potentiel d auto-renouvellement peut varier avec l âge des individus. Chez la souris, l activité des HSCs est altérée à mesure que les souris vieillissent. Le potentiel prolifératif des HSCs est beaucoup plus grand chez les jeunes que chez les vieilles souris, même si le nombre absolu de HSCs semble plus élevé chez les vieilles que chez les jeunes souris (de Haan et al., 1997). D autre part, le contexte génétique contribue beaucoup à de telles variations. Par exemple, la fréquence en HSC augmente avec l âge chez des souches de souris à forte longévité mais diminue avec l âge chez d autres souches à faible longévité (de Haan and Van Zant, 1999). De plus, les HSCs provenant de vieilles souris présentent un meilleur potentiel de myélopoïèse, une diminution du potentiel de lymphopoïèse ainsi qu une diminution de la capacité de repérer leur niche dans la moelle osseuse après injection intraveineuse (Liang et al., 2005; Rossi et al., 2005). 1.2 Auto-Renouvellement L auto-renouvellement d une cellule souche est un processus par lequel la division cellulaire génère une ou deux cellules-filles conservant un potentiel de développement similaire à celui de la cellule d origine. En d autres termes, l auto-renouvellement est une division cellulaire qui perpétue dans le temps la pluripotence, la multipotence ou l unipotence, selon le type de cellule souche. Ce processus est crucial pour que la taille du réservoir de cellules souches puisse s agrandir au cours du développement, être maintenue dans les tissus adultes et être rétablie suite à une lésion. Toute défaillance dans le mécanisme d auto-renouvellement des cellules souches peut être à l origine de problèmes de développement, de vieillissement prématuré et de cancer. La toute première démonstration expérimentale d auto-renouvellement de cellules souches fut réalisée par des chercheurs canadiens avec des cellules souches et progénitrices hématopoïétiques en utilisant une méthode de décompte d unité formant des colonies sur la rate, ou CFU-S (Till and Mc, 1961). Le critère principal pour considérer l autorenouvellement d une cellule souche primaire était sa capacité de générer une CFU-S secondaire (Figure 1.1). En utilisant un modèle basé sur la capacité d une cellule souche à adopter un mode de division symétrique d auto-renouvellement ou de différenciation, les auteurs de cette étude ont observé une forte hétérogénéité parmi les CFU-S secondaires en termes de capacité à s auto-renouveler. Ces CFU-S peuvent générer des clones qui ont une taille maximale de 5x10 6 cellules en différenciation terminale, qui ne contiennent pas de nouvelle CFU-S et qui n arrivent plus à proliférer (Till et al., 1964). Plus récemment, une autre équipe de recherche canadienne a démontré que la taille maximale d un clone produit par une cellule progénitrice est d environ 1x10 7 cellules en absence d auto-renouvellement (Benveniste et al., 2010).
31 5 CD CD Une population de cellules souches adultes est normalement hétérogène en termes d expression de marqueurs de surface cellulaire, mais aussi en termes de fonction, comme la prolifération, la transplantabilité et le potentiel de différenciation. Traditionnellement, le concept de différenciation d une cellule souche était considéré comme un changement irréversible au-delà duquel les cellules-filles avaient perdu tout potentiel souche. Aujourd hui, le concept de plasticité est plus largement accepté. Il comprend une hiérarchie de différenciation avec un déclin graduel, mais potentiellement réversible, de la capacité d auto-renouvellement. La notion de réversibilité de la différenciation a été substantiellement démontrée par des méthodes de reprogrammation nucléaire. Ce processus implique un échange du profil d expression génétique d un type cellulaire pour celui d un autre, offrant plus d espoir que jamais en médecine régénérative. De nombreurécolte des cellules de moelle osseuse transplantation receveuse primaire irradiation CFU-S primaires ablation de rate resuspendre une colonie transplantation receveuse secondaire ablation de rate CD irradiation CFU-S secondaires Figure 1.1 Méthode de détection de l auto-renouvellement des cellules souches et progénitrices hématopoïétiques en révélant l existence d unités formant des colonies sur la rate. Les cellules provenant de la moelle osseuse d une souris donneuse (CD45.1+) sont isolées et injectées dans la veine de la queue d une souris receveuse primaire congénique (CD45.2+) préalablement irradiée à dose létale afin de reconstituer son système hématopoïétique. Environ deux semaines plus tard, des colonies macroscopiques provenant de cellules souches et progénitrices hématopoïétiques CD45.1+ apparaissent à la surface de la rate (CFU-S primaires). Ensuite, on peut resuspendre les cellules d une colonie et les transplanter dans une souris receveuse secondaire préalablement irradiée pour finalement générer des CFU-S secondaires. La formation de CFU-S secondaires nécessite l auto-renouvellement des cellules souches et progénitrices. CFU-S=unité formant des colonies sur la rate Néanmoins, une seule LT-HSC transplantée dans une souris irradiée peut reconstituer son système hématopoïétique au complet pour toute sa vie (Osawa et al., 1996). Ce potentiel réside dans la compétence de la LT-HSC à s auto-renouveler. De plus, la présence dans le sang périphérique de cellules dérivées de la LT-HSC transplantée implique une production d au moins 1x10 9 cellules (Benveniste et al., 2010). Cette taille clonale nécessite une expansion initiale du nombre de LT-HSCs par division symétrique d autorenouvellement. 1.3 Plasticité Phénotypique et Fonctionnelle
32 6 ses stratégies ont évolué pour reprogrammer le noyau cellulaire, y compris le transfert nucléaire de cellules somatiques (SCNT), l induction de cellules souches pluripotentes (ips) et l interconversion de lignée cellulaire SCNT Le renversement complet de la différenciation cellulaire peut être obtenu par transplantation du noyau d une cellule embryonnaire (Briggs and King, 1952) ou bien d une cellule complètement différenciée (Gurdon and Uehlinger, 1966), dans un ovocyte énucléé. Les auteurs de ces études ont conclu que la différenciation ne nécessite pas de changements nucléaires irréversibles et que la reprogrammation entraîne des modifications dans l expression des gènes nucléaires, mais pas dans leur contenu. À cette époque, il était déjà concevable que la plupart des cellules de l organisme conserve le potentiel de former n importe quel autre type cellulaire. Par la suite, une équipe de recherche écossaise a réussi à cloner la brebis «Dolly», par transplantation du noyau d une cellule de glande mammaire dans un ovocyte énucléé (Wilmut et al., 1997). D importantes observations ont été notées pendant ce processus de reprogrammation. À prime abord, la décondensation de la chromatine a provoqué un gonflement de 30 fois du volume du noyau transféré grâce à la nucléoplasmine, une protéine chaperonne d histone dans l ovocyte (Tamada et al., 2006). Aussi, des marques épigénétiques de différenciation, comme la méthylation de l ADN et des histones, ont été effacées suite à la reprogrammation nucléaire (Barreto et al., 2007). Le développement du SCNT représente donc une avancée majeure dans la reprogrammation nucléaire. Il est ainsi possible de rembobiner la totalité du processus de différenciation cellulaire chez les mammifères à l aide du contenu d un noyau provenant d une cellule de mammifère adulte. Cette observation met en lumière la troublante possibilité que ce processus puisse également fonctionner chez l humain Cellules ips Un progrès significatif dans le domaine de la reprogrammation nucléaire est survenu lorsqu une équipe de recherche japonaise a découvert que des fibroblastes provenant de souris adultes peuvent être reprogrammés à un état souche pluripotent (ips) par la simple co-surexpression de 4 facteurs de transcription, c est-à-dire POU5F1, SOX2, MYC et KLF4 (Takahashi and Yamanaka, 2006) (Table 1.1, ligne 1). Cette réalisation s est également avérée applicable aux cellules humaines en utilisant un assortiment légèrement différent de facteurs de reprogrammation, à savoir POU5F1, SOX2, NANOG et LIN28A (Yu et al., 2007). Depuis ce temps, plusieurs combinaisons différentes de facteurs de transcription et de composés chimiques ont été employées pour produire des cellules ips
33 7 Tableau 1.1 Exemples d interconversion cellulaire par modification de l expression génétique. Cellule Initiale Surexpression de Deletion de Cellule Résultante Références 1 fibroblaste POU5F1, SOX2, MYC, KLF ips Takahashi et al, fibroblaste MYOD musculaire Choi et al, lymphocyte B CEBPA macrophage Xie et al, lymphocyte B Pax5 CLP Cobaleda et al, pancr. exocrine NEUROG3, PDX1, MAFA pancr. beta Zhou et al, fibroblaste ASCL1, POU3F2, MYT1L in Vierbuchen et al, 2010 ips=cellule souche pluripotente induite; CLP=cellule progénitrice lymphoïde commune; pancr.=pancréatique; in=cellule neuronale induite chez diverses espèces comme la souris, le rat, le porc, le singe et l humain (Esteban et al., 2009; Li et al., 2009; Liao et al., 2009; Liu et al., 2008; Takahashi et al., 2007). En fait, presque tous les types de cellule du corps sont reprogrammables en cellules ips (Lako et al., 2010). L utilisation de rétrovirus dans le protocole initial de reprogrammation peut potentiellement mener au développement de tumeurs dérivées de la surexpression d oncogènes, comme MYC, ou encore de mutagénèse insertionnelle causant des dysfonctions génétiques imprévisibles. Afin de contourner cet obstacle, plusieurs équipes ont développé de nouvelles stratégies de reprogrammation. Par exemple, certains ont envisagé l exclusion de MYC (Nakagawa et al., 2008), l excision du vecteur intégré après la formation des cellules ips (Woltjen et al., 2009), l utilisation d adénovirus (Stadtfeld et al., 2008; Zhou and Freed, 2009) ou de plasmides (Okita et al., 2010; Yu et al., 2009) pour exprimer transitoirement les facteurs de reprogrammation, ou encore le traitement direct avec des protéines recombinantes de reprogrammation (Kim et al., 2009; Zhou et al., 2009). Ces progrès peuvent maintenant faciliter la conception de lignées de cellules souches spécifiques à chaque patient pour l étude des mécanismes de diverses maladies et fournir des outils précieux pour la découverte de nouveaux médicaments. De plus, les cellules ips semblent détenir le potentiel de se redifférencier en plusieurs types de cellule, comme en cardiomyocyte (Martinez-Fernandez et al., 2010) ou en neurone moteur (Karumbayaram et al., 2009). Cette caractéristique importante crée une opportunité de développement de stratégies thérapeutiques et diagnostiques spécifiques à chaque patient. On peut désormais entrevoir la possibilité de corriger un défaut génétique particulier dans une cellule et de procéder à la reconstruction d un organe de remplacement exempt de ce défaut Interconversion Cellulaire Une autre découverte fascinante dans le domaine de la reprogrammation épigénétique a vu le jour lorsque certains facteurs de transcription ont été utilisés pour forcer une cellule somatique à adopter un destin différent, cette fois sans passer par un état pluripotent suivi d une redifférenciation. Une telle interconversion cellulaire a d abord été dé-
34 8 montrée en 1990 avec le facteur de transcription spécifique aux muscles, MYOD1 (Choi et al., 1990). En effet, l expression forcée de MYOD1 dans différents types de cellules non musculaires, comme des fibroblastes de peau, des chondroblastes ou des cellules épithéliales rétinales pigmentées, fut suffisante pour les convertir en myoblastes et en myotubes multinucléés (Table 1.1, ligne 2). Ensuite, plusieurs autres types d interconversion cellulaire ont été réalisés avec succès par la seule altération des niveaux d expression de facteurs clés. Par exemple, la surexpression d IL2 et de CSF2R peuvent imposer un sort myéloïde à des progéniteurs lymphoïdes (Kondo et al., 2000). Une augmentation d expression de CEBPA dans des lymphocytes B (Xie et al., 2004), ou de CEBPA/B et SPI1 dans des fibroblastes (Feng et al., 2008), favorise l acquisition de propriétés de type macrophage (Table 1.1, ligne 3). L inactivation de Pax5 induit la dédifférenciation des lymphocytes B en progéniteurs lymphoïdes communs (Cobaleda et al., 2007) (Table 1.1, ligne 4). La surexpression des trois facteurs de transcription NEUROG3, PDX1 et MAFA peut efficacement permuter des cellules pancréatiques exocrines en cellules beta productrices d insuline in vivo (Zhou et al., 2008) (Table 1.1, ligne 5). La surexpression combinée des trois facteurs ASCL1, POU3F2 et MYT1L est suffisante pour une interconversion de fibroblastes embryonnaires ou postnataux en neurones fonctionnels in vitro (Vierbuchen et al., 2010) (Table 1.1, ligne 6). Ces neurones induits (in) expriment plusieurs protéines spécifiques aux neurones, peuvent propager des potentiels d action et participer à la construction de synapses fonctionnelles. Fait intéressant, la surexpression des deux facteurs de transcription CEBPB et STAT3 est suffisante pour réorienter des cellules souches neurales vers une voie mésenchymateuse tumorale, processus qui peut être renversé par le freinage d expression de ces facteurs dans des cellules gliomales (Carro et al., 2010). L interconversion directe représente une stratégie prometteuse dans la métamorphose de destins cellulaires. Toutes ces études ouvrent la porte à la découverte de nouveaux facteurs pouvant interconvertir n importe quel type de cellule en n importe quel autre, en dépit du fait que la réinitialisation du profil d expression génétique semble de plus en plus ardue à mesure que les cellules se différencient. À l avenir, la reprogrammation cellulaire va contribuer à révéler les mystères de la différenciation cellulaire et sera d une aide inestimable en médecine régénérative. À titre d exemple, des lignées cellulaires induites ou interconverties provenant de patients atteints de troubles génétiques pourraient être utilisées afin de cribler des molécules neutralisantes. Elles pourraient également servir de cellules de remplacement une fois corrigées. 1.4 Régulation Extrinsèque des Cellules Souches Jusqu à maintenant, nous avons exploré différentes tactiques de conversion de pro-
35 9 grammes génétiques intrinsèques aux cellules dans le but de modifier délibérément leur destin. Cependant, en conditions homéostatiques, le programme génétique d une cellule dépend énormément du microenvironnement dans lequel elle se trouve. Cet endroit est généralement appelé une niche et est composé d un réseau très complexe de plusieurs types de cellules, de protéines de matrice extracellulaire et d une panoplie de signaux moléculaires auxquels une cellule souche peut réagir ou non. Par exemple, la niche des cellules ES se trouve normalement dans la masse cellulaire interne du blastocyste alors que celle des HSCs adultes se trouve dans les régions endostéales et endothéliales de la moelle osseuse. En fait, c est principalement en réponse à un signal externe qu une cellule souche adopte un programme génétique différent, et ultimement, une fonction différente. Ces changements environnementaux peuvent avoir une incidence sur le type de division cellulaire que choisissent les cellules souches en cycle de prolifération, comme une division symétrique d auto-renouvellement ou de différenciation, ou bien une division asymétrique. Nous reviendrons plus en détails sur ces mécanismes de division au chapitre 2 dans la section «2.5 Destin Cellulaire». Le rôle primordial de la niche des cellules ES est de leur fournir un environnement riche en facteurs de croissance nécessaire pour générer une expansion importante du nombre de ces cellules. Par contre, le rôle de la plupart des niches de cellules souches adultes se situe plus au niveau d un ralentissement du cycle cellulaire, de leur survie, du maintien de leur intégrité et de la maintenance du nombre des cellules souches en un réservoir de taille précise. Ici encore, plus de détails seront fournis dans la section «2.5.2 Quiescence». Cela n exclut pas le fait qu en situation de stress, de nouveaux signaux peuvent envahir la niche afin de contraindre les cellules souches à adopter un destin différent, tel l expansion ou l apoptose. La régulation des cellules souches de manière extrinsèque est très importante et offre beaucoup d espoir en médecine régénérative. Les facteurs extrinsèques capables de forcer l expansion du nombre de HSCs non modifiées génétiquement in vitro dans le but d améliorer l efficacité des transplantations de moelle osseuse représentent un intérêt médical majeur. Malheureusement, très peu de ces facteurs extrinsèques sont connus pour l instant et leur efficacité est plutôt limitée. Heureusement, nous avons maintenant les outils pour en identifier de nouveaux. C est là où se situe l objectif principal de cette thèse.
36 Sources Documentaires Barreto, G., Schafer, A., Marhold, J., Stach, D., Swaminathan, S.K., Handa, V., Doderlein, G., Maltry, N., Wu, W., Lyko, F., et al. (2007). Gadd45a promotes epigenetic gene activation by repair-mediated DNA demethylation. Nature 445, Benveniste, P., Frelin, C., Janmohamed, S., Barbara, M., Herrington, R., Hyam, D., and Iscove, N.N. (2010). Intermediate-term hematopoietic stem cells with extended but timelimited reconstitution potential. Cell Stem Cell 6, Briggs, R., and King, T.J. (1952). Transplantation of Living Nuclei From Blastula Cells into Enucleated Frogs Eggs. Proc Natl Acad Sci U S A 38, Carro, M.S., Lim, W.K., Alvarez, M.J., Bollo, R.J., Zhao, X., Snyder, E.Y., Sulman, E.P., Anne, S.L., Doetsch, F., Colman, H., et al. (2010). The transcriptional network for mesenchymal transformation of brain tumours. Nature 463, Choi, J., Costa, M.L., Mermelstein, C.S., Chagas, C., Holtzer, S., and Holtzer, H. (1990). MyoD converts primary dermal fibroblasts, chondroblasts, smooth muscle, and retinal pigmented epithelial cells into striated mononucleated myoblasts and multinucleated myotubes. Proc Natl Acad Sci U S A 87, Cobaleda, C., Jochum, W., and Busslinger, M. (2007). Conversion of mature B cells into T cells by dedifferentiation to uncommitted progenitors. Nature 449, de Haan, G., Nijhof, W., and Van Zant, G. (1997). Mouse strain-dependent changes in frequency and proliferation of hematopoietic stem cells during aging: correlation between lifespan and cycling activity. Blood 89, de Haan, G., and Van Zant, G. (1999). Dynamic changes in mouse hematopoietic stem cell numbers during aging. Blood 93, Esteban, M.A., Xu, J., Yang, J., Peng, M., Qin, D., Li, W., Jiang, Z., Chen, J., Deng, K., Zhong, M., et al. (2009). Generation of induced pluripotent stem cell lines from Tibetan miniature pig. J Biol Chem 284, Feng, R., Desbordes, S.C., Xie, H., Tillo, E.S., Pixley, F., Stanley, E.R., and Graf, T. (2008). PU.1 and C/EBPalpha/beta convert fibroblasts into macrophage-like cells. Proc Natl Acad Sci U S A 105,
37 11 Gurdon, J.B., and Uehlinger, V. (1966). «Fertile» intestine nuclei. Nature 210, Karumbayaram, S., Novitch, B.G., Patterson, M., Umbach, J.A., Richter, L., Lindgren, A., Conway, A.E., Clark, A.T., Goldman, S.A., Plath, K., et al. (2009). Directed differentiation of human-induced pluripotent stem cells generates active motor neurons. Stem Cells 27, Kim, D., Kim, C.H., Moon, J.I., Chung, Y.G., Chang, M.Y., Han, B.S., Ko, S., Yang, E., Cha, K.Y., Lanza, R., et al. (2009). Generation of human induced pluripotent stem cells by direct delivery of reprogramming proteins. Cell Stem Cell 4, Kondo, M., Scherer, D.C., Miyamoto, T., King, A.G., Akashi, K., Sugamura, K., and Weissman, I.L. (2000). Cell-fate conversion of lymphoid-committed progenitors by instructive actions of cytokines. Nature 407, Lako, M., Armstrong, L., and Stojkovic, M. (2010). Induced Pluripotent Stem Cells : It Looks Simple But can Looks Deceive? Stem Cells. Li, W., Wei, W., Zhu, S., Zhu, J., Shi, Y., Lin, T., Hao, E., Hayek, A., Deng, H., and Ding, S. (2009). Generation of rat and human induced pluripotent stem cells by combining genetic reprogramming and chemical inhibitors. Cell Stem Cell 4, Liang, Y., Van Zant, G., and Szilvassy, S.J. (2005). Effects of aging on the homing and engraftment of murine hematopoietic stem and progenitor cells. Blood 106, Liao, J., Cui, C., Chen, S., Ren, J., Chen, J., Gao, Y., Li, H., Jia, N., Cheng, L., Xiao, H., et al. (2009). Generation of induced pluripotent stem cell lines from adult rat cells. Cell Stem Cell 4, Liu, H., Zhu, F., Yong, J., Zhang, P., Hou, P., Li, H., Jiang, W., Cai, J., Liu, M., Cui, K., et al. (2008). Generation of induced pluripotent stem cells from adult rhesus monkey fibroblasts. Cell Stem Cell 3, Martinez-Fernandez, A., Nelson, T.J., Ikeda, Y., and Terzic, A. (2010). c-myc independent nuclear reprogramming favors cardiogenic potential of induced pluripotent stem cells. J Cardiovasc Transl Res 3, Nakagawa, M., Koyanagi, M., Tanabe, K., Takahashi, K., Ichisaka, T., Aoi, T., Okita, K., Mochiduki, Y., Takizawa, N., and Yamanaka, S. (2008). Generation of induced pluripotent stem cells without Myc from mouse and human fibroblasts. Nat Biotechnol 26,
38 12 Okita, K., Hong, H., Takahashi, K., and Yamanaka, S. (2010). Generation of mouse-induced pluripotent stem cells with plasmid vectors. Nat Protoc 5, Osawa, M., Hanada, K., Hamada, H., and Nakauchi, H. (1996). Long-term lymphohematopoietic reconstitution by a single CD34-low/negative hematopoietic stem cell. Science 273, Potten, C.S., and Loeffler, M. (1990). Stem cells: attributes, cycles, spirals, pitfalls and uncertainties. Lessons for and from the crypt. Development 110, Rossi, D.J., Bryder, D., Zahn, J.M., Ahlenius, H., Sonu, R., Wagers, A.J., and Weissman, I.L. (2005). Cell intrinsic alterations underlie hematopoietic stem cell aging. Proc Natl Acad Sci U S A 102, Stadtfeld, M., Nagaya, M., Utikal, J., Weir, G., and Hochedlinger, K. (2008). Induced pluripotent stem cells generated without viral integration. Science 322, Takahashi, K., Tanabe, K., Ohnuki, M., Narita, M., Ichisaka, T., Tomoda, K., and Yamanaka, S. (2007). Induction of pluripotent stem cells from adult human fibroblasts by defined factors. Cell 131, Takahashi, K., and Yamanaka, S. (2006). Induction of pluripotent stem cells from mouse embryonic and adult fibroblast cultures by defined factors. Cell 126, Tamada, H., Van Thuan, N., Reed, P., Nelson, D., Katoku-Kikyo, N., Wudel, J., Wakayama, T., and Kikyo, N. (2006). Chromatin decondensation and nuclear reprogramming by nucleoplasmin. Mol Cell Biol 26, Till, J.E., and Mc, C.E. (1961). A direct measurement of the radiation sensitivity of normal mouse bone marrow cells. Radiat Res 14, Till, J.E., McCulloch, E.A., and Siminovitch, L. (1964). A Stochastic Model of Stem Cell Proliferation, Based on the Growth of Spleen Colony-Forming Cells. Proc Natl Acad Sci U S A 51, Vierbuchen, T., Ostermeier, A., Pang, Z.P., Kokubu, Y., Sudhof, T.C., and Wernig, M. (2010). Direct conversion of fibroblasts to functional neurons by defined factors. Nature 463, Wilmut, I., Schnieke, A.E., McWhir, J., Kind, A.J., and Campbell, K.H. (1997). Viable offspring derived from fetal and adult mammalian cells. Nature 385, Woltjen, K., Michael, I.P., Mohseni, P., Desai, R., Mileikovsky, M., Hamalainen, R.,
39 13 Cowling, R., Wang, W., Liu, P., Gertsenstein, M., et al. (2009). piggybac transposition reprograms fibroblasts to induced pluripotent stem cells. Nature 458, Xie, H., Ye, M., Feng, R., and Graf, T. (2004). Stepwise reprogramming of B cells into macrophages. Cell 117, Yu, J., Hu, K., Smuga-Otto, K., Tian, S., Stewart, R., Slukvin, II, and Thomson, J.A. (2009). Human induced pluripotent stem cells free of vector and transgene sequences. Science 324, Yu, J., Vodyanik, M.A., Smuga-Otto, K., Antosiewicz-Bourget, J., Frane, J.L., Tian, S., Nie, J., Jonsdottir, G.A., Ruotti, V., Stewart, R., et al. (2007). Induced pluripotent stem cell lines derived from human somatic cells. Science 318, Zhou, H., Wu, S., Joo, J.Y., Zhu, S., Han, D.W., Lin, T., Trauger, S., Bien, G., Yao, S., Zhu, Y., et al. (2009). Generation of induced pluripotent stem cells using recombinant proteins. Cell Stem Cell 4, Zhou, Q., Brown, J., Kanarek, A., Rajagopal, J., and Melton, D.A. (2008). In vivo reprogramming of adult pancreatic exocrine cells to beta-cells. Nature 455, Zhou, W., and Freed, C.R. (2009). Adenoviral gene delivery can reprogram human fibroblasts to induced pluripotent stem cells. Stem Cells 27,
40 CHAPITRE 2 ÉTAT DE L ART Régulation Moléculaire des Cellules Souches Hématopoïétiques
41 15 2 Régulation Moléculaire des Cellules Souches Hé- matopoïétiques Parmi les cellules souches adultes, les cellules souches hématopoïétiques (HSCs) sont les plus connues et les plus exploitées en clinique. Certaines propriétés spécifiques aux HSCs les rendent plus facile à transplanter que tout autre type de cellule souche. Par exemple, il est facile d extraire les HSCs de la moelle osseuse, de leur appliquer différents traitements in vitro et de les réinjecter par voie intraveineuse. Elles retrouveront rapidement leur niche dans la moelle osseuse et reprendront leur fonction de régénération du système hématopoïétique. Les HSCs sont responsables du ravitaillement quotidien de tous les types de cellules matures du sang, y compris les cellules myéloïdes (monocytes et macrophages, neutrophiles, basophiles, éosinophiles, érythrocytes, mégacaryocytes/ plaquettes, cellules dendritiques) et lymphoïdes (lymphocytes T, lymphocytes B, cellules NK). Environ à cellules sanguines matures doivent être remplacées chaque jour dans un corps humain adulte (Sharma et al., 2006). Cette production massive est organisée en une hiérarchie de différenciation cellulaire (Figure 2.1). La définition standard d une HSC inclut une capacité de différenciation hématopoïétique multipotente ainsi CD34 - FLT3 - CD150 + CD48 - KLS CD34 + FLT3 - CD150 + CD48 - KLS CD34 + FLT3 - CD150 - CD48 + KLS CD34 + FLT3 + CD150 - CD48 + KLS LT-HSC ST-HSC MPP LMPP CMP CLP Mastocyte GMP MEP Cellules dentritique Basophile, Éosinophile, Neutrophile,Monocyte, Macrophage Érythrocyte, Mégakaryocyte, Plaquette Lymphocytes B, T, Cellules NK Figure 2.1 Organisation hiérarchique du développement du système hématopoïétique murin. Différentes sous-populations de HSCs arborant divers immunophénotypes (côté gauche) sont responsables de la production de toutes les cellules hématopoïétiques matures (côté droit). Les HSCs au sommet de la hiérarchie sont généralement quiescentes. L expression de CD34 corrèle avec l éveil des HSCs. Ensuite, les HSCs activent l expression of CD48, perdent l expression de CD150 et activent l expression de FLT3. Cette séquence d événements produit des sous-populations de MPPs et de LMPPs, qui génèrent différentes cellules progénitrices engagées avant l apparition des cellules totalement différenciées. KLS=KIT+Lin-SCA1+; LT- HSC=cellule souche hématopoïétique à long terme; ST-HSC=cellule souche hématopoïétique à court terme; MPP=cellule progénitrice multipotente; LMPP=cellule progénitrice multipotente
42 16 Plusieurs cellules progénitrices sont restreintes à une seule lignée, comme les celavec biais lymphoïde; CMP=cellule progénitrice myéloïde commune; CLP=cellule progénitrice lymphoïde commune; GMP=cellule progénitrice restreinte aux granulocytes et aux monocytes; MEP=cellule progénitrice restreinte aux mégacaryocytes et aux érythrocytes qu un potentiel soutenu d auto-renouvellement dans le temps. 2.1 Émergence Les HSCs constituent un réservoir de cellules d une taille définie qui colonisent différents sites au cours du développement, débutant par le sac vitellin. Les érythroblastes primitifs sont les premières cellules hématopoïétiques générées suite à la gastrulation dans le sac vitellin (Palis et al., 1999). La toute première HSC en mesure de reconstituer l ensemble du système hématopoïétique d une souris adulte apparaît dans la région de l aorte, des gonades et du mésonéphros (AGM) de l embryon au jour embryonnaire (E) 10,5 (Medvinsky and Dzierzak, 1996). Les HSCs colonisent ensuite plusieurs endroits extrahépatiques entre E Entre E , une expansion spectaculaire du nombre de HSCs se produit juste avant que ces cellules ne colonisent le foie du fœtus. En fait, un total de 3-10 HSCs se retrouvent dans l ensemble du corps à E11.5, alors que ce nombre augmente à HSCs à E12.5 (Gekas et al., 2005; Kumaravelu et al., 2002). Il a été suggéré que le placenta puisse aussi constituer une niche et un lieu de production de HSCs avant la colonisation du foie (Rhodes et al., 2008). Chronologiquement, le dernier tissu hématopoïétique à être colonisé par les HSCs au cours du développement est la moelle osseuse, qui est le seul tissu en mesure de produire tous les types de cellules hématopoïétiques après la naissance (Clapp et al., 1991). 2.2 Évaluation Fonctionnelle Plusieurs méthodes de détection des HSCs ont été développées in vitro et in vivo. La plupart de ces méthodes reposent sur la capacité des HSCs à s auto-renouveler et à produire des cellules différenciées dans chacune des lignées hématopoïétiques. Considérant que les cellules progénitrices dépourvues de toute capacité d auto-renouvellement épuisent rapidement leur compétence à produire une descendance mature, la production à long terme de cellules différenciées peut s avérer un indicateur rétrospectif utile de l auto-renouvellement Méthodes d Évaluation In Vitro
43 17 lules progénitrices granulocytaires, macrophagiques, mégacaryocytaires et érythroïdes, et peuvent être identifiées en utilisant une méthode de quantification de colonies à court terme sur milieu semi-solide (méthylcellulose ou agar) enrichis de diverses cytokines (Broxmeyer, 1984). Le nombre de colonies formées à la fin de l expérience dépend du nombre de cellules formant des colonies (CFC) mises en culture initialement. Cependant, ce test ne permet pas la détection des cellules progénitrices plus immatures ni des HSCs en raison de la stabilité limitée du milieu de culture semi-solide, c est-à-dire généralement moins de trois semaines. Alternativement, les cellules progénitrices immatures peuvent être dénombrées en utilisant des méthodes in vitro à plus long terme comme la méthode des cellules initiant des cultures à long terme (LTC-IC) (Dexter et al., 1977) ou bien la méthode des cellules formant des zones pavées (CAFC) (Ploemacher et al., 1989). Au cours de ces expériences, les cellules hématopoïétiques sont généralement cultivées en présence de cellules nourricières. Par exemple, des fibroblastes, qui produisent des facteurs de soutien et agissent comme une niche pour les HSCs. La fréquence en LTC-IC peut être déterminée en mesurant la quantité de CFCs au bout de 5 à 8 semaines de culture, en dilution limite et en utilisant la méthode statistique de Poisson (Pettengell et al., 1994). Il est possible que les CAFCs se chevauchent avec les LTC-ICs. Par contre, les CAFCs ont un comportement particulier : elles s imbriquent dans la couche de cellules adhérentes et forment une zone pavée, qui représente un amas compact et optiquement dense de cellules. Plusieurs CAFCs sont facilement visibles à l œil nu 28 à 35 jours après le début de la culture, mais doivent également être dénombrées en dilution limite (Ploemacher et al., 1991). Chez la souris adulte, la fréquence en LTC-ICs et en CAFCs au sein de la fraction Sca1 + Lin - des cellules de moelle osseuse est d environ 1/42 et 1/15, respectivement (Coulombel, 2004). Chez l humain adulte, la fréquence en LTC-ICs et CAFCs au sein de la fraction CD34 + des cellules de moelle osseuse est d environ 1-80/1000 et 0.36/1000, respectivement (Coulombel, 2004). Ces tests in vitro peuvent certainement servir de première étape de criblage lors de la quantification de HSCs car les résultats sont obtenus plutôt rapidement, c est-à-dire en 4 à 5 semaines. Toutefois, ils ne garantissent pas une mesure précise du nombre de HSCs. Ces tests ne peuvent que nous donner un indice sur la pertinence d effectuer des expériences plus poussées de reconstitution à long terme du système hématopoïétique Méthodes d Évaluation In Vivo Les tests de reconstitution à long terme du système hématopoïétique in vivo sont beaucoup plus efficaces pour déterminer le nombre de HSCs et leur potentiel fonctionnel dans un échantillon donné. Le potentiel fonctionnel sous-entend la capacité des HSCs
44 18 à reconstituer un système hématopoïétique entier pendant de longues périodes de temps lorsqu elles sont transplantées dans des individus receveurs préalablement irradiés. La reconstitution hématopoïétique est généralement évaluée par la capacité de générer des monocytes, des granulocytes et des lymphocytes dans la circulation sanguine à différents moments post-transplantation. Cette méthode permet la classification des HSCs en souspopulations fonctionnellement différentes. Seules les HSCs à long terme (LT-HSCs) sont en mesure de soutenir le système hématopoïétique pour toute la durée de vie d un animal (Yilmaz et al., 2006a). Les HSCs à moyen terme (IT-HSCs) subsistent pendant 6 à 8 mois suivant la transplantation (Benveniste et al., 2010). Les HSCs à court terme (ST-HSCs) persistent pendant seulement 4 à 6 semaines post-transplantation (Yang et al., 2005). La capacité de maintenance des cellules progénitrices multipotentes (MPPs) ne dépasse généralement pas 8 semaines post-transplantation (Morrison and Weissman, 1994). La méthode la plus rigoureuse pour évaluer le potentiel fonctionnel des LT-HSCs est la transplantation en série, qui implique invariablement des divisions d auto-renouvellement (Rosendaal et al., 1979). La méthode de reconstitution hématopoïétique compétitive (CRA) procure des informations qualitatives et semi-quantitatives quant à la capacité de reconstitution des HSCs. La CRA s effectue en comparaison avec des cellules de moelle osseuse compétitrices (Harrison, 1980). Le nombre d unités de reconstitution hématopoïétique (RU) dans l échantillon testé est généralement déterminé en divisant le niveau de reconstitution dérivé des cellules du donneur par le niveau de reconstitution dérivé des cellules du receveur, à condition que le nombre de cellules de moelle osseuse compétitrices soit compris entre 1x10 5 et 2x10 7, et en multipliant le nombre de RU testées par le nombre de RU (n) compétitrices, où n=1x10 5 cellules de moelle osseuse totale (Harrison et al., 1993). Toutefois, la CRA ne définit pas précisément le nombre absolu de HSCs dans un échantillon donné. Le décompte précis des HSCs ne peut être réalisé qu en utilisant un test de dilution limite (LDA) (Szilvassy et al., 1990). En bref, la fréquence des HSCs, ou des unités de reconstitution hématopoïétique compétitive (CRUs), peut être estimée à partir des données obtenues suite à la transplantation d une série de dilutions différentes de l échantillon à tester en présence d un nombre défini de cellules compétitrices de moelle osseuse. Typiquement, une reconstitution est considérée positive lorsque qu au moins 1% des cellules dérivées du donneur se retrouvent à la fois dans les lignées myéloïdes et lymphoïdes, 3 à 4 mois post-transplantation. Plus simplement, une reconstitution érythroïde indique sans faute qu il y a eu reconstitution myéloïde et lymphoïde (Iscove N, communication orale). La fréquence en CRUs est mesurée en utilisant la méthode statistique de Poisson, qui considère qu une seule HSC est à l origine de la reconstitution du système hématopoïétique lorsque 63% des individus receveurs sont positivement reconstitués pour une
45 19 dilution donnée. Cependant, le test ultime pour le décompte des HSCs demeure le LDA avec transplantation dans des souris mutantes W41/W41, qui ont une réponse défectueuse au facteur de cellule souche (SCF) et qui sont par conséquent déficientes en HSCs (Miller et al., 1997). Ce système, avec lequel le taux de reconstitution hématopoïétique est typiquement de 25 à 50%, est considéré «quantique» ou sans équivoque. Par conséquent, ce système est beaucoup plus fiable que celui des souris de type sauvage qui s appuie sur un seuil arbitraire de 1%, ou même parfois de 0,1%, pour déterminer la positivité d une reconstitution hématopoïétique. En ce qui a trait aux HSCs humaines, la souche de souris receveuse la plus efficace jusqu à maintenant pour déterminer le nombre de CRUs humaines est la souris diabétique non obèse (NOD) immunodéficiente combinée sévère (SCID) mutante pour IL2RG (NSG). Les souris NSG permettent une greffe de cellules hématopoïétiques hétérologues beaucoup plus efficacement qu avec n importe quel autre modèle de rongeur immunodéficient (Ito et al., 2002). 2.3 Discrimination Phénotypique De récents progrès ont permis de purifier des HSCs murines et humaines en utilisant des méthodes basées sur le tri de cellules activées par fluorescence (FACS) et des combinaisons complexes de marqueurs de surface cellulaire. Ces avancées ont amélioré l analyse des HSCs au niveau clonal et ont changé notre perception de la HSC d un point de vue conceptuel et qualitatif à un point de vue réaliste et quantitatif. Dans la moelle osseuse de souris adulte, toutes les HSCs fonctionnelles se trouvent dans la sous-population KIT + Lin - Sca1 + (KLS), qui est néanmoins très hétérogène. En effet, moins de 10% des cellules KLS ont la capacité de reconstituer un système hématopoïétique entier chez des souris irradiées, pendant de longues périodes de temps. Cependant, des marqueurs de surface supplémentaires peuvent être utilisés en combinaison pour obtenir des fractions de HSCs plus pures comme THY1 (CD90) (Goldschneider et al., 1978), CD34 (Baines et al., 1988), FLT3 (CD135) (Matthews et al., 1991) et SLAM (CD150, CD244, CD48 et CD41) (Kiel et al., 2005) (Figure 2.1). Par exemple, les LT-HSCs (CD34 - FLT3 - KLS) peuvent être séparées des ST-HSCs (CD34 + FLT3 - KLS) et des MPPs (CD34 + FLT3 + KLS) (Yang et al., 2005). En outre, la capacité d expulser des colorants se fixant aux mitochondries ou à l ADN, tels que la rhodamine 123 (Rho123) ou Hoechst 33342, respectivement, peut être utilisée afin d améliorer la purification des HSCs (Li and Johnson, 1992; McAlister et al., 1990). Selon des études de reconstitution clonale de cellules individuelles, les cellules KLS peuvent être séparées en LT-HSCs et
46 20 en ST-HSCs en se basant sur l expression de CD34 et de FLT3 ainsi que sur l exclusion de Rho123. De plus, la fraction de LT-HSCs peut être séparée de celle des IT-HSCs selon l expression différentielle de CD49b (Benveniste et al., 2010). En fait, la sous-population de HSCs fonctionnelles la plus pure signalée à ce jour chez la souris présente le phénotype CD150 + CD48 - CD41 - KLS avec une fréquence de reconstitution multipotente à long terme de 47% (Kiel et al., 2005). Autrement dit, une cellule sur deux est une LT-HSC. Dans le foie fœtal murin, 37% des cellules CD150 + CD48 - Lin - Sca1 + CD11b + arborent un potentiel de reconstitution du système hématopoïétique à long terme (Kim et al., 2006). En dépit de ces progrès considérables, il est encore impossible de définir une LT-HSC exclusivement par l expression de marqueurs de surface. Chez l humain, l isolation prospective de HSCs peut être effectuée en triant la souspopulation CD34 + CD90 + Lin -, qui démontre une capacité clonogénique enrichie et génère une descendance myéloïde et lymphoïde lors de culture à long terme in vitro (Baum et al., 1992). La concentration des HSCs humaines au sein de la population CD34 + peut également être accrue en excluant les cellules qui expriment le marqueur de surface CD38 (Terstappen et al., 1991) et CD45RA (Mayani et al., 1993). En fait, il a été démontré par dilution limite que les cellules capables de reconstituer le système sanguin de souris NOD/ SCID (SRCs) résident dans la fraction CD34 + CD38 - à une concentration de une SRC par 617 cellules (Bhatia et al., 1997). Récemment, une étude sur l expression différentielle de molécules d adhésion entre une sous-population enrichie en HSCs humaines (CD90 + ) et une sous-population appauvrie (CD90 - ) a identifié ITGA6 (CD49f) comme étant le seul marqueur de surface exprimé à un niveau supérieur au sein de la fraction CD90 + (Notta et al., 2011). En utilisant des techniques de transplantation de cellule unique et en série dans des souris immunodéficientes, ces auteurs ont estimé à 28% la fréquence en LT-HSCs dans la sous-population CD90 + Rho lo CD49f +, ce qui représente un progrès significatif dans le domaine de la purification des HSCs humaines. Bien que la quantification des HSCs basée sur des marqueurs de surface soit très précise avec des cellules fraîchement isolées, elle devient beaucoup moins fiable pour la majorité des marqueurs de surface avec des HSCs cultivées in vitro. En effet, les conditions de culture in vitro placent les cellules sous d intenses pressions sélectives qui peuvent induire des changements imprévus au niveau de l immunophénotype, souvent par l internalisation ou la dégradation des marqueurs de surface (Uchida et al., 2003). En conséquence, les propriétés fonctionnelles devraient avoir la priorité sur l expression des marqueurs de surface quant à la quantification des HSCs.
47 Cinétique de Prolifération L hypothèse de la succession clonale a été proposée il y a plus de 45 ans. Elle implique que seulement un ou quelques clones de HSCs donnent naissance à des cellules sanguines matures à tout moment, et que les autres HSCs au repos ne contribuent pas à l hématopoïèse jusqu à ce que la capacité de prolifération du clone actif soit épuisée (Kay, 1965). Cette hypothèse fut confirmée par des expériences de marquage rétroviral durant lesquelles seulement un ou quelques clones de LT-HSCs contribuaient à la production de cellules sanguines à tout moment (Capel et al., 1989; Lemischka et al., 1986; Snodgrass and Keller, 1987). Cependant, il faut se rappeler que la méthode de reconstitution hématopoïétique n est peut-être pas la plus appropriée pour tester l hypothèse de la succession clonale car elle n est pas représentative de l hématopoïèse à l état stable. En dépit de l hypothèse de la succession clonale, il a été démontré que plusieurs HSCs peuvent contribuer simultanément à l hématopoïèse chez des souris chimériques dans lesquelles les HSCs ont été dérivées de cellules ES (Harrison et al., 1987). En utilisant une méthode d incorporation de bromodésoxyuridine (BrdU) à l ADN, certains ont exploré la possibilité que seuls certains sous-groupes de HSCs sont actifs à différentes périodes au cours de la vie d un animal (Cheshier et al., 1999). Les résultats de ces expériences ne confirment pas l hypothèse de la succession clonale car ils montrent que les LT-HSCs entrent en cycle cellulaire de manière asynchrone et que 99% d entre elles se divisent tous les 57 jours en moyenne. Ainsi, aucun sous-ensemble de LT-HSCs ne semble demeurer quiescent pendant de longues périodes de temps. Des souris transgéniques exprimant une protéine de fusion de l histone H2B avec la protéine fluorescente verte (GFP-H2B) semblent permettre une analyse plus précise que la méthode d incorporation de BrdU en ce qui a trait à l histoire proliférative des HSCs (Foudi et al., 2009). Par exemple, pratiquement toutes les HSCs sont fluorescentes avec une intensité plus élevée. De plus, le taux de prolifération des HSCs est étonnamment hétérogène. Environ 20% des HSCs se divisent à un taux extrêmement faible (0,8 à 1,8% par jour). Ces résultats sont compatibles avec les conclusions de l étude de l incorporation de BrdU, à savoir que toutes les HSCs entrent en division cellulaire un jour ou l autre. L hypothèse de la succession clonale semble donc invalide. Chez l humain, le taux de prolifération moyen des HSCs in vivo est plus difficile à évaluer étant donné que les méthodes d irradiation et de reconstitution hématopoïétique utilisées chez la souris ne sont pas moralement admissibles chez des humains sains. Toutefois, une étude récente sur le rapport d échange du chromosome X maternel/paternel dans des cellules sanguines féminines a révélé que le taux de réplication des HSCs humaines est en moyenne une fois toutes les 40 semaines (Catlin et al., 2011). Ainsi, ce
48 22 taux est plus faible que celui observé chez les primates non humains, qui est établi à une fois par 25 semaines (Shepherd et al., 2007). Le taux de réplication des HSCs humaines est également beaucoup plus faible que celui observé chez le chat ou chez la souris, qui a été calculé à une fois par 8,3 et 2,5 semaines, respectivement (Abkowitz et al., 2000). 2.5 Destin Cellulaire La division d une HSC génère habituellement deux cellules-filles qui adoptent ou non des propriétés différentes de celles de la cellule-mère. Si elles ne le font pas, chaque cellule-fille échappe à la différenciation et demeure pratiquement identique à la cellulemère, par division symétrique d auto-renouvellement (Figure 2.2A). Ce type de division cellulaire se produit fréquemment au cours du développement, ou lors de reconstitution hématopoïétique, et conduit à une expansion de la taille de la réserve en cellules souches. En revanche, un épuisement de cette réserve est observé lorsque les deux cellules-filles acquièrent des propriétés différentes de celles de la cellule-mère, ou se différencient, par division symétrique de différenciation (Figure 2.2C). En condition de stress, la taille de la réserve de HSCs peut être maintenue grâce à A) Auto-renouvellement symétrique B) Auto-renouvellement asymétrique C) Différenciation symétrique S S S S D D D D D D D D D Figure 2.2 La taille de la réserve de HSCs est influencée par différents types de division cellulaire. (A) Chacune des deux cellulesfilles conserve le même caractère souche que la cellule-mère par auto-renouvellement symétrique. (B) Seulement une des deux cellulesfilles demeure une cellule souche, par auto-renouvellement asymétrique, et l autre se différencie. (C) Chacune des deux cellulesfilles se différencie par différenciation symétrique. S=cellule souche; D=cellule différenciée un équilibre finement contrôlé entre les divisions symétriques d auto-renouvellement et de différenciation. Mais en condition normale, il est généralement présumé qu une cellule-mère donne naissance à une cellule-fille identique et à une cellule-fille différenciée, par division asymétrique (Figure 2.2B). Ce processus homéostatique maintient un nombre constant de HSCs dans le temps. Deux mécanismes différents peuvent conduire à une division asymétrique des cellules souches (Figure 2.3). Premièrement, l asymétrie peut se produire avant que la division cellulaire ne soit terminée, par asymétrie divisionnelle. L asymétrie divisionnelle implique que les déterminants du destin cellulaire sont préférentiellement séquestrés à
49 23 une seule des deux cellules-filles, avec l aide de l orientation du plan de clivage, donnant naissance à une cellule souche et à une cellule différenciée (Figure 2.3A et B). Ce mécanisme est bien documenté chez la mouche Drosophila melanogaster et chez le ver Caenorhabditis elegans (Roegiers and Jan, 2004). Deuxièmement, l asymétrie peut se produire après que la division cellulaire soit complétée, par asymétrie environnementale. L asymétrie environnementale implique que les deux cellules-filles trempent dans différents microenvironnements locaux et soient mises en contact avec différents signaux externes (Figure 2.3D). Bien que la division asymétrique environnementale génère deux cellules-filles identiques, une seule demeure souche à l endroit de la division tandis que l autre est relocalisée dans un microenvironnement différent et entre en contact avec des facteurs stimulant la différenciation (Ohlstein et al., 2004). Les divisions de cellules souches adultes chez les vertébrés sont plutôt difficiles à visualiser in vivo, mais il est possible que les HSCs utilisent à la fois la division asymétrique divisionnelle et la division asymétrique environnementale pour produire des cellules différenciées. Intrinsèque Extrinsèque A Pré-mitotique D C S S Post-mitotique D S S B D D D S S S S Figure 2.3 La division asymétrique des cellules souches peut être accomplie par différents mécanismes. (A) La distribution asymétrique d un facteur intrinsèque (voir l étoile jaune) à l intérieur de la cellule-mère, avant la division cellulaire, génère une cellule souche et une cellule différenciée. (B) La présence d un facteur extrinsèque, avant la division de la cellule-mère, est responsable de la production d une cellule souche et d une cellule différenciée. Ces différents destins cellulaires peuvent aussi être obtenus après la division de la cellule-mère, par un mécanisme aléatoire (C), ou par interaction avec le microenvironnement (D). S=cellule souche; D=cellule différenciée Tel que mentionné ci-dessus, les décisions relatives au destin cellulaire peuvent être intrinsèquement régies par la séquestration différentielle de déterminants du destin cellulaire, mais peuvent également être influencées par un réseau complexe de molécules présentes dans le microenvironnement, communément appelé «niche», où résident habituellement les HSCs.
50 Niche En général, la niche représente un endroit où vivent les cellules souches étroitement liées à une ou plusieurs cellules nourricières. Les cellules souches sont maintenues dans leur niche en un réservoir de taille définie. Le concept d une niche essentielle à maintenance des HSCs a d abord été postulé suite à l étude de deux souches de souris devenues déficientes en mastocytes par mutations spontanées, c est-à-dire la souche W (Russell, 1949) et la souche S1 (Mayer and Green, 1968). Trois observations majeures ont été relevées : 1) le système hématopoïétique des souris mutantes W, mais pas des S1, est reconstitué suite à la transplantation de cellules de moelle osseuse provenant de souris de type sauvage; 2) le système hématopoïétique de souris de type sauvage ou mutantes S1 n est pas reconstitué lorsque les cellules de moelle osseuse provenant de souris mutantes W sont transplantées; 3) le système hématopoïétique de souris mutantes W est reconstitué lorsque les cellules de moelle osseuse provenant de souris mutantes S1 sont transplantées. De ces observations, il fut conclu que le gène sur le locus W est nécessaire pour la fonction des HSCs et que le gène sur le locus S1 est essentiel pour les cellules microenvironnementales non hématopoïétiques requises pour l hématopoïèse (Jarboe and Huff, 1989). Le gène mystérieux situé sur le locus W a été finalement identifié comme étant KIT (Nocka et al., 1989) et le gène situé sur le locus S1 a été identifié comme étant que le ligand de KIT, c est-à-dire SCF (Zsebo et al., 1990). À cette époque, il devint évident que des interactions directes entre les HSCs et la niche sont cruciales pour la préservation du système hématopoïétique. Dans cette optique, «l hypothèse de la niche» a postulé, il y a plus de 30 ans, que le contact intime entre les HSCs et les cellules de la moelle osseuse était responsable de la préservation de la capacité de prolifération des HSCs (Schofield, 1978). Cette homéostasie maintient un nombre défini de LT-HSCs en quiescence qui servent de réserve de cellules souches prêtes à être activées à tout moment en réponse à des signaux de lésions hématopoïétiques (Adams and Scadden, 2006). Curieusement, le nombre absolu de HSCs par individu semble être conservé entre espèces de taille très différentes telles que la souris, le chat et l homme, c est-à-dire environ HSCs par individu (Abkowitz et al., 2002). Différentes niches peuvent abriter des HSCs à différentes étapes du développement de l organisme comme le sac vitellin, la région aortique, le placenta et le foie fœtal. Par contre, les LT-HSCs adultes vivent principalement dans les niches endostéales (Zhang et al., 2003) et endothéliales (Kiel et al., 2005) de la moelle osseuse. Différentes stratégies de marquage in vivo ont révélé la localisation et l attachement physique des HSCs au niveau de la cavité endostéale et de la vascularisation des os (Lo Celso et al., 2009; Nilsson
51 25 et al., 2001; Xie et al., 2009). Les HSCs sont périodiquement en mouvement grâce à des extensions membranaires hautement dynamiques et à une motilité rapide (Frimberger et al., 2001). En fait, les HSCs peuvent quitter et regagner leur niche à tout moment en réponse à des signaux spécifiques. Ces mécanismes sont connus sous le nom de mobilisation et de retour à la niche. Les HSCs qui se trouvent dans la circulation sanguine sont recrutées dans les capillaires de la moelle osseuse et migrent à travers l endothélium jusqu aux niches hématopoïétiques extravasculaires de la moelle osseuse (Nilsson and Simmons, 2004). Certaines molécules d adhérence de surface cellulaire sont essentielles pour le retour des HSCs dans la niche de la moelle osseuse, comme les sélectines et les intégrines (Lapidot et al., 2005). Par exemple, les HSCs déficientes en intégrine beta 1 (ITGB1) n arrivent pas à trouver leur chemin jusqu à la niche de la moelle osseuse suite à une transplantation (Potocnik et al., 2000) Ostéoblastes Différents types de cellules nourricières participent à la maintenance des HSCs dans la niche de la moelle osseuse (Figure 2.4). L étude de souris déficientes en Runx2 a révélé de graves problèmes de développement des os ainsi qu une défaillance hématopoïétique en raison d une capacité de différenciation restreinte des ostéoblastes (Deguchi et al., 1999). Cependant, ces souris présentent une hématopoïèse extramédullaire fonctionnelle. Par exemple, on a noté une augmentation de 3 fois du nombre d unités formant des colonies en culture (CFU-C) dans la rate des souris Runx2 -/- par rapport aux souris Runx2 +/+ à E18.5. Ces résultats suggèrent que les ostéoblastes pourraient être requis pour le maintien des HSCs dans la niche de la moelle osseuse (Figure 2.4). Par la suite, des études ont montré une corrélation directe entre le nombre d ostéoblastes et de HSCs. Une de ces études a révélé une augmentation de 2,2 fois du nombre de CRUs, accompagnée d une augmentation de 3 fois du nombre d ostéoblastes dans des souris mutantes pour le gène Bmpr1a par rapport aux souris de type sauvage (Zhang et al., 2003). De plus, les HSCs et les ostéoblastes étaient physiquement connectés par la N-cadhérine (CDH2) et la beta-caténine (CTNNB1), ce qui suggère que ce contact adhésif pourrait être important pour soutenir la fonction des HSCs dans la niche de la moelle osseuse. Une autre étude a montré que le traitement à l hormone parathyroïdienne augmente le nombre d ostéoblastes de 4 fois ainsi que la fréquence en LTC-IC de près de 3 fois, par amplification de la voie de signalisation Notch (Calvi et al., 2003). Aussi, l élimination sélective des ostéoblastes entraîne une perte de 3 à 10 fois du nombre de cellules KLS dans la moelle osseuse, accompagnée d une hématopoïèse extramédullaire (Visnjic et al., 2004). Collectivement, ces résultats soutiennent l hypothèse selon laquelle
52 Diaphyse 26 Épiphyse Os compact Adipocyte THPO THPO Moelle osseuse MPL MSC HSC HSC KIT HSC HSC HSC SCF JAG1 NOTCH1 Macrophage TGFB BMPs HSC ANGPT1 TEK HSC ANGPT1 HSC Frizzled Wnt MSC Wnt Ostéoblaste Ostéoclaste Figure 2.4 Représentation schématique de la niche des HSCs dans la moelle osseuse. Les interactions ligands/récepteurs entre les HSCs et les cellules stromales de la niche activent des voies de signalisation qui influencent le destin des HSCs. ANGPT1=angiopoïétine 1; BMPs=protéines morphogènes des os; HSC=cellule souche hématopoïétique; JAG1=Jagged1; KIT=récepteur du facteur de cellule souche; MPL=protéine de la leucémie myéloproliférative; MSC=cellule souche mésenchymateuse; SCF=facteur de cellule souche; TEK=récepteur tyrosine kinase 2; TGFB=facteur de croissance transformant beta; THPO=thrombopoïétine les ostéoblastes représentent un élément essentiel à la niche des HSCs (Figure 2.4) Ostéoclastes Les ostéoclastes semblent également jouer un rôle important dans la niche des HSCs (Figure 2.4). Contrairement aux ostéoblastes, qui sont responsables de la formation de la
53 27 matrice osseuse, les ostéoclastes sont responsables de la résorption de la matrice osseuse et du relâchement de quantités élevées de calcium lié à l hydroxyapatite. Ce calcium interagit avec les détecteurs de calcium situés sur la surface des HSCs, ce qui est important pour retenir les HSCs à proximité de la surface endostéale (Adams et al., 2006). Les ostéoclastes sont directement impliqués dans la mobilisation des HSCs dans la circulation sanguine en clivant le facteur dérivé de cellules stromales (CXCL12) à l aide la cathepsine K (Kollet et al., 2006). Fait intéressant, les ostéoclastes sont responsables du maintien de cellules leucémiques Ba/F3-p210 dans un état de dormance in vitro, probablement par la sécrétion de facteur de croissance transformant beta (TGFB) (Yokota et al., 2010). En outre, l entrave à la fonction des ostéoclastes à l aide de bisphosphonate, un agent anti-résorption qui induit sélectivement l apoptose des ostéoclastes, engendre une perte significative du nombre de HSCs in vivo (Lymperi et al., 2011). Notamment, les auteurs de cette étude suggèrent que l élimination des ostéoclastes pourrait mener à une réduction de l espace disponible dans la niche de la moelle osseuse, en dessous du minimum requis pour un maintien adéquat du nombre de HSCs. Ce phénomène est couramment observé chez des souris ostéopétrotique (Wiktor-Jedrzejczak et al., 1982). En dépit de ces constatations, il est possible que la réduction de l activité des ostéoclastes diminue le taux de remplacement ou l activité des ostéoblastes, et empêche donc la formation de nouvelle niche ostéoblastique. Dans ce cas, le rôle des ostéoclastes dans la niche des HSCs serait indirect. À cet égard, une étude récente a démontré qu une perte d activité des ostéoclastes perturbe la formation de la niche des HSCs dans la moelle osseuse via une inhibition spécifique de la différenciation des ostéoblastes (Mansour et al., 2012). Ces résultats indiquent que les ostéoclastes actifs sont essentiels à la formation de la niche ostéoblastique des HSCs (Figure 2.4) Macrophages Les macrophages au sein de la moelle osseuse ont sensiblement un rôle à jouer dans le maintien de la niche des HSCs (Figure 2.4). En effet, l administration de facteur stimulant la formation de colonies de granulocytes (CSF3) à des souris cause une réduction du nombre de macrophages dans la moelle osseuse (Winkler et al., 2010). Cette perte s avère suffisante pour épuiser les ostéoblastes de l endostéum et réduire la production de CXCL12, de SCF et d angiopoïétine 1 (ANGPT1). Tout cela a pour effet d entraîner la mobilisation des HSCs dans la circulation sanguine. Cependant, il reste à déterminer quel facteur promeut la suppression des ostéoblastes car ceux-ci n expriment normalement pas le récepteur de CSF3 (CSF3R) Cellules Souches Mésenchymateuses Les cellules souches mésenchymateuses (MSCs) exprimant la nestine (NES) re-
54 28 présentent aussi un élément important de la niche des HSCs (Mendez-Ferrer et al., 2010) (Figure 2.4). Les MSCs NES + peuvent s auto-renouveler en tant que mésensphères non adhérentes et se multiplier lors de transplantation en série. Ces cellules sont étroitement associées aux HSCs dans la moelle osseuse. Une déplétion sélective des MSCs in vivo entraîne une perte de 50% des cellules CD150 + CD48 - KLS dans la moelle osseuse. Ces résultats évoquent une nouvelle collaboration entre deux types différents de cellules souches adultes, c est-à-dire les MSCs et les HSCs, dans l établissement d une nouvelle niche pour les HSCs. Collectivement, ces études convergent vers une même réalité : la niche de la moelle osseuse contient de nombreux facteurs qui sont extrinsèques aux HSCs mais cruciaux pour leur maintenance (Figure 2.4). L intérêt majeur pour les HSCs de demeurer associées à leur niche est de maintenir un état de quiescence, ce qui préserve leur caractère souche Quiescence Malgré le vaste potentiel d auto-renouvellement des HSCs observé lors d expériences de transplantation en série chez des souris irradiées, leur prolifération est limitée en condition normale in vivo. La quiescence est maintenue par la niche afin de protéger l intégrité et le caractère souche des HSCs pour de longues périodes de temps. Tel que mentionné précédemment, les HSCs murines entrent en cycle cellulaire environ une fois tous les deux mois en moyenne (Cheshier et al., 1999). Cet état d hibernation est préservé grâce à une signalisation dynamique d une série de ligands, de récepteurs, de molécules d adhésion et de facteurs intracellulaires tels que TGFB (Fortunel et al., 2000), JAG1 (Calvi et al., 2003), ANGPT1 et TEK (Arai et al., 2004), CXCL12 et CXCR4 (Sugiyama et al., 2006), SCF et KIT (Thoren et al., 2008), THPO et MPL (Qian et al., 2007), ELF4 (Lacorazza et al., 2006), CDC42 (Yang et al., 2007), PBX1 (Ficara et al., 2008), FBXW7 (Thompson et al., 2008) et HIF1A (Takubo et al., 2010) (Figure 2.4). En condition de stress, une prolifération cellulaire non limitée peut conduire à un épuisement prématuré des HSCs et à une défaillance générale du système hématopoïétique. Par exemple, les souris déficientes en p21 Cip1 (Cdkn1a), un médiateur important de la quiescence, présentent un taux de prolifération cellulaire accru menant à l épuisement des HSCs lors de transplantation en série (Cheng et al., 2000). Le regroupement de radeaux lipidiques à la surface cellulaire active une cascade de signalisation sonnant le réveil des HSCs (Yamazaki et al., 2006). Les microdomaines de radeaux lipidiques sont des plaques enrichies en cholestérol et en glycosphingolipides au niveau de la membrane cytoplasmique. Ils agissent comme une plate-forme de lancement pour plusieurs fonctions cellulaires telles que la signalisation de cytokines, le trafic
55 29 membranaire et l organisation du cytosquelette. Le regroupement de radeaux lipidiques peut être stimulé par des cytokines dans le but d activer l axe de signalisation PI3K-AKT- FOXO et de contraindre les HSCs et les cellules progénitrices à proliférer (Yamazaki et al., 2006). Inversement, l entrave au regroupement de radeaux lipidiques inactive l axe de signalisation PI3K-AKT-FOXO et force l accumulation de facteurs de transcription FOXO dans le noyau cellulaire, déclenchant l hibernation des HSCs ex vivo. Fait intéressant, ce phénomène partage des similitudes frappantes avec celui du stade dauer chez le nématode Caenorhabditis elegans, qui se produit lorsque l environnement est défavorable en termes d approvisionnement alimentaire, de température ou de reproduction (Fielenbach and Antebi, 2008). Le stade dauer permet de survivre à des conditions sévères pendant de longues périodes de temps. Ainsi, l inhibition du regroupement de radeaux lipidiques pourrait représenter un mécanisme de protection conservé entres espèces au cours de l évolution afin d éviter l épuisement des cellules souches lorsque plongées dans un microenvironnement hostile Interprétation des Stimuli Extracellulaires Tel qu avancé dans la section précédente, plusieurs molécules retrouvées dans le microenvironnement externe des HSCs influencent littéralement leur sort. Ces molécules peuvent être solubles, composantes de la matrice extracellulaire ou bien ancrées à la membrane cytoplasmique des cellules adjacentes. Certaines molécules ont le pouvoir d activer des voies de signalisation intracellulaires dans les HSCs, de les forcer à entrer en cycle cellulaire et de bloquer toute possibilité de différenciation, conduisant finalement à l auto-renouvellement. Les premières tentatives de culture de HSCs in vitro ont été réalisées en utilisant différentes combinaisons de cytokines hématopoïétiques et de facteurs de croissance incluant l érythropoïétine (EPO), le facteur de croissance de fibroblastes (FGF), le ligand de FLT-3 (FLT3LG), le facteur de stimulation de colonies de granulocytes (CSF3), le facteur de stimulation de colonies de granulocytes et de macrophages (CSF2), l interleukine 1 (IL1), l interleukine 3 (IL3), l interleukine 6 (IL6), l interleukine 11 (IL11), le facteur de cellules souches (SCF) et la thrombopoïétine (THPO). Toutefois, la concoction parfaite reste encore à déterminer puisque qu aucune expansion concluante du nombre de HSCs n a été accomplie en culture à l aide de ces facteurs. Bien que la prolifération des HSCs soit fortement stimulée par ces facteurs extrinsèques, la différenciation et l échec inhérent de la reconstitution hématopoïétique surviennent au détriment de l auto-renouvellement. Néanmoins, plusieurs groupes de recherche ont développé des systèmes de co-culture qui tentent d imiter la niche de cellules souches in vivo afin d aider au maintien des capacités d auto-renouvellement des HSCs. Par exemple, certaines lignées de cellules stromales peuvent fournir un microenvironnement riche en cytokines, en protéines de matrice extra-
56 30 cellulaire et en molécules d adhésion qui permet une meilleure conservation des propriétés des HSCs (Charbord and Moore, 2005). Cependant, il n est pas encore tout à fait clair si le contact physique avec les cellules stromales est vraiment indispensable Voies de Signalisation des Cytokines Les voies de signalisation des cytokines sont des médiateurs de signaux favorisant la survie, la prolifération et la différenciation des cellules hématopoïétiques. Les cytokines ont des effets très variés sur l activité des HSCs. Nous allons nous concentrer uniquement sur IL3, IL6, THPO et SCF IL3 L IL3 (interleukine 3) favorise la prolifération, la différenciation et la survie des cellules myéloïdes et lymphoïdes (Ihle et al., 1981). Cependant, des effets opposés ont été signalés au niveau des HSCs comme une augmentation de la différenciation mais aussi une augmentation de l auto-renouvellement (Ivanovic, 2004). Ces incohérences sont probablement dues à l utilisation de différentes sous-populations de cellules, à la présence ou non de sérum dans le milieu de culture et à l utilisation de combinaisons différentes de cytokines. Néanmoins, le récepteur d IL3 (IL3R) peut s oligomériser lors de la liaison du ligand IL3 et activer différentes cascades de signalisation (Blalock et al., 1999). Par exemple, la voie de signalisation JAK-STAT peut être activée par IL3 et stimuler l assemblage de la chaîne beta d IL3R avec STAT1, STAT3, STAT5 et STAT6. Une fois phosphorylées, les protéines STAT sont relocalisées au noyau où elles agissent comme des facteurs de transcription (Ihle and Kerr, 1995). Plus de détails sont fournis dans la section « Facteurs de Transcription et Cofacteurs» sur les rôles des protéines STAT dans l auto-renouvellement des HSCs. Les voies de signalisation RAS/MAPK et PI3K peuvent également être activées par IL3. L atténuation de l activité de PTEN, un inhibiteur de la voie de signalisation PI3K, induit une prolifération excessive et un épuisement prématuré des HSCs, en plus d une leucémie (Yilmaz et al., 2006b). Ces problèmes peuvent être corrigés à l aide d un traitement à la rapamycine, qui afflige les cellules initiatrices de leucémie (LICs) et rétablit le fonctionnement normal des HSCs. Par conséquent, PTEN semble essentiel au fonctionnement normal des HSCs, mais nuisible à celui des LICs. En fin de compte, toutes les voies de signalisation déclenchées par IL3 génèrent une augmentation de la transcription des gènes Myc, Fos, Pim1, Osm et/ou Jun qui eux, supportent la prolifération et la survie des cellules hématopoïétiques (Robin and Durand, 2010).
57 IL6 L IL6 (interleukine 6) est membre d une famille de protéines, avec IL11 et LIF, qui agissent par l intermédiaire du transducteur de signaux GP130 (IL6ST). IL6 s avère indispensable à l expansion du nombre de cellules KLS in vitro (Takizawa et al., 2003). De plus, les souris qui n expriment pas IL6ST ne survivent que quelques jours seulement après leur naissance et présentent un nombre considérablement réduit de cellules progénitrices hématopoïétiques (Yoshida et al., 1996). Ces résultats suggèrent qu IL6 pourrait avoir un impact positif sur l expansion du nombre de HSCs in vivo THPO La thrombopoïétine (THPO) est une cytokine qui contrôle le développement des mégacaryocytes et la production de plaquettes par l intermédiaire de son récepteur protéine de la leucémie myéloproliférative (MPL) (Kaushansky, 2003). Exprimée dans la niche hématopoïétique, THPO est essentielle au maintien de la quiescence des HSCs (Figure 2.4). En effet, une pénurie de THPO ou de MPL entraîne une diminution du potentiel d auto-renouvellement des HSCs (Kimura et al., 1998). MPL est un membre de la famille des récepteurs de cytokines de type I, qui comprend également les récepteurs de l EPO et de CSF3. Lors de la liaison de THPO à MPL, la protéine tyrosine kinase JAK2 est activée et devient un site d ancrage pour une série de protéines de signalisation contenant des domaines d homologie Src 2 (SH2). Une déficience en JAK2 empêche les cellules hématopoïétiques du foie fœtal de répondre à THPO ou à EPO, et provoque l anémie chez les souris à E12.5 (Parganas et al., 1998). SH2B3 est une protéine qui déstabilise le complexe MPL/JAK2. Les HSCs déficientes en SH2B3 présentent une amplification de l activité de JAK2 ainsi qu une capacité accrue d auto-renouvellement en réponse à THPO (Bersenev et al., 2008). En conséquence, l axe de signalisation THPO/MPL/JAK2/SH2B3 semble essentiel à l activité des HSCs SCF Le facteur de cellules souches (SCF) et son récepteur KIT sont à la tête d une voie de signalisation primordiale dans la niche hématopoïétique (Figure 2.4). L interaction SCF/KIT est associée à plusieurs réponses cellulaires incluant la survie, la prolifération, la différenciation, l adhérence, la migration et le retour à la niche (Ashman, 1999). KIT est un membre de la sous-famille des récepteurs tyrosine kinase de type III, qui comprend également les récepteurs de CSF1, FLT3 et PDGF (Zsebo et al., 1990). Tel que discuté dans la section «2.5.1 Niche», SCF et KIT sont essentiels à la fonction des HSCs. Une seule mutation dans le domaine tyrosine kinase de KIT, nommée «W41», diminue radi-
58 32 calement l intensité de cette voie de signalisation (Herbst et al., 1992). Curieusement, ce déclin est plus prononcé dans la moelle osseuse adulte que dans le foie fœtal. En plus, les HSCs fœtales se contentent d une concentration en SCF 10 fois plus faible que les HSCs adultes pour l activation de KIT (Bowie et al., 2007). Ces résultats indiquent que la capacité d auto-renouvellement des HSCs dépend de leur sensibilité à SCF Voie de Signalisation Notch Des études d expression génétique ont suggéré un rôle possible pour la voie de signalisation Notch dans la régulation de l activité des HSCs parce que le récepteur NOTCH1 (Milner et al., 1994) et son ligand JAG1 (Karanu et al., 2000) sont tous les deux exprimés dans la niche de la moelle osseuse (Figure 2.4). La liaison de JAG1 à NOTCH1 favorise le clivage et la libération du domaine intracellulaire de NOTCH1 (ICN) par l intermédiaire du complexe sécrétase gamma associé à la membrane. Par la suite, ICN pénètre dans le noyau, se lie au corépresseur de transcription RBPJ et le convertit en coactivateur en association avec MAML1, ce qui initie l expression de gènes cibles (Wu et al., 2000). Des expériences de reconstitution hématopoïétique ont montré que l activation soutenue de la voie de signalisation Notch augmente la capacité d auto-renouvellement des HSCs (Stier et al., 2002). L augmentation du nombre de HSCs était vraisemblablement causée par un blocage de différenciation et un accroissement de l auto-renouvellement. La surexpression du gène Hes1, une cible en aval de la voie de signalisation Notch, semble conduire à une expansion du nombre de cellules CD34 - KLS in vitro, tel qu évalué phénotypiquement (Kunisato et al., 2003). Cependant, les propriétés fonctionnelles de ces cellules n ont pas été évaluées in vivo par des expériences de transplantation. Comme mentionné précédemment dans la section «2.3 Discrimination Phénotypique», des changements imprévus dans l immunophénotype des cellules peuvent survenir après avoir fait face aux pressions sélectives des conditions de culture in vitro (Uchida et al., 2003). Ce phénomène peut invalider toute conclusion quant à la quantification phénotypique de l expansion du nombre de HSCs et de cellules progénitrices in vitro. Ainsi, il est possible que seules les cellules progénitrices aient proliféré lors de la surexpression de Hes1. Lorsque Calvi et al. ont suggéré que les ostéoblastes pourraient faire partie de la niche fonctionnelle des HSCs, tel que discuté dans la section précédente « Ostéoblastes», l augmentation du nombre de HSCs dans leur étude était accompagnée de niveaux élevés de JAG1 produits par les ostéoblastes et d une activation de NOTCH1 (Calvi et al., 2003). En outre, le blocage de la voie de signalisation Notch augmente le taux de différenciation des cellules KLS dans la moelle osseuse (Duncan et al., 2005). Chez l humain, une expansion d environ 16 fois du nombre de cellules reconstituant les souris NOD-SCID (SRCs) a été détectée lorsque des cellules de sang de cordon ombilical
59 33 CD34 + étaient co-cultivées avec une forme immobilisée du ligand DLL1 (Delaney et al., 2010). Malgré cela, des HSCs déficientes en NOTCH1 sont capables de reconstituer le système hématopoïétique de souris déficientes en JAG1 (Mancini et al., 2005). Ce constat suggère que la voie de signalisation Notch n est pas nécessaire pour l activité normale des HSCs in vivo et que d autres récepteurs et ligands de la famille Notch pourraient compenser pour la perte de NOTCH1 et de JAG1. Dans le but d éliminer les effets redondants potentiels, une équipe de recherche a systématiquement inhibé tous les signaux Notch d un seul coup (Maillard et al., 2008). Ils ont constaté que la voie de signalisation canonique Notch à l intérieur des HSCs n est pas requise pour leur bon fonctionnement. En contraste avec les études précédentes, Notch ne semble pas représenter un régulateur essentiel de l auto-renouvellement des HSCs chez la souris, même s il peut y jouer un certain rôle Voie de Signalisation Wnt L implication de la voie de signalisation Wnt dans la régulation de l activité des HSCs a été suggérée suite à des études d expression de différentes protéines Wnt dans des cellules hématopoïétiques foetales (Austin et al., 1997). La voie de signalisation canonique de Wnt réfère à la liaison de protéines Wnt à des complexes récepteurs et co-récepteurs (Frizzled et LRP5/6), à la stabilisation subséquente de CTNNB1 et sa translocation dans le noyau, ainsi qu à l activation de gènes cibles par le complexe CTNNB1/TCF. Des résultats variables sont parfois observés lors de l analyse du rôle de CTNNB1 dans les HSCs. En effet, la surexpression d une forme activée de CTNNB1 semble mener à une expansion de 2 à 3 log du nombre de HSCs en culture à long terme, en plus d augmenter l expression de HOXB4 et de NOTCH1 (Reya et al., 2003). Étonnamment, une autre étude a démontré que l activation conditionnelle de CTNNB1 in vivo peut conduire à la perte de la capacité de reconstitution hématopoïétique des HSCs (Kirstetter et al., 2006). Les causes de ces contradictions demeurent encore floues. Il est possible que l impact de CTNNB1 sur l expansion du nombre de HSCs soit dépendant des conditions de culture utilisées dans chaque étude. En dépit de ces résultats, l inactivation de CTNNB1 ne pose pas de problème d auto-renouvellement des HSCs (Cobas et al., 2004). Donc, CTNNB1 n est pas nécessaire pour une hématopoïèse normale. Encore une fois, il est possible que des mécanismes redondants soient actifs in vivo pour compenser la perte de CTNNB1. Les protéines Wnt sont non seulement exprimées dans les cellules hématopoïétiques primitives, mais elles le sont également dans les cellules stromales humaines fœtales
60 34 et adultes (Van Den Berg et al., 1998). Cette constatation soulève la possibilité que les protéines Wnt aient un impact sur l activité des HSCs de manière paracrine et autocrine (Figure 2.4). En ce sens, l ajout d une version recombinante stable de Wnt3a dans le milieu de culture des HSCs semble favoriser leur auto-renouvellement (Willert et al., 2003). De plus, en inhibant la voie Wnt canonique spécifiquement dans les ostéoblastes, on a noté une diminution de l expression de CDKN1A dans les HSCs ainsi qu une activation accrue du cycle cellulaire suivie d une incapacité de reconstitution hématopoïétique des HSCs (Fleming et al., 2008). Bien que Wnt soit inhibé dans les ostéoblastes, les effets négatifs observés dans les HSCs sont irréversibles même lorsqu elles sont transplantées dans une souris normale. Par conséquent, la voie de signalisation Wnt dans la niche semble essentielle pour la restriction de la prolifération et pour le maintien des propriétés fonctionnelles des HSCs. Globalement, ces résultats suggèrent que les effets de Wnt sur les HSCs peuvent varier considérablement en fonction du contexte. Un effet biphasique de Wnt sur le cycle cellulaire est possible. Une modulation fine de l intensité de signalisation de la voie Wnt pourrait également être nécessaire au niveau de maintien de la quiescence des HSCs Voie de Signalisation Smad Les signaux transmis par la superfamille TGFB, incluant les activines et les protéines morphogènes des os (BMPs), sont intégrés dans le noyau cellulaire via la phosphorylation des protéines SMAD1, SMAD2, SMAD3, SMAD5 et SMAD8 (R-SMADs) (Blank and Karlsson, 2011). Aussitôt phosphorylées, les R-SMADs se lient à SMAD4 pour former un complexe qui infiltre le noyau dans le but de contrôler la transcription de gènes cibles. L implication de TGFB dans l activité des HSCs fut suggérée suite à l observation que les récepteurs BMPs et les protéines SMADs y sont exprimés (Bhatia et al., 1999). Cette voie est bien connue pour ses rôles dans l inhibition de la prolifération cellulaire en général. Étant donné que les LT-HSCs sont normalement maintenues dans un état de quiescence relative, TGFB est soupçonné d être un régulateur majeur de cet état in vivo (Figure 2.4). L inhibition de SMAD5, un médiateur de la voie de signalisation Smad, se traduit par une augmentation du nombre de cellules formant des colonies à haut potentiel prolifératif (HPP-CFCs) provenant du sac vitellin ou de cellules ES en culture (Liu et al., 2003). Cependant, la perte de SMAD5 n a aucun effet décelable in vivo sur l activité des HSCs ni sur l hématopoïèse en général chez la souris adulte (Singbrant et al., 2006). En conséquence, SMAD5 pourrait agir spécifiquement lors du développement et non chez l adulte. Il est également possible que des mécanismes redondants s activent pour compenser la perte de SMAD5 chez l adulte.
61 35 Les SMADs inhibiteurs, incluant SMAD6 et SMAD7, fonctionnent en boucle de rétroaction négative pour paralyser la voie de signalisation Smad. À cet égard, l inhibition de la signalisation Smad libère des cellules progénitrices hématopoïétiques primitives de leur quiescence grâce à une régulation positive de FLT3 et du récepteur d IL6 (Fortunel et al., 1998), ou encore par l intermédiaire d une régulation négative de CDKN1A (Ducos et al., 2000) ou de CDKN1C (Scandura et al., 2004). Lorsque SMAD7 est surexprimé dans des HSCs murines, une augmentation significative de la capacité d auto-renouvellement des HSCs est mesurée lors de tests de transplantation in vivo (Blank et al., 2006). En d autres termes, la voie de signalisation Smad semble être négative pour l auto-renouvellement des HSCs. Toutefois, lorsque la voie de signalisation Smad entière est inhibée par la délétion conditionnelle de Smad4, une diminution significative de la capacité de reconstitution des HSCs est observée (Karlsson et al., 2007). Ces résultats suggèrent que SMAD4 est nécessaire pour l auto-renouvellement des HSCs in vivo, par un mécanisme encore inconnu, en dépit de son rôle d effecteur principal de la voie de signalisation Smad. Par ailleurs, la voie de signalisation TGFB-FOXO est importante pour le maintien des cellules initiatrices de leucémie (LICs) dans la leucémie myéloïde chronique (CML) (Naka et al., 2010). Lors d une CML, la tyrosine kinase constitutivement active BCR- ABL stimule AKT et supprime la localisation nucléaire de FOXO. Cette exclusion du noyau conduit à une augmentation de la prolifération et à une inhibition de l apoptose. La CML est couramment traitée avec l imatinib, qui est un inhibiteur de tyrosine kinase. Malheureusement, le traitement à l imatinib n élimine pas les LICs et provoque une rechute de la CML. Étrangement, la localisation nucléaire de FOXO3 est essentielle pour supprimer l apoptose et maintenir les LICs (Naka et al., 2010). En fait, TGFB interfère avec l activité d AKT dans les LICs et conduit à la rétention de FOXO3 dans le noyau. Ce phénomène survient seulement dans les LICs, même si BCR-ABL est exprimé dans toutes les cellules de la CML. Donc, FOXO3 a des effets opposés sur la survie des LICs et des cellules non initiatrices de leucémie. Ces résultats suggèrent l existence d un mécanisme de dormance et de résistance aux stress conféré par TGFB à la fois dans les LICs et dans les LT-HSCs normales Voie de Signalisation ANGPT1/TEK La voie de signalisation ANGPT1/TEK est déterminante pour le maintien de la quiescence des HSCs dans la niche de la moelle osseuse (Arai et al., 2004) (Figure 2.4). Dans les faits, les HSCs exprimant le récepteur tyrosine kinase TEK vivent physiquement attachées aux ostéoblastes dans un état quiescent et anti-apoptotique. D autre part, l activation de TEK par son ligand ANGPT1 préserve le potentiel de reconstitution hé-
62 36 matopoïétique à long terme des HSCs in vivo et protège les HSCs contre un stress myélosuppressif. Selon des expériences de délétion génétique, l expression de TEK dans des souris adultes est régie par le facteur de transcription ETV2, qui est requis pour la maintenance des HSCs (Lee et al., 2011). Une expansion de 24 à 30 fois du nombre de LT-HSCs a été détectée en co-culture avec des cellules de foie fœtal murines CD3 + exprimant spécifiquement les protéines ressemblant à l angiopoïétine ANGPTL2 et ANGPTL3 (Zhang et al., 2006). En outre, les HSCs transplantées dans des souris déficientes en ANGPTL3 présentent de faibles capacités de reconstitution hématopoïétique, ce qui suggère que ANGPTL3 est un facteur extrinsèque important pour l entretien des HSCs dans la niche de la moelle osseuse (Zheng et al., 2011). Néanmoins, le mécanisme moléculaire par lequel la protéine AN- GPTL3 augmente l activité des HSCs demeure inconnu. Donc, il est possible que l impact des ANGPTLs sur l expansion du nombre de HSCs soit indirect in vivo, par le biais d autres types cellulaires. Ce serait bien d analyser l impact des ANGPTLs sur l activité des HSCs humaines car l identification de facteurs d expansion extrinsèques des HSCs humaines représente un intérêt colossal en clinique Voie de Signalisation FGF Les facteurs de croissance des fibroblastes (FGFs) appartiennent à une grande famille de facteurs de signalisation qui sont importants pour le développement et pour la vie adulte. Lors de l émergence du système hématopoïétique, la voie de signalisation FGF est essentielle à la prolifération des hémangioblastes, ancêtres communs des cellules hématopoïétiques et endothéliales (Faloon et al., 2000). Les cellules ES mutantes pour le récepteur Fgfr1 présentent un potentiel réduit de différenciation hématopoïétique. Les LT-HSCs expriment FGFR1 chez la souris mais perdent rapidement cette expression lors de la différenciation en cellules progénitrices (de Haan et al., 2003). L addition de FGF1 en culture, sans sérum, provoque une augmentation de 24 fois de la fréquence en CRUs (de Haan et al., 2003). De surcroît, FGF2, seul ou en combinaison avec FGF1, préserve la capacité de reconstitution à long terme des HSCs en culture sans sérum (Yeoh et al., 2006). Ces résultats élargissent davantage l éventail de méthodes disponibles pour amplifier le nombre de HSCs non manipulées génétiquement. Toutes les voies de signalisation susmentionnées peuvent influencer l activité des HSCs. Elles représentent des messagers qui relient les facteurs extrinsèques de la niche et les instructions décisives à être livrées au noyau.
63 Traitement des Instructions dans le Noyau Un changement de comportement cellulaire, en réponse à des signaux provenant de la niche, inclut entre autre des variations dans le profil d expression génétique ainsi que des modifications post-traductionnelles des protéines. Ultimement, ces changements ont une incidence sur le sort final des cellules grâce à l action concertée d effecteurs tels que les régulateurs du cycle cellulaire, les facteurs de transcription et cofacteurs, les modificateurs épigénétiques et les microacides ribonucléiques (miarns) Régulateurs du Cycle Cellulaire Le contrôle rigoureux du cycle cellulaire est un mécanisme fondamental précieusement conservé de la levure aux mammifères (Hartwell and Weinert, 1989). Dès que des instructions de prolifération atteignent le noyau, une séquence d activation et d inactivation de protéines kinases dépendantes des cyclines (CDKs) se produit, peu importe le sort réservé aux cellules-filles. La progression de la phase G1 du cycle cellulaire dépend du complexe cycline D-CDK4 (ou CDK6), la transition G1-S dépend du complexe cycline E-CDK2, et la transition G2-M dépend des cyclines A et B ainsi que de CDK1 (Sherr, 1994). L activité des CDKs est restreinte par deux familles d inhibiteurs de CDK (CDKIs). La première famille est CIP/KIP et inclut p21 CIP1 (CDKN1A), p27 KIP1 (CD- KN1B) et p57 KIP2 (CDKN1C), qui sont principalement des inhibiteurs de CDK2, CDK4 et CDK1. La deuxième est INK4 et inclut p15 INK4B (CDKN2B), p16 INK4A (CDKN2A), p18 INK4C (CDKN2C) et p19 INK4D/ARF (CDKN2D), qui sont des inhibiteurs spécifiques de CDK4 et CDK6 (Sherr, 1994). Tel qu introduit dans la section «2.5.2 Quiescence», CDKN1A représente un véritable gardien de la quiescence des HSCs. Les souris déficientes en Cdkn1a présentent une augmentation du nombre de HSCs, qui prolifèrent plus rapidement mais qui sont plus sensibles à l épuisement suite à des dommages myélotoxiques (Cheng et al., 2000). En fait, des expériences de transplantation en série chez la souris ont démontré que la capacité d auto-renouvellement des HSCs est ruinée en l absence de CDKN1A (Cheng et al., 2000). Ces résultats indiquent que la restriction minutieuse de la période de cycle cellulaire est essentielle pour prévenir l effondrement du potentiel de reconstitution hématopoïétique des HSCs, en condition de stress. Les HSCs en quiescence expriment des niveaux élevés de CDKN1C par opposition aux HSCs qui se divisent activement (Yamazaki et al., 2006). Selon cette étude, la cycline D1 est séquestrée temporairement par CDKN1C dans le cytoplasme des HSCs quiescentes, où elle est inactive, mais facilement disponible pour une entrée rapide en cycle cellulaire en cas de stimulation par des signaux mitogènes. Donc, CDKN1C agit aussi comme un gardien contre la progression du cycle cellulaire dans les HSCs au repos. Par
64 38 ailleurs, l étude de souris dans lesquelles Cdkn1c est absent uniquement dans le système hématopoïétique montre une réduction du nombre total de HSCs et du nombre de HSCs quiescentes, ainsi qu un affaiblissement de leur potentiel de reconstitution hématopoïétique (Matsumoto et al., 2011). Ce phénotype est davantage amplifié chez des souris déficientes en Cdkn1a et en Cdkn1c, par rapport aux souris déficientes en Cdkn1c seulement. De toute évidence, CDKN1C est indispensable au maintien de la quiescence des HSCs Facteurs de Transcription et Cofacteurs Un nombre croissant de facteurs de transcription et de cofacteurs, distincts des régulateurs du cycle cellulaire, sont impliqués dans le contrôle de l auto-renouvellement des HSCs. Toutefois, cette section traitera uniquement de ceux qui ont un effet marqué sur l auto-renouvellement des LT-HSCs AHR Le récepteur d hydrocarbure aryle (AHR) est un facteur de transcription héliceboucle-hélice basique qui détecte des molécules dans le microenvironnement, tout comme le capteur de disponibilité d oxygène HIF1A (Zhou and Brune, 2006). AHR est un médiateur de réponse aux substances toxiques comme les xénobiotiques, les hydrocarbures aromatiques halogénés et les hydrocarbures aromatiques polycycliques tel que le 2,3,7,8-tétrachlorodibenzo-p-dioxine (TCDD) (Furness and Whelan, 2009). En ce qui concerne les HSCs, le TCDD interagit avec AHR pour abolir la capacité de reconstitution hématopoïétique à long terme (Sakai et al., 2003). Récemment, un criblage d environ petites molécules chimiques a permis l identification de StemRegenin1 (SR1), un antagoniste d AHR, comme étant responsable d une expansion de 17 fois du nombre de HSCs humaines in vitro (Boitano et al., 2010). Bien que les mécanismes moléculaires de cette expansion ne soient pas encore complètement élucidés, ces travaux indiquent que AHR joue un rôle dans l activité des HSCs CBP CBP (protéine de liaison à CREB) est un coactivateur de transcription et une protéine de remodelage de la chromatine qui fonctionne en association avec une panoplie de facteurs de transcription pour influencer l expression de gènes cibles (Nakajima et al., 1997). L expression de CBP a d abord été détectée dans les HSCs fœtales, mais pas dans les cellules matures du sang (Phillips et al., 2000). De plus, l excision de Cbp chez la souris provoque une déplétion des HSCs et une défaillance du système hématopoïétique. (Rebel et al., 2002). En transplantation en série, les HSCs déficientes en Cbp échouent lors de tentative de reconstitution hématopoïétique, donc CBP semble détenir un rôle es-
65 39 sentiel dans le maintien des HSCs grâce à un contrôle de l auto-renouvellement FOXO Les facteurs de transcription contenant un domaine de liaison à l ADN en tête de fourche de sous-classe O (FOXO) représentent une grande famille d effecteurs de la voie de signalisation PI3K/AKT qui sont indispensables pour préserver la capacité de reconstitution hématopoïétique à long terme des HSCs. Les FOXOs favorisent l expression de gènes impliqués dans la détoxication des dérivés réactifs de l oxygène (ROS), comme la superoxyde dismutase et la catalase, ainsi que de gènes qui favorisent la quiescence des HSCs. Plus précisément, Foxo1, Foxo3 et Foxo4 sont fortement exprimés dans le système hématopoïétique. La co-délétion de ces trois gènes entraîne une perte sévère du nombre et de la capacité de reconstitution hématopoïétique à long terme des HSCs (Tothova et al., 2007). D autre part, trois réseaux de transcription normalement touchés par les FOXOs ont été scrutés chez ces triples mutants, c est-à-dire la quiescence, la survie et la protection contre le stress oxydatif. En premier lieu, une accélération significative de la vitesse de prolifération des cellules KLS a été observée avec une diminution de l expression de gènes cibles des FOXOs tels que Rb1, Ccnd2, Ccng2, Cdkn1a, et Cdkn1b. Les HSCs déficientes en Foxo1/3/4 semblent être tirées de leur sommeil et forcées à se multiplier, entraînant un appauvrissement de la réserve de HSCs. En deuxième lieu, la perte de FOXO1/3/4 a provoqué une augmentation du niveau de l apoptose dans les HSCs. Bien que les FOXOs soient généralement associées à la promotion de l apoptose, une carence en FOXO3 cause une augmentation du niveau de l apoptose, qui corrèle avec une forte expression du ligand de FAS (FASLG) (Jonsson et al., 2005). Donc, une augmentation du taux de prolifération et une entrée en apoptose, causées par la perte de FOXO1/3/4, affligent la taille de la réserve de HSCs. En troisième lieu, la perte de FOXO1/3/4 dans des souris déficientes en Atm provoque une élévation des niveaux de ROS, qui sont connus pour nuire à l auto-renouvellement des HSCs via un mécanisme dépendant de p38 (MAPK14)-CDKN2A/CD- KN2D-RB1 (Ito et al., 2006; Tothova et al., 2007). À l inverse, le traitement des souris déficientes en Foxo1/3/4 avec l antioxydant N-acétyl-L-cystéine (NAC) préserve la taille de la réserve de HSCs, atténue les problèmes de cycle cellulaire et d apoptose, en plus de restaurer la capacité de reconstitution hématopoïétique (Tothova et al., 2007). Aussi, le traitement des souris déficientes en Foxo3 avec NAC inhibe l activation de MAPK14 dans les cellules CD34 - KLS, et le traitement avec un inhibiteur de MAPK14 rétablit les défauts de croissance des LTC-ICs (Miyamoto et al., 2007). Ces résultats indiquent que
66 40 l accumulation de ROS et l activation de MAPK handicapent la fonction des HSCs en absence des FOXOs. Tout compte fait, les FOXOs protègent l activité des HSCs en contrôlant la quiescence, la survie et les niveaux de ROS GFI1 GFI1, un répresseur de transcription indépendant des facteurs de croissance, joue un rôle important dans l activité des HSCs. On a d abord détecté des niveaux d expression élevés de GFI1 dans des thymocytes (Gilks et al., 1993). Par la suite, des expériences de repopulation compétitives et de transplantation en série de HSCs déficientes en Gfi1 ont montré que ce facteur assure la capacité d auto-renouvellement des HSCs en limitant leur taux de prolifération et en préservant leur potentiel de greffe à long terme (Hock et al., 2004; Zeng et al., 2004). Fait intéressant, la restriction de la prolifération des HSCs par GFI1 pourrait être exécutée par CDKN1A, dont l expression est fortement réduite dans des HSCs déficientes en Gfi1 (Hock et al., 2004). Toutefois, il est possible que GFI1 entraîne d autres réactions car les effets de la délétion de Cdkn1a sur l activité des HSCs sont moins importants que ceux observés avec la délétion de Gfi1. Ensemble, ces résultats suggèrent que GFI1 contrôle la quiescence des HSCs et la taille de leur réserve HOXB4 HOXB4 est un membre de la grande famille des facteurs de transcription homéotiques (HOX), qui sont connus en tant que régulateurs de la structuration de l embryon et de l organogenèse. L expression d HOXB4 est considérable dans des cellules progénitrices hématopoïétiques humaines, mais régulée à la baisse lors de la différenciation (Sauvageau et al., 1994). En surexpression, HOXB4 rend les HSCs fois plus compétitives que les cellules contrôles pour reconstituer le système hématopoïétique de souris irradiées (Sauvageau et al., 1995). De plus, lorsqu HOXB4 est surexprimé dans des HSCs en culture pendant jours, une expansion nette de 40 fois du nombre de HSCs est mesurée (Antonchuk et al., 2002). L analyse de clonalité du système hématopoïétique des souris receveuses primaires et secondaires a montré que l expansion du nombre de LT-HSCs était polyclonale et réalisée par des divisions d auto-renouvellement. Une expansion similaire est également possible en ajoutant directement au milieu de culture la protéine HOXB4 recombinante (Amsellem et al., 2003; Krosl et al., 2003). De manière intéressante, l expansion du nombre de HSCs conférée par HOXB4 n excède pas la taille maximale de la réserve in vivo (Thorsteinsdottir et al., 1999). L incidence de leucémie n augmente pas non plus en surexprimant HOXB4 dans les HSCs (Sauvageau et al., 1995). Curieusement, le pouvoir d HOXB4 sur l expansion du nombre de HSCs semble dépendre des niveaux élevés de cytokines et de facteurs de croissance
67 41 présents lors de la culture des HSCs in vitro ou immédiatement après l irradiation in vivo, et non pas des conditions présentes dans les souris receveuses après de longues périodes de temps post-transplantation. D autre part, le potentiel d HOXB4 sur l expansion du nombre de HSCs peut être renforcé par la réduction simultanée de l expression de PBX1 (Cellot et al., 2007) ou de CDKN1A (Miyake et al., 2006). Collectivement, ces études ont identifié HOXB4 comme l un des plus puissant gènes de type sauvage en mesure d amplifier le nombre de HSCs in vitro et in vivo sans causer de leucémie ID1 ID1 (inhibiteur de liaison à l ADN) est un régulateur de transcription hélice-bouclehélice basique qui se lie aux protéines E et régule les programmes de différenciation des lymphocytes B et T (Kim et al., 1999; Sun, 1994). Suite à la découverte que des HSCs déficientes en Id1 présentent une capacité réduite de greffe en transplantation secondaire, il fut suggéré qu ID1 est nécessaire à la maintenance des LT-HSCs (Perry et al., 2007). Cependant, le mécanisme par lequel ID1 maintient les LT-HSCs demeure obscur. Étonnamment, une autre étude a démontré que la délétion d Id1 ne modifie pas la fonction des HSCs, mais touche plutôt la niche hématopoïétique (Suh et al., 2009). En effet, ce sont les cellules stromales déficientes en Id1 qui sont responsables de la perte des LT-HSCs fonctionnelles. Par conséquent, ID1 semble être essentielle à la régulation extrinsèque des HSCs par la niche, mais pas au contrôle intrinsèque des HSCs. Néanmoins, il est possible que l expression d autres gènes Id comme Id2, Id3 ou Id4, compense pour la perte de fonction d ID1 à l intérieur des HSCs et camoufle un impact à la fois extrinsèque et intrinsèque. Et puisque différents types de cellules stromales opèrent dans la niche des HSCs, il serait intéressant d inhiber l expression d ID1 uniquement dans certains types de cellules stromales afin d identifier les responsables MYC Myc est un proto-oncogène multifonctionnel qui contribue entre autre à maintenir l équilibre entre l auto-renouvellement et la différenciation des HSCs, en contrôlant ses interactions avec la niche. En fait, les HSCs déficientes en Myc n arrivent pas à se différencier, s accumulent dans la niche et surexpriment CDH2 (Wilson et al., 2004). Ces observations indiquent que MYC est essentielle au largage des HSCs à partir de la niche. En accord, des résultats similaires ont montré que des cellules KLS déficientes en Myc augmentent l expression de CDKN1A, dont l inactivation rétablit un phénotype normal (Baena et al., 2007). Par ailleurs, la délétion conditionnelle simultanée de Myc et de Mycn atteste que chacun de ces deux gènes sont nécessaires pour la prolifération, la croissance du métabolisme, la différenciation, la capacité d auto-renouvellement à long terme et la survie des HSCs (Laurenti et al., 2008).
68 STAT Les facteurs de transcription de la famille Stat (transducteur de signal et activateur de la transcription) peuvent être activés en réponse à une stimulation des HSCs par des cytokines. STAT3 et STAT5 sont le plus souvent surexprimées dans la leucémie myéloïde aiguë (AML), la leucémie myéloïde chronique (CML) et le myélome multiple (Yu and Jove, 2004). De plus, la délétion conditionnelle de Stat5 augmente le taux de prolifération des HSCs mais conduit à un épuisement de leur réserve (Wang et al., 2009). Inversement, l activation constitutive de Stat5 induit une expansion significative du nombre d unités formant des colonies de neutrophiles, de macrophages, d érythroblastes et de mégacaryocytes (CFU-nmEM) (Kato et al., 2005). Similairement, la surexpression de STAT5 stimule une expansion de 4 fois du nombre de CFCs après 3 semaines de culture, initiée avec des cellules hématopoïétiques humaines CD34 + CD38 -, mais pas avec des cellules plus différenciées (Fatrai et al., 2011). Cette même étude a identifié Hif2a (Epas1) comme un gène cible de STAT5 dans les HSCs humaines et a démontré que la délétion d Epas1 abolit l expansion du nombre de HSCs stimulée par STAT5. STAT5 utilise donc des voies de signalisation hypoxiques afin de maintenir l auto-renouvellement des HSCs en présence de concentrations élevées en oxygène. Prises dans leur ensemble, ces études suggèrent que les protéines STATs représentent de fermes effectrices de l auto-renouvellement des HSCs Modificateurs Épigénétiques Les modifications épigénétiques sont généralement considérées comme des modifications héritables de l expression génétique sans aucun changement dans la séquence d ADN. Ce processus contribue à la fidélité des profils d expression génétique au cours du cycle cellulaire, de la durée de vie des individus, et des générations. Le principal mode de transfert de l information épigénétique réside dans les modifications biochimiques des histones (comme la méthylation, l acétylation, la phosphorylation, l ubiquitination et la sumoylation) et de l ADN (comme la méthylation). Plusieurs régulateurs épigénétiques ont été identifiés jusqu à maintenant mais peu ont démontré un rôle direct dans l autorenouvellement des LT-HSCs. En voici trois exemples : BMI1 BMI1 (région 1 d insertion du virus de leucémie murine Moloney dans les lymphomes B) est un facteur déterminant du complexe répresseur Polycomb 1 (PRC1) qui se lie à des sites spécifiques de la chromatine formés par PRC2, c est-à-dire aux résidus lysine 27 triméthylés de l histone H3 (H3K27me3). Cette alliance réprime l expression de plusieurs gènes impliqués dans le développement (Simon and Kingston, 2009). Au niveau
69 43 du système hématopoïétique, l expression de BMI1 est élevée spécifiquement dans les HSCs et diminue progressivement lors de la différenciation (Lessard et al., 1999). Les souris déficientes en Bmi1 présentent des signes évidents d incapacité d auto-renouvellement des HSCs et des cellules souches leucémiques (LSCs) (Lessard and Sauvageau, 2003; Park et al., 2003). La perte d expression de BMI1 corrèle aussi avec une expression accrue de CDKN2A et de CDKN2D, des niveaux d apoptose intensifiés, des concentrations plus élevées en ROS et une expression réduite de FOXO3 dans les cellules de sang de cordon ombilical humaines CD34 + (Rizo et al., 2009). De plus, la co-délétion de Cdkn2a et de Cdkn2d dans des souris déficientes en Bmi1 restaure la capacité défectueuse d auto-renouvellement des HSCs (Oguro et al., 2006). Par conséquent, BMI1 est un facteur essentiel pour protéger les HSCs de la sénescence, de l apoptose et des conditions de stress oxydatif MLL MLL (leucémie à lignées mixtes) est un membre du groupe trithorax (TrxG). Ces facteurs ont un impact positif sur la transcription des gènes à boîte homéotique (Hox). Les TrxGs agissent également en contrant la fonction des protéines du groupe Polycomb (PcG) (Ringrose and Paro, 2004). Mll code pour une méthyltransférase d histone qui se lie à l ADN et augmente l expression de gènes cibles par son activité méthyltransférase de la lysine 4 de l histone H3 (H3K4) (Milne et al., 2002). La délétion conditionnelle de Mll cause une défaillance de l hématopoïèse chez les souris adultes (Jude et al., 2007). Cette étude a aussi démontré par des expériences de reconstitution compétitives que les cellules KLS mutantes Mll ne parviennent à aucune reconstitution significative de la moelle osseuse ni à court ni à long terme post-transplantation. Cet échec serait attribuable à l incapacité des HSCs à s auto-renouveler et à maintenir leur état de quiescence. Ces données dévoilent un rôle important pour MLL dans le maintien de l activité des HSCs MOZ MOZ (protéine en doigt de zinc de leucémie monocytaire) est un coactivateur de transcription arborant une activité acétyltransférase d histone. Ce modificateur épigénétique est associé l AML en raison de son implication dans les translocations chromosomiques, qui le fusionnent avec différents partenaires tels que CBP (Kitabayashi et al., 2001a), EP300 (Kitabayashi et al., 2001b) et le récepteur nucléaire coactivateur NCOA2 (Carapeti et al., 1998). Le rôle de MOZ dans les HSCs était inconnu jusqu à ce que l analyse de souris entièrement déficientes en Moz soit réalisée (Katsumoto et al., 2006). Les résultats ont démontré que les cellules de foie foetal déficientes en Moz sont inefficaces pour reconstituer le système hématopoïétique des souris.
70 44 En outre, la protéine de fusion MOZ-NCOA2 induit la formation de LSCs à partir de cellules progénitrices engagées et cause une AML après transplantation dans des souris irradiées (Huntly et al., 2004). De plus, MOZ-NCOA2 interagit avec SPI1 pour augmenter l expression du récepteur du facteur stimulant la formation de colonies de macrophages (CSF1R), qui semble être impliqué dans le maintien des LSCs (Aikawa et al., 2010). Ces résultats soutiennent l hypothèse selon laquelle MOZ est essentielle au maintien des HSCs et suffisant pour générer des LSCs lorsque fusionné à NCOA Fidélité Génomique L accumulation de lésions génétiques au sein d une cellule souche est inévitable en raison de sa durée de vie et de son activité mitotique. L ADN peut être endommagé lors de sa réplication et lors de son exposition à des radiations ionisantes, à des agents mutagènes ou aux ROS (Sharpless and DePinho, 2007). La courte durée de vie d un clone de cellules progénitrices quelconque peut aider à prévenir l accumulation de mutations nécessaires à la transformation maligne, mais pas la longue durée de vie des LT-HSCs. Par contre, l activité mitotique ralentie des LT-HSCs freine l accumulation de telles mutations. Dans tous les cas, l atteinte à l intégrité génomique peut nuire au fonctionnement normal des cellules souches et promouvoir la cancérogenèse. Au cours de l évolution, les cellules souches ont développé différents moyens pour résister aux insultes ou pour les réparer directement. Toutefois, lorsque l ampleur des dégâts dépasse la limite de ce qui peut être réparé, les cellules souches peuvent envisager l apoptose ou la sénescence comme un destin alternatif Réponse aux Dommages à l ADN La préservation de l intégrité génomique dans les cellules souches dépend essentiellement des mécanismes de réparation de l ADN. Le suppresseur de tumeur TP53 est un facteur de transcription qui enclenche la réponse aux dommages à l ADN et peut forcer l arrêt du cycle cellulaire (Mercer et al., 1990), la sénescence (Serrano et al., 1997) ou l apoptose (Yonish-Rouach et al., 1991). L un des rôles principaux de TP53 dans les HSCs est d appuyer la quiescence par l intermédiaire de CDKN1A. Cependant, TP53 peut aussi contrôler la quiescence des HSCs sans l aide de CD- KN1A (Liu et al., 2009). En effet, les LT-HSCs et les cellules KLS déficientes en ELF4, un facteur de transcription à domaine Ets, expriment des niveaux élevés de TP53 et sont maintenues en quiescence, indépendamment de CDKN1A. En revanche, la délétion de Tp53 dans les HSCs déficientes en Elf4 ramène les niveaux de quiescence à la normale. De plus, des expériences de transplantation en série ont démontré que les HSCs déficientes en Tp53 accumulent plus de dommages à l ADN et affichent une baisse du poten-
71 45 tiel d auto-renouvellement comparé aux HSCs surexprimant la protéine anti-apoptotique BCL2 (Milyavsky et al., 2010). Ces résultats suggèrent un nouveau rôle pour TP53, distinct de l apoptose, au niveau de l auto-renouvellement des HSCs. Dans le but de maintenir leur activité à long terme, les HSCs ont développé une série de stratégies pour contrebalancer le taux d accumulation de dommages à l ADN. Au cours du cycle cellulaire, les HSCs favorisent la réparation des cassures double brin à l aide de RAD50 (Bender et al., 2002), ATM (Ito et al., 2004) et ATR (Ruzankina et al., 2007). En revanche, les HSCs quiescentes sont limitées dans leur capacité de réparer l ADN de cette façon, mais semblent tout de même utiliser le mécanisme de fusion d extrémités non homologues (NHEJ) pour réparer l ADN à l aide de LIG4 (Nijnik et al., 2007) et de KU80 (XRCC5) (Rossi et al., 2007). D autres facteurs peuvent également être utilisés par les HSCs en réponse aux dommages à l ADN comme la protéine de réparation d ADN BRCA2 (Navarro et al., 2006), la protéine de réparation de mésappariement MSH2 (Reese et al., 2003) ainsi que les protéines de réparation d excision de nucléotides ERCC1, ERCC2 et XPA (Prasher et al., 2005). Manifestement, les mécanismes de réponse aux dommages à l ADN sont essentiels au maintien de l intégrité génomique et du potentiel d auto-renouvellement des HSCs Dérivés Réactifs de l Oxygène Une des conséquences du métabolisme oxydatif est la production de dérivés réactifs de l oxygène (ROS). Dans le système hématopoïétique, un certain niveau de ROS intracellulaire est essentiel à la différenciation des HSCs (Juntilla et al., 2010). Pourtant, un excès de ROS intracellulaire peut altérer la fonction des cellules souches en brisant des lipides, des protéines, de l ARN et de l ADN. Les HSCs ont développé au moins deux outils différents pour limiter les dommages perpétrés par les ROS et de prolonger leur durée de vie : le premier est l utilisation de facteurs de transcription FOXO tel que détaillé précédemment dans la section « FOXO» ; le second est ATM, une kinase activée en réponse aux dommages à l ADN et impliquée dans la réparation de l ADN (Barzilai et al., 2002). Les HSCs déficientes en Atm ne sont plus fonctionnelles en raison de l accumulation de ROS, de l activation de MAPK14 et d un état de quiescence affligé (Ito et al., 2006). En retour, un traitement avec NAC ou un inhibiteur de MAPK14 peut renverser ce phénotype. Ensemble, ces résultats révèlent une nouvelle association entre les niveaux de ROS, la réparation de l ADN et la maintenance des HSCs Fortification des Télomères Les télomères sont constitués de milliers de séquences répétitives de nucléotides TTAGGG et de complexes protéiques campés aux extrémités des chromosomes (Gil-
72 46 son and Geli, 2007). En raison du «problème de réplication des extrémités», l érosion des télomères conduit à la sénescence réplicative ou à l apoptose après qu une longueur critique de télomère soit atteinte. Lorsque les cellules ont la capacité de surmonter la sénescence, des fusions chromosomiques aberrantes se produisent et instaurent une instabilité génomique (Counter et al., 1992). Cependant, plusieurs types de cellules souches normales et cancéreuses, comme les HSCs, expriment la télomérase (Morrison et al., 1996; Vaziri et al., 1994). Cette enzyme prolonge les télomères par l ajout de nouvelles répétitions TTAGGG afin de contourner les limites de réplication imposées par la longueur des télomères. De cette façon, les HSCs maintiennent leur potentiel prolifératif. Réciproquement, une baisse d activité de la télomérase diminue le potentiel d auto-renouvellement des HSCs lors d expériences de transplantation en série (Allsopp et al., 2003). En conséquence, la télomérase détient un rôle important dans le maintien du potentiel d auto-renouvellement des HSCs et de l intégrité du génome.
73 Sources Documentaires Abkowitz, J.L., Catlin, S.N., McCallie, M.T., and Guttorp, P. (2002). Evidence that the number of hematopoietic stem cells per animal is conserved in mammals. Blood 100, Abkowitz, J.L., Golinelli, D., Harrison, D.E., and Guttorp, P. (2000). In vivo kinetics of murine hemopoietic stem cells. Blood 96, Adams, G.B., Chabner, K.T., Alley, I.R., Olson, D.P., Szczepiorkowski, Z.M., Poznansky, M.C., Kos, C.H., Pollak, M.R., Brown, E.M., and Scadden, D.T. (2006). Stem cell engraftment at the endosteal niche is specified by the calcium-sensing receptor. Nature 439, Adams, G.B., and Scadden, D.T. (2006). The hematopoietic stem cell in its place. Nat Immunol 7, Aikawa, Y., Katsumoto, T., Zhang, P., Shima, H., Shino, M., Terui, K., Ito, E., Ohno, H., Stanley, E.R., Singh, H., et al. (2010). PU.1-mediated upregulation of CSF1R is crucial for leukemia stem cell potential induced by MOZ-TIF2. Nat Med 16, , 581p following 585. Allsopp, R.C., Morin, G.B., DePinho, R., Harley, C.B., and Weissman, I.L. (2003). Telomerase is required to slow telomere shortening and extend replicative lifespan of HSCs during serial transplantation. Blood 102, Amsellem, S., Pflumio, F., Bardinet, D., Izac, B., Charneau, P., Romeo, P.H., Dubart- Kupperschmitt, A., and Fichelson, S. (2003). Ex vivo expansion of human hematopoietic stem cells by direct delivery of the HOXB4 homeoprotein. Nat Med 9, Antonchuk, J., Sauvageau, G., and Humphries, R.K. (2002). HOXB4-induced expansion of adult hematopoietic stem cells ex vivo. Cell 109, Arai, F., Hirao, A., Ohmura, M., Sato, H., Matsuoka, S., Takubo, K., Ito, K., Koh, G.Y., and Suda, T. (2004). Tie2/angiopoietin-1 signaling regulates hematopoietic stem cell quiescence in the bone marrow niche. Cell 118, Ashman, L.K. (1999). The biology of stem cell factor and its receptor C-kit. Int J Biochem Cell Biol 31,
74 48 Austin, T.W., Solar, G.P., Ziegler, F.C., Liem, L., and Matthews, W. (1997). A role for the Wnt gene family in hematopoiesis: expansion of multilineage progenitor cells. Blood 89, Baena, E., Ortiz, M., Martinez, A.C., and de Alboran, I.M. (2007). c-myc is essential for hematopoietic stem cell differentiation and regulates Lin(-)Sca-1(+)c-Kit(-) cell generation through p21. Exp Hematol 35, Baines, P., Mayani, H., Bains, M., Fisher, J., Hoy, T., and Jacobs, A. (1988). Enrichment of CD34 (My10)-positive myeloid and erythroid progenitors from human marrow and their growth in cultures supplemented with recombinant human granulocyte-macrophage colony-stimulating factor. Exp Hematol 16, Barzilai, A., Rotman, G., and Shiloh, Y. (2002). ATM deficiency and oxidative stress: a new dimension of defective response to DNA damage. DNA Repair (Amst) 1, Baum, C.M., Weissman, I.L., Tsukamoto, A.S., Buckle, A.M., and Peault, B. (1992). Isolation of a candidate human hematopoietic stem-cell population. Proc Natl Acad Sci U S A 89, Bender, C.F., Sikes, M.L., Sullivan, R., Huye, L.E., Le Beau, M.M., Roth, D.B., Mirzoeva, O.K., Oltz, E.M., and Petrini, J.H. (2002). Cancer predisposition and hematopoietic failure in Rad50(S/S) mice. Genes Dev 16, Benveniste, P., Frelin, C., Janmohamed, S., Barbara, M., Herrington, R., Hyam, D., and Iscove, N.N. (2010). Intermediate-term hematopoietic stem cells with extended but timelimited reconstitution potential. Cell Stem Cell 6, Bersenev, A., Wu, C., Balcerek, J., and Tong, W. (2008). Lnk controls mouse hematopoietic stem cell self-renewal and quiescence through direct interactions with JAK2. J Clin Invest 118, Bhatia, M., Bonnet, D., Wu, D., Murdoch, B., Wrana, J., Gallacher, L., and Dick, J.E. (1999). Bone morphogenetic proteins regulate the developmental program of human hematopoietic stem cells. J Exp Med 189, Bhatia, M., Wang, J.C., Kapp, U., Bonnet, D., and Dick, J.E. (1997). Purification of primitive human hematopoietic cells capable of repopulating immune-deficient mice. Proc Natl Acad Sci U S A 94, Blalock, W.L., Weinstein-Oppenheimer, C., Chang, F., Hoyle, P.E., Wang, X.Y., Algate, P.A., Franklin, R.A., Oberhaus, S.M., Steelman, L.S., and McCubrey, J.A. (1999). Sig-
75 49 nal transduction, cell cycle regulatory, and anti-apoptotic pathways regulated by IL-3 in hematopoietic cells: possible sites for intervention with anti-neoplastic drugs. Leukemia 13, Blank, U., Karlsson, G., Moody, J.L., Utsugisawa, T., Magnusson, M., Singbrant, S., Larsson, J., and Karlsson, S. (2006). Smad7 promotes self-renewal of hematopoietic stem cells. Blood 108, Blank, U., and Karlsson, S. (2011). The role of Smad signaling in hematopoiesis and translational hematology. Leukemia 25, Boitano, A.E., Wang, J., Romeo, R., Bouchez, L.C., Parker, A.E., Sutton, S.E., Walker, J.R., Flaveny, C.A., Perdew, G.H., Denison, M.S., et al. (2010). Aryl hydrocarbon receptor antagonists promote the expansion of human hematopoietic stem cells. Science 329, Bowie, M.B., Kent, D.G., Copley, M.R., and Eaves, C.J. (2007). Steel factor responsiveness regulates the high self-renewal phenotype of fetal hematopoietic stem cells. Blood 109, Broxmeyer, H.E. (1984). Colony assays of hematopoietic progenitor cells and correlations to clinical situations. Crit Rev Oncol Hematol 1, Calvi, L.M., Adams, G.B., Weibrecht, K.W., Weber, J.M., Olson, D.P., Knight, M.C., Martin, R.P., Schipani, E., Divieti, P., Bringhurst, F.R., et al. (2003). Osteoblastic cells regulate the haematopoietic stem cell niche. Nature 425, Capel, B., Hawley, R., Covarrubias, L., Hawley, T., and Mintz, B. (1989). Clonal contributions of small numbers of retrovirally marked hematopoietic stem cells engrafted in unirradiated neonatal W/Wv mice. Proc Natl Acad Sci U S A 86, Carapeti, M., Aguiar, R.C., Goldman, J.M., and Cross, N.C. (1998). A novel fusion between MOZ and the nuclear receptor coactivator TIF2 in acute myeloid leukemia. Blood 91, Catlin, S.N., Busque, L., Gale, R., Guttorp, P., and Abkowitz, J.L. (2011). The replication rate of human hematopoietic stem cells in vivo. Blood. Cellot, S., Krosl, J., Chagraoui, J., Meloche, S., Humphries, R.K., and Sauvageau, G. (2007). Sustained in vitro trigger of self-renewal divisions in Hoxb4hiPbx1(10) hematopoietic stem cells. Exp Hematol 35, Charbord, P., and Moore, K. (2005). Gene expression in stem cell-supporting stromal cell
76 50 lines. Ann N Y Acad Sci 1044, Cheng, T., Rodrigues, N., Shen, H., Yang, Y., Dombkowski, D., Sykes, M., and Scadden, D.T. (2000). Hematopoietic stem cell quiescence maintained by p21cip1/waf1. Science 287, Cheshier, S.H., Morrison, S.J., Liao, X., and Weissman, I.L. (1999). In vivo proliferation and cell cycle kinetics of long-term self-renewing hematopoietic stem cells. Proc Natl Acad Sci U S A 96, Clapp, D.W., Dumenco, L.L., Hatzoglou, M., and Gerson, S.L. (1991). Fetal liver hematopoietic stem cells as a target for in utero retroviral gene transfer. Blood 78, Cobas, M., Wilson, A., Ernst, B., Mancini, S.J., MacDonald, H.R., Kemler, R., and Radtke, F. (2004). Beta-catenin is dispensable for hematopoiesis and lymphopoiesis. J Exp Med 199, Coulombel, L. (2004). Identification of hematopoietic stem/progenitor cells: strength and drawbacks of functional assays. Oncogene 23, Counter, C.M., Avilion, A.A., LeFeuvre, C.E., Stewart, N.G., Greider, C.W., Harley, C.B., and Bacchetti, S. (1992). Telomere shortening associated with chromosome instability is arrested in immortal cells which express telomerase activity. EMBO J 11, de Haan, G., Weersing, E., Dontje, B., van Os, R., Bystrykh, L.V., Vellenga, E., and Miller, G. (2003). In vitro generation of long-term repopulating hematopoietic stem cells by fibroblast growth factor-1. Dev Cell 4, Deguchi, K., Yagi, H., Inada, M., Yoshizaki, K., Kishimoto, T., and Komori, T. (1999). Excessive extramedullary hematopoiesis in Cbfa1-deficient mice with a congenital lack of bone marrow. Biochem Biophys Res Commun 255, Delaney, C., Heimfeld, S., Brashem-Stein, C., Voorhies, H., Manger, R.L., and Bernstein, I.D. (2010). Notch-mediated expansion of human cord blood progenitor cells capable of rapid myeloid reconstitution. Nat Med 16, Dexter, T.M., Allen, T.D., and Lajtha, L.G. (1977). Conditions controlling the proliferation of haemopoietic stem cells in vitro. J Cell Physiol 91, Ducos, K., Panterne, B., Fortunel, N., Hatzfeld, A., Monier, M.N., and Hatzfeld, J. (2000). p21(cip1) mrna is controlled by endogenous transforming growth factor-beta1 in quiescent human hematopoietic stem/progenitor cells. J Cell Physiol 184,
77 51 Duncan, A.W., Rattis, F.M., DiMascio, L.N., Congdon, K.L., Pazianos, G., Zhao, C., Yoon, K., Cook, J.M., Willert, K., Gaiano, N., et al. (2005). Integration of Notch and Wnt signaling in hematopoietic stem cell maintenance. Nat Immunol 6, Faloon, P., Arentson, E., Kazarov, A., Deng, C.X., Porcher, C., Orkin, S., and Choi, K. (2000). Basic fibroblast growth factor positively regulates hematopoietic development. Development 127, Fatrai, S., Wierenga, A.T., Daenen, S.M., Vellenga, E., and Schuringa, J.J. (2011). Identification of HIF2{alpha} as an important STAT5 target gene in human hematopoietic stem cells. Blood. Ficara, F., Murphy, M.J., Lin, M., and Cleary, M.L. (2008). Pbx1 regulates self-renewal of long-term hematopoietic stem cells by maintaining their quiescence. Cell Stem Cell 2, Fielenbach, N., and Antebi, A. (2008). C. elegans dauer formation and the molecular basis of plasticity. Genes Dev 22, Fleming, H.E., Janzen, V., Lo Celso, C., Guo, J., Leahy, K.M., Kronenberg, H.M., and Scadden, D.T. (2008). Wnt signaling in the niche enforces hematopoietic stem cell quiescence and is necessary to preserve self-renewal in vivo. Cell Stem Cell 2, Fortunel, N., Batard, P., Hatzfeld, A., Monier, M.N., Panterne, B., Lebkowski, J., and Hatzfeld, J. (1998). High proliferative potential-quiescent cells: a working model to study primitive quiescent hematopoietic cells. J Cell Sci 111 ( Pt 13), Fortunel, N., Hatzfeld, J., Aoustin, L., Batard, P., Ducos, K., Monier, M.N., Charpentier, A., and Hatzfeld, A. (2000). Specific dose-response effects of TGF-beta1 on developmentally distinct hematopoietic stem/progenitor cells from human umbilical cord blood. Hematol J 1, Foudi, A., Hochedlinger, K., Van Buren, D., Schindler, J.W., Jaenisch, R., Carey, V., and Hock, H. (2009). Analysis of histone 2B-GFP retention reveals slowly cycling hematopoietic stem cells. Nat Biotechnol 27, Frimberger, A.E., McAuliffe, C.I., Werme, K.A., Tuft, R.A., Fogarty, K.E., Benoit, B.O., Dooner, M.S., and Quesenberry, P.J. (2001). The fleet feet of haematopoietic stem cells: rapid motility, interaction and proteopodia. Br J Haematol 112, Furness, S.G., and Whelan, F. (2009). The pleiotropy of dioxin toxicity--xenobiotic misappropriation of the aryl hydrocarbon receptor s alternative physiological roles. Pharma-
78 52 col Ther 124, Gekas, C., Dieterlen-Lievre, F., Orkin, S.H., and Mikkola, H.K. (2005). The placenta is a niche for hematopoietic stem cells. Dev Cell 8, Gilks, C.B., Bear, S.E., Grimes, H.L., and Tsichlis, P.N. (1993). Progression of interleukin-2 (IL-2)-dependent rat T cell lymphoma lines to IL-2-independent growth following activation of a gene (Gfi-1) encoding a novel zinc finger protein. Mol Cell Biol 13, Gilson, E., and Geli, V. (2007). How telomeres are replicated. Nat Rev Mol Cell Biol 8, Goldschneider, I., Gordon, L.K., and Morris, R.J. (1978). Demonstration of Thy-1 antigen on pluripotent hemopoietic stem cells in the rat. J Exp Med 148, Harrison, D.E. (1980). Competitive repopulation: a new assay for long-term stem cell functional capacity. Blood 55, Harrison, D.E., Jordan, C.T., Zhong, R.K., and Astle, C.M. (1993). Primitive hemopoietic stem cells: direct assay of most productive populations by competitive repopulation with simple binomial, correlation and covariance calculations. Exp Hematol 21, Harrison, D.E., Lerner, C., Hoppe, P.C., Carlson, G.A., and Alling, D. (1987). Large numbers of primitive stem cells are active simultaneously in aggregated embryo chimeric mice. Blood 69, Hartwell, L.H., and Weinert, T.A. (1989). Checkpoints: controls that ensure the order of cell cycle events. Science 246, Herbst, R., Shearman, M.S., Obermeier, A., Schlessinger, J., and Ullrich, A. (1992). Differential effects of W mutations on p145c-kit tyrosine kinase activity and substrate interaction. J Biol Chem 267, Hock, H., Hamblen, M.J., Rooke, H.M., Schindler, J.W., Saleque, S., Fujiwara, Y., and Orkin, S.H. (2004). Gfi-1 restricts proliferation and preserves functional integrity of haematopoietic stem cells. Nature 431, Huntly, B.J., Shigematsu, H., Deguchi, K., Lee, B.H., Mizuno, S., Duclos, N., Rowan, R., Amaral, S., Curley, D., Williams, I.R., et al. (2004). MOZ-TIF2, but not BCR-ABL, confers properties of leukemic stem cells to committed murine hematopoietic progenitors. Cancer Cell 6,
79 53 Ihle, J.N., and Kerr, I.M. (1995). Jaks and Stats in signaling by the cytokine receptor superfamily. Trends Genet 11, Ihle, J.N., Pepersack, L., and Rebar, L. (1981). Regulation of T cell differentiation: in vitro induction of 20 alpha-hydroxysteroid dehydrogenase in splenic lymphocytes from athymic mice by a unique lymphokine. J Immunol 126, Ito, K., Hirao, A., Arai, F., Matsuoka, S., Takubo, K., Hamaguchi, I., Nomiyama, K., Hosokawa, K., Sakurada, K., Nakagata, N., et al. (2004). Regulation of oxidative stress by ATM is required for self-renewal of haematopoietic stem cells. Nature 431, Ito, K., Hirao, A., Arai, F., Takubo, K., Matsuoka, S., Miyamoto, K., Ohmura, M., Naka, K., Hosokawa, K., Ikeda, Y., et al. (2006). Reactive oxygen species act through p38 MAPK to limit the lifespan of hematopoietic stem cells. Nat Med 12, Ito, M., Hiramatsu, H., Kobayashi, K., Suzue, K., Kawahata, M., Hioki, K., Ueyama, Y., Koyanagi, Y., Sugamura, K., Tsuji, K., et al. (2002). NOD/SCID/gamma(c)(null) mouse: an excellent recipient mouse model for engraftment of human cells. Blood 100, Ivanovic, Z. (2004). Interleukin-3 and ex vivo maintenance of hematopoietic stem cells: facts and controversies. Eur Cytokine Netw 15, Jarboe, D.L., and Huff, T.F. (1989). The mast cell-committed progenitor. II. W/Wv mice do not make mast cell-committed progenitors and S1/S1d fibroblasts do not support development of normal mast cell-committed progenitors. J Immunol 142, Jonsson, H., Allen, P., and Peng, S.L. (2005). Inflammatory arthritis requires Foxo3a to prevent Fas ligand-induced neutrophil apoptosis. Nat Med 11, Jude, C.D., Climer, L., Xu, D., Artinger, E., Fisher, J.K., and Ernst, P. (2007). Unique and independent roles for MLL in adult hematopoietic stem cells and progenitors. Cell Stem Cell 1, Juntilla, M.M., Patil, V.D., Calamito, M., Joshi, R.P., Birnbaum, M.J., and Koretzky, G.A. (2010). AKT1 and AKT2 maintain hematopoietic stem cell function by regulating reactive oxygen species. Blood 115, Karanu, F.N., Murdoch, B., Gallacher, L., Wu, D.M., Koremoto, M., Sakano, S., and Bhatia, M. (2000). The notch ligand jagged-1 represents a novel growth factor of human hematopoietic stem cells. J Exp Med 192, Karlsson, G., Blank, U., Moody, J.L., Ehinger, M., Singbrant, S., Deng, C.X., and Karls-
80 54 son, S. (2007). Smad4 is critical for self-renewal of hematopoietic stem cells. J Exp Med 204, Kato, Y., Iwama, A., Tadokoro, Y., Shimoda, K., Minoguchi, M., Akira, S., Tanaka, M., Miyajima, A., Kitamura, T., and Nakauchi, H. (2005). Selective activation of STAT5 unveils its role in stem cell self-renewal in normal and leukemic hematopoiesis. J Exp Med 202, Katsumoto, T., Aikawa, Y., Iwama, A., Ueda, S., Ichikawa, H., Ochiya, T., and Kitabayashi, I. (2006). MOZ is essential for maintenance of hematopoietic stem cells. Genes Dev 20, Kaushansky, K. (2003). Thrombopoietin: a tool for understanding thrombopoiesis. J Thromb Haemost 1, Kay, H.E. (1965). How Many Cell-Generations? Lancet 2, Kiel, M.J., Yilmaz, O.H., Iwashita, T., Terhorst, C., and Morrison, S.J. (2005). SLAM family receptors distinguish hematopoietic stem and progenitor cells and reveal endothelial niches for stem cells. Cell 121, Kim, D., Peng, X.C., and Sun, X.H. (1999). Massive apoptosis of thymocytes in T-celldeficient Id1 transgenic mice. Mol Cell Biol 19, Kim, I., He, S., Yilmaz, O.H., Kiel, M.J., and Morrison, S.J. (2006). Enhanced purification of fetal liver hematopoietic stem cells using SLAM family receptors. Blood 108, Kimura, S., Roberts, A.W., Metcalf, D., and Alexander, W.S. (1998). Hematopoietic stem cell deficiencies in mice lacking c-mpl, the receptor for thrombopoietin. Proc Natl Acad Sci U S A 95, Kirstetter, P., Anderson, K., Porse, B.T., Jacobsen, S.E., and Nerlov, C. (2006). Activation of the canonical Wnt pathway leads to loss of hematopoietic stem cell repopulation and multilineage differentiation block. Nat Immunol 7, Kitabayashi, I., Aikawa, Y., Nguyen, L.A., Yokoyama, A., and Ohki, M. (2001a). Activation of AML1-mediated transcription by MOZ and inhibition by the MOZ-CBP fusion protein. EMBO J 20, Kitabayashi, I., Aikawa, Y., Yokoyama, A., Hosoda, F., Nagai, M., Kakazu, N., Abe, T., and Ohki, M. (2001b). Fusion of MOZ and p300 histone acetyltransferases in acute monocytic leukemia with a t(8;22)(p11;q13) chromosome translocation. Leukemia 15,
81 55 Kollet, O., Dar, A., Shivtiel, S., Kalinkovich, A., Lapid, K., Sztainberg, Y., Tesio, M., Samstein, R.M., Goichberg, P., Spiegel, A., et al. (2006). Osteoclasts degrade endosteal components and promote mobilization of hematopoietic progenitor cells. Nat Med 12, Krosl, J., Austin, P., Beslu, N., Kroon, E., Humphries, R.K., and Sauvageau, G. (2003). In vitro expansion of hematopoietic stem cells by recombinant TAT-HOXB4 protein. Nat Med 9, Kumaravelu, P., Hook, L., Morrison, A.M., Ure, J., Zhao, S., Zuyev, S., Ansell, J., and Medvinsky, A. (2002). Quantitative developmental anatomy of definitive haematopoietic stem cells/long-term repopulating units (HSC/RUs): role of the aorta-gonad-mesonephros (AGM) region and the yolk sac in colonisation of the mouse embryonic liver. Development 129, Kunisato, A., Chiba, S., Nakagami-Yamaguchi, E., Kumano, K., Saito, T., Masuda, S., Yamaguchi, T., Osawa, M., Kageyama, R., Nakauchi, H., et al. (2003). HES-1 preserves purified hematopoietic stem cells ex vivo and accumulates side population cells in vivo. Blood 101, Lacorazza, H.D., Yamada, T., Liu, Y., Miyata, Y., Sivina, M., Nunes, J., and Nimer, S.D. (2006). The transcription factor MEF/ELF4 regulates the quiescence of primitive hematopoietic cells. Cancer Cell 9, Lapidot, T., Dar, A., and Kollet, O. (2005). How do stem cells find their way home? Blood 106, Laurenti, E., Varnum-Finney, B., Wilson, A., Ferrero, I., Blanco-Bose, W.E., Ehninger, A., Knoepfler, P.S., Cheng, P.F., MacDonald, H.R., Eisenman, R.N., et al. (2008). Hematopoietic stem cell function and survival depend on c-myc and N-Myc activity. Cell Stem Cell 3, Lee, D., Kim, T., and Lim, D.S. (2011). The Er71 is an Important Regulator of Hematopoietic Stem Cells in Adult Mice. Stem Cells. Lemischka, I.R., Raulet, D.H., and Mulligan, R.C. (1986). Developmental potential and dynamic behavior of hematopoietic stem cells. Cell 45, Lessard, J., and Sauvageau, G. (2003). Bmi-1 determines the proliferative capacity of normal and leukaemic stem cells. Nature 423, Lessard, J., Schumacher, A., Thorsteinsdottir, U., van Lohuizen, M., Magnuson, T., and
82 56 Sauvageau, G. (1999). Functional antagonism of the Polycomb-Group genes eed and Bmi1 in hemopoietic cell proliferation. Genes Dev 13, Li, C.L., and Johnson, G.R. (1992). Rhodamine123 reveals heterogeneity within murine Lin-, Sca-1+ hemopoietic stem cells. J Exp Med 175, Liu, B., Sun, Y., Jiang, F., Zhang, S., Wu, Y., Lan, Y., Yang, X., and Mao, N. (2003). Disruption of Smad5 gene leads to enhanced proliferation of high-proliferative potential precursors during embryonic hematopoiesis. Blood 101, Liu, Y., Elf, S.E., Miyata, Y., Sashida, G., Huang, G., Di Giandomenico, S., Lee, J.M., Deblasio, A., Menendez, S., Antipin, J., et al. (2009). p53 regulates hematopoietic stem cell quiescence. Cell Stem Cell 4, Lo Celso, C., Fleming, H.E., Wu, J.W., Zhao, C.X., Miake-Lye, S., Fujisaki, J., Cote, D., Rowe, D.W., Lin, C.P., and Scadden, D.T. (2009). Live-animal tracking of individual haematopoietic stem/progenitor cells in their niche. Nature 457, Lymperi, S., Ersek, A., Ferraro, F., Dazzi, F., and Horwood, N.J. (2011). Inhibition of osteoclast function reduces hematopoietic stem cell numbers in vivo. Blood 117, Maillard, I., Koch, U., Dumortier, A., Shestova, O., Xu, L., Sai, H., Pross, S.E., Aster, J.C., Bhandoola, A., Radtke, F., et al. (2008). Canonical notch signaling is dispensable for the maintenance of adult hematopoietic stem cells. Cell Stem Cell 2, Mancini, S.J., Mantei, N., Dumortier, A., Suter, U., MacDonald, H.R., and Radtke, F. (2005). Jagged1-dependent Notch signaling is dispensable for hematopoietic stem cell self-renewal and differentiation. Blood 105, Mansour, A., Abou-Ezzi, G., Sitnicka, E., SE, W.J., Wakkach, A., and Blin-Wakkach, C. (2012). Osteoclasts promote the formation of hematopoietic stem cell niches in the bone marrow. J Exp Med 209, Matsumoto, A., Takeishi, S., Kanie, T., Susaki, E., Onoyama, I., Tateishi, Y., Nakayama, K., and Nakayama, K.I. (2011). p57 Is Required for Quiescence and Maintenance of Adult Hematopoietic Stem Cells. Cell Stem Cell 9, Matthews, W., Jordan, C.T., Wiegand, G.W., Pardoll, D., and Lemischka, I.R. (1991). A receptor tyrosine kinase specific to hematopoietic stem and progenitor cell-enriched populations. Cell 65, Mayani, H., Dragowska, W., and Lansdorp, P.M. (1993). Characterization of function-
83 57 ally distinct subpopulations of CD34+ cord blood cells in serum-free long-term cultures supplemented with hematopoietic cytokines. Blood 82, Mayer, T.C., and Green, M.C. (1968). An experimental analysis of the pigment defect caused by mutations at the W and S1 loci in mice. Dev Biol 18, McAlister, I., Wolf, N.S., Pietrzyk, M.E., Rabinovitch, P.S., Priestley, G., and Jaeger, B. (1990). Transplantation of hematopoietic stem cells obtained by a combined dye method fractionation of murine bone marrow. Blood 75, Medvinsky, A., and Dzierzak, E. (1996). Definitive hematopoiesis is autonomously initiated by the AGM region. Cell 86, Mendez-Ferrer, S., Michurina, T.V., Ferraro, F., Mazloom, A.R., Macarthur, B.D., Lira, S.A., Scadden, D.T., Ma ayan, A., Enikolopov, G.N., and Frenette, P.S. (2010). Mesenchymal and haematopoietic stem cells form a unique bone marrow niche. Nature 466, Mercer, W.E., Shields, M.T., Amin, M., Sauve, G.J., Appella, E., Romano, J.W., and Ullrich, S.J. (1990). Negative growth regulation in a glioblastoma tumor cell line that conditionally expresses human wild-type p53. Proc Natl Acad Sci U S A 87, Miller, C.L., Rebel, V.I., Helgason, C.D., Lansdorp, P.M., and Eaves, C.J. (1997). Impaired steel factor responsiveness differentially affects the detection and long-term maintenance of fetal liver hematopoietic stem cells in vivo. Blood 89, Milne, T.A., Briggs, S.D., Brock, H.W., Martin, M.E., Gibbs, D., Allis, C.D., and Hess, J.L. (2002). MLL targets SET domain methyltransferase activity to Hox gene promoters. Mol Cell 10, Milner, L.A., Kopan, R., Martin, D.I., and Bernstein, I.D. (1994). A human homologue of the Drosophila developmental gene, Notch, is expressed in CD34+ hematopoietic precursors. Blood 83, Milyavsky, M., Gan, O.I., Trottier, M., Komosa, M., Tabach, O., Notta, F., Lechman, E., Hermans, K.G., Eppert, K., Konovalova, Z., et al. (2010). A distinctive DNA damage response in human hematopoietic stem cells reveals an apoptosis-independent role for p53 in self-renewal. Cell Stem Cell 7, Miyake, N., Brun, A.C., Magnusson, M., Miyake, K., Scadden, D.T., and Karlsson, S. (2006). HOXB4-induced self-renewal of hematopoietic stem cells is significantly enhanced by p21 deficiency. Stem Cells 24,
84 58 Miyamoto, K., Araki, K.Y., Naka, K., Arai, F., Takubo, K., Yamazaki, S., Matsuoka, S., Miyamoto, T., Ito, K., Ohmura, M., et al. (2007). Foxo3a is essential for maintenance of the hematopoietic stem cell pool. Cell Stem Cell 1, Morrison, S.J., Prowse, K.R., Ho, P., and Weissman, I.L. (1996). Telomerase activity in hematopoietic cells is associated with self-renewal potential. Immunity 5, Morrison, S.J., and Weissman, I.L. (1994). The long-term repopulating subset of hematopoietic stem cells is deterministic and isolatable by phenotype. Immunity 1, Naka, K., Hoshii, T., Muraguchi, T., Tadokoro, Y., Ooshio, T., Kondo, Y., Nakao, S., Motoyama, N., and Hirao, A. (2010). TGF-beta-FOXO signalling maintains leukaemiainitiating cells in chronic myeloid leukaemia. Nature 463, Nakajima, T., Uchida, C., Anderson, S.F., Lee, C.G., Hurwitz, J., Parvin, J.D., and Montminy, M. (1997). RNA helicase A mediates association of CBP with RNA polymerase II. Cell 90, Navarro, S., Meza, N.W., Quintana-Bustamante, O., Casado, J.A., Jacome, A., McAllister, K., Puerto, S., Surralles, J., Segovia, J.C., and Bueren, J.A. (2006). Hematopoietic dysfunction in a mouse model for Fanconi anemia group D1. Mol Ther 14, Nijnik, A., Woodbine, L., Marchetti, C., Dawson, S., Lambe, T., Liu, C., Rodrigues, N.P., Crockford, T.L., Cabuy, E., Vindigni, A., et al. (2007). DNA repair is limiting for haematopoietic stem cells during ageing. Nature 447, Nilsson, S.K., Johnston, H.M., and Coverdale, J.A. (2001). Spatial localization of transplanted hemopoietic stem cells: inferences for the localization of stem cell niches. Blood 97, Nilsson, S.K., and Simmons, P.J. (2004). Transplantable stem cells: home to specific niches. Curr Opin Hematol 11, Nocka, K., Majumder, S., Chabot, B., Ray, P., Cervone, M., Bernstein, A., and Besmer, P. (1989). Expression of c-kit gene products in known cellular targets of W mutations in normal and W mutant mice--evidence for an impaired c-kit kinase in mutant mice. Genes Dev 3, Notta, F., Doulatov, S., Laurenti, E., Poeppl, A., Jurisica, I., and Dick, J.E. (2011). Isolation of single human hematopoietic stem cells capable of long-term multilineage engraftment. Science 333,
85 59 Oguro, H., Iwama, A., Morita, Y., Kamijo, T., van Lohuizen, M., and Nakauchi, H. (2006). Differential impact of Ink4a and Arf on hematopoietic stem cells and their bone marrow microenvironment in Bmi1-deficient mice. J Exp Med 203, Ohlstein, B., Kai, T., Decotto, E., and Spradling, A. (2004). The stem cell niche: theme and variations. Curr Opin Cell Biol 16, Palis, J., Robertson, S., Kennedy, M., Wall, C., and Keller, G. (1999). Development of erythroid and myeloid progenitors in the yolk sac and embryo proper of the mouse. Development 126, Parganas, E., Wang, D., Stravopodis, D., Topham, D.J., Marine, J.C., Teglund, S., Vanin, E.F., Bodner, S., Colamonici, O.R., van Deursen, J.M., et al. (1998). Jak2 is essential for signaling through a variety of cytokine receptors. Cell 93, Park, I.K., Qian, D., Kiel, M., Becker, M.W., Pihalja, M., Weissman, I.L., Morrison, S.J., and Clarke, M.F. (2003). Bmi-1 is required for maintenance of adult self-renewing haematopoietic stem cells. Nature 423, Perry, S.S., Zhao, Y., Nie, L., Cochrane, S.W., Huang, Z., and Sun, X.H. (2007). Id1, but not Id3, directs long-term repopulating hematopoietic stem-cell maintenance. Blood 110, Pettengell, R., Luft, T., Henschler, R., Hows, J.M., Dexter, T.M., Ryder, D., and Testa, N.G. (1994). Direct comparison by limiting dilution analysis of long-term culture-initiating cells in human bone marrow, umbilical cord blood, and blood stem cells. Blood 84, Phillips, R.L., Ernst, R.E., Brunk, B., Ivanova, N., Mahan, M.A., Deanehan, J.K., Moore, K.A., Overton, G.C., and Lemischka, I.R. (2000). The genetic program of hematopoietic stem cells. Science 288, Ploemacher, R.E., van der Sluijs, J.P., van Beurden, C.A., Baert, M.R., and Chan, P.L. (1991). Use of limiting-dilution type long-term marrow cultures in frequency analysis of marrow-repopulating and spleen colony-forming hematopoietic stem cells in the mouse. Blood 78, Ploemacher, R.E., van der Sluijs, J.P., Voerman, J.S., and Brons, N.H. (1989). An in vitro limiting-dilution assay of long-term repopulating hematopoietic stem cells in the mouse. Blood 74, Potocnik, A.J., Brakebusch, C., and Fassler, R. (2000). Fetal and adult hematopoietic
86 60 stem cells require beta1 integrin function for colonizing fetal liver, spleen, and bone marrow. Immunity 12, Prasher, J.M., Lalai, A.S., Heijmans-Antonissen, C., Ploemacher, R.E., Hoeijmakers, J.H., Touw, I.P., and Niedernhofer, L.J. (2005). Reduced hematopoietic reserves in DNA interstrand crosslink repair-deficient Ercc1-/- mice. EMBO J 24, Qian, H., Buza-Vidas, N., Hyland, C.D., Jensen, C.T., Antonchuk, J., Mansson, R., Thoren, L.A., Ekblom, M., Alexander, W.S., and Jacobsen, S.E. (2007). Critical role of thrombopoietin in maintaining adult quiescent hematopoietic stem cells. Cell Stem Cell 1, Rebel, V.I., Kung, A.L., Tanner, E.A., Yang, H., Bronson, R.T., and Livingston, D.M. (2002). Distinct roles for CREB-binding protein and p300 in hematopoietic stem cell selfrenewal. Proc Natl Acad Sci U S A 99, Reese, J.S., Liu, L., and Gerson, S.L. (2003). Repopulating defect of mismatch repairdeficient hematopoietic stem cells. Blood 102, Reya, T., Duncan, A.W., Ailles, L., Domen, J., Scherer, D.C., Willert, K., Hintz, L., Nusse, R., and Weissman, I.L. (2003). A role for Wnt signalling in self-renewal of haematopoietic stem cells. Nature 423, Rhodes, K.E., Gekas, C., Wang, Y., Lux, C.T., Francis, C.S., Chan, D.N., Conway, S., Orkin, S.H., Yoder, M.C., and Mikkola, H.K. (2008). The emergence of hematopoietic stem cells is initiated in the placental vasculature in the absence of circulation. Cell Stem Cell 2, Ringrose, L., and Paro, R. (2004). Epigenetic regulation of cellular memory by the Polycomb and Trithorax group proteins. Annu Rev Genet 38, Rizo, A., Olthof, S., Han, L., Vellenga, E., de Haan, G., and Schuringa, J.J. (2009). Repression of BMI1 in normal and leukemic human CD34(+) cells impairs self-renewal and induces apoptosis. Blood 114, Robin, C., and Durand, C. (2010). The roles of BMP and IL-3 signaling pathways in the control of hematopoietic stem cells in the mouse embryo. Int J Dev Biol 54, Roegiers, F., and Jan, Y.N. (2004). Asymmetric cell division. Curr Opin Cell Biol 16, Rosendaal, M., Hodgson, G.S., and Bradley, T.R. (1979). Organization of haemopoietic stem cells: the generation-age hypothesis. Cell Tissue Kinet 12,
87 61 Rossi, D.J., Seita, J., Czechowicz, A., Bhattacharya, D., Bryder, D., and Weissman, I.L. (2007). Hematopoietic stem cell quiescence attenuates DNA damage response and permits DNA damage accumulation during aging. Cell Cycle 6, Russell, E.S. (1949). Analysis of pleiotropism at the W-locus in the mouse; relationship between the effects of W and Wv substitution on hair pigmentation and on erythrocytes. Genetics 34, Ruzankina, Y., Pinzon-Guzman, C., Asare, A., Ong, T., Pontano, L., Cotsarelis, G., Zediak, V.P., Velez, M., Bhandoola, A., and Brown, E.J. (2007). Deletion of the developmentally essential gene ATR in adult mice leads to age-related phenotypes and stem cell loss. Cell Stem Cell 1, Sakai, R., Kajiume, T., Inoue, H., Kanno, R., Miyazaki, M., Ninomiya, Y., and Kanno, M. (2003). TCDD treatment eliminates the long-term reconstitution activity of hematopoietic stem cells. Toxicol Sci 72, Sauvageau, G., Lansdorp, P.M., Eaves, C.J., Hogge, D.E., Dragowska, W.H., Reid, D.S., Largman, C., Lawrence, H.J., and Humphries, R.K. (1994). Differential expression of homeobox genes in functionally distinct CD34+ subpopulations of human bone marrow cells. Proc Natl Acad Sci U S A 91, Sauvageau, G., Thorsteinsdottir, U., Eaves, C.J., Lawrence, H.J., Largman, C., Lansdorp, P.M., and Humphries, R.K. (1995). Overexpression of HOXB4 in hematopoietic cells causes the selective expansion of more primitive populations in vitro and in vivo. Genes Dev 9, Scandura, J.M., Boccuni, P., Massague, J., and Nimer, S.D. (2004). Transforming growth factor beta-induced cell cycle arrest of human hematopoietic cells requires p57kip2 upregulation. Proc Natl Acad Sci U S A 101, Schofield, R. (1978). The relationship between the spleen colony-forming cell and the haemopoietic stem cell. Blood Cells 4, Serrano, M., Lin, A.W., McCurrach, M.E., Beach, D., and Lowe, S.W. (1997). Oncogenic ras provokes premature cell senescence associated with accumulation of p53 and p16ink4a. Cell 88, Sharma, S., Gurudutta, G.U., Satija, N.K., Pati, S., Afrin, F., Gupta, P., Verma, Y.K., Singh, V.K., and Tripathi, R.P. (2006). Stem cell c-kit and HOXB4 genes: critical roles and mechanisms in self-renewal, proliferation, and differentiation. Stem Cells Dev 15,
88 62 Sharpless, N.E., and DePinho, R.A. (2007). How stem cells age and why this makes us grow old. Nat Rev Mol Cell Biol 8, Shepherd, B.E., Kiem, H.P., Lansdorp, P.M., Dunbar, C.E., Aubert, G., LaRochelle, A., Seggewiss, R., Guttorp, P., and Abkowitz, J.L. (2007). Hematopoietic stem-cell behavior in nonhuman primates. Blood 110, Sherr, C.J. (1994). G1 phase progression: cycling on cue. Cell 79, Simon, J.A., and Kingston, R.E. (2009). Mechanisms of polycomb gene silencing: knowns and unknowns. Nat Rev Mol Cell Biol 10, Singbrant, S., Moody, J.L., Blank, U., Karlsson, G., Umans, L., Zwijsen, A., and Karlsson, S. (2006). Smad5 is dispensable for adult murine hematopoiesis. Blood 108, Snodgrass, R., and Keller, G. (1987). Clonal fluctuation within the haematopoietic system of mice reconstituted with retrovirus-infected stem cells. EMBO J 6, Stier, S., Cheng, T., Dombkowski, D., Carlesso, N., and Scadden, D.T. (2002). Notch1 activation increases hematopoietic stem cell self-renewal in vivo and favors lymphoid over myeloid lineage outcome. Blood 99, Sugiyama, T., Kohara, H., Noda, M., and Nagasawa, T. (2006). Maintenance of the hematopoietic stem cell pool by CXCL12-CXCR4 chemokine signaling in bone marrow stromal cell niches. Immunity 25, Suh, H.C., Ji, M., Gooya, J., Lee, M., Klarmann, K.D., and Keller, J.R. (2009). Cellnonautonomous function of Id1 in the hematopoietic progenitor cell niche. Blood 114, Sun, X.H. (1994). Constitutive expression of the Id1 gene impairs mouse B cell development. Cell 79, Szilvassy, S.J., Humphries, R.K., Lansdorp, P.M., Eaves, A.C., and Eaves, C.J. (1990). Quantitative assay for totipotent reconstituting hematopoietic stem cells by a competitive repopulation strategy. Proc Natl Acad Sci U S A 87, Takizawa, M., Nobuhisa, I., Igarashi, K., Ueno, M., Nakashima, K., Kitamura, T., and Taga, T. (2003). Requirement of gp130 signaling for the AGM hematopoiesis. Exp Hematol 31, Takubo, K., Goda, N., Yamada, W., Iriuchishima, H., Ikeda, E., Kubota, Y., Shima, H.,
89 63 Johnson, R.S., Hirao, A., Suematsu, M., et al. (2010). Regulation of the HIF-1alpha level is essential for hematopoietic stem cells. Cell Stem Cell 7, Terstappen, L.W., Huang, S., Safford, M., Lansdorp, P.M., and Loken, M.R. (1991). Sequential generations of hematopoietic colonies derived from single nonlineage-committed CD34+CD38- progenitor cells. Blood 77, Thompson, B.J., Jankovic, V., Gao, J., Buonamici, S., Vest, A., Lee, J.M., Zavadil, J., Nimer, S.D., and Aifantis, I. (2008). Control of hematopoietic stem cell quiescence by the E3 ubiquitin ligase Fbw7. J Exp Med 205, Thoren, L.A., Liuba, K., Bryder, D., Nygren, J.M., Jensen, C.T., Qian, H., Antonchuk, J., and Jacobsen, S.E. (2008). Kit regulates maintenance of quiescent hematopoietic stem cells. J Immunol 180, Thorsteinsdottir, U., Sauvageau, G., and Humphries, R.K. (1999). Enhanced in vivo regenerative potential of HOXB4-transduced hematopoietic stem cells with regulation of their pool size. Blood 94, Tothova, Z., Kollipara, R., Huntly, B.J., Lee, B.H., Castrillon, D.H., Cullen, D.E., Mc- Dowell, E.P., Lazo-Kallanian, S., Williams, I.R., Sears, C., et al. (2007). FoxOs are critical mediators of hematopoietic stem cell resistance to physiologic oxidative stress. Cell 128, Uchida, N., Dykstra, B., Lyons, K.J., Leung, F.Y., and Eaves, C.J. (2003). Different in vivo repopulating activities of purified hematopoietic stem cells before and after being stimulated to divide in vitro with the same kinetics. Exp Hematol 31, Van Den Berg, D.J., Sharma, A.K., Bruno, E., and Hoffman, R. (1998). Role of members of the Wnt gene family in human hematopoiesis. Blood 92, Vaziri, H., Dragowska, W., Allsopp, R.C., Thomas, T.E., Harley, C.B., and Lansdorp, P.M. (1994). Evidence for a mitotic clock in human hematopoietic stem cells: loss of telomeric DNA with age. Proc Natl Acad Sci U S A 91, Visnjic, D., Kalajzic, Z., Rowe, D.W., Katavic, V., Lorenzo, J., and Aguila, H.L. (2004). Hematopoiesis is severely altered in mice with an induced osteoblast deficiency. Blood 103, Wang, Z., Li, G., Tse, W., and Bunting, K.D. (2009). Conditional deletion of STAT5 in adult mouse hematopoietic stem cells causes loss of quiescence and permits efficient nonablative stem cell replacement. Blood 113,
90 64 Wiktor-Jedrzejczak, W.W., Ahmed, A., Szczylik, C., and Skelly, R.R. (1982). Hematological characterization of congenital osteopetrosis in op/op mouse. Possible mechanism for abnormal macrophage differentiation. J Exp Med 156, Willert, K., Brown, J.D., Danenberg, E., Duncan, A.W., Weissman, I.L., Reya, T., Yates, J.R., 3rd, and Nusse, R. (2003). Wnt proteins are lipid-modified and can act as stem cell growth factors. Nature 423, Wilson, A., Murphy, M.J., Oskarsson, T., Kaloulis, K., Bettess, M.D., Oser, G.M., Pasche, A.C., Knabenhans, C., Macdonald, H.R., and Trumpp, A. (2004). c-myc controls the balance between hematopoietic stem cell self-renewal and differentiation. Genes Dev 18, Winkler, I.G., Sims, N.A., Pettit, A.R., Barbier, V., Nowlan, B., Helwani, F., Poulton, I.J., van Rooijen, N., Alexander, K.A., Raggatt, L.J., et al. (2010). Bone marrow macrophages maintain hematopoietic stem cell (HSC) niches and their depletion mobilizes HSC. Blood. Wu, L., Aster, J.C., Blacklow, S.C., Lake, R., Artavanis-Tsakonas, S., and Griffin, J.D. (2000). MAML1, a human homologue of Drosophila mastermind, is a transcriptional coactivator for NOTCH receptors. Nat Genet 26, Xie, Y., Yin, T., Wiegraebe, W., He, X.C., Miller, D., Stark, D., Perko, K., Alexander, R., Schwartz, J., Grindley, J.C., et al. (2009). Detection of functional haematopoietic stem cell niche using real-time imaging. Nature 457, Yamazaki, S., Iwama, A., Takayanagi, S., Morita, Y., Eto, K., Ema, H., and Nakauchi, H. (2006). Cytokine signals modulated via lipid rafts mimic niche signals and induce hibernation in hematopoietic stem cells. EMBO J 25, Yang, L., Bryder, D., Adolfsson, J., Nygren, J., Mansson, R., Sigvardsson, M., and Jacobsen, S.E. (2005). Identification of Lin(-)Sca1(+)kit(+)CD34(+)Flt3- short-term hematopoietic stem cells capable of rapidly reconstituting and rescuing myeloablated transplant recipients. Blood 105, Yang, L., Wang, L., Geiger, H., Cancelas, J.A., Mo, J., and Zheng, Y. (2007). Rho GTPase Cdc42 coordinates hematopoietic stem cell quiescence and niche interaction in the bone marrow. Proc Natl Acad Sci U S A 104, Yeoh, J.S., van Os, R., Weersing, E., Ausema, A., Dontje, B., Vellenga, E., and de Haan, G. (2006). Fibroblast growth factor-1 and -2 preserve long-term repopulating ability of hematopoietic stem cells in serum-free cultures. Stem Cells 24,
91 65 Yilmaz, O.H., Kiel, M.J., and Morrison, S.J. (2006a). SLAM family markers are conserved among hematopoietic stem cells from old and reconstituted mice and markedly increase their purity. Blood 107, Yilmaz, O.H., Valdez, R., Theisen, B.K., Guo, W., Ferguson, D.O., Wu, H., and Morrison, S.J. (2006b). Pten dependence distinguishes haematopoietic stem cells from leukaemiainitiating cells. Nature 441, Yokota, A., Kimura, S., Tanaka, R., Takeuchi, M., Yao, H., Sakai, K., Nagao, R., Kuroda, J., Kamitsuji, Y., Kawata, E., et al. (2010). Osteoclasts are involved in the maintenance of dormant leukemic cells. Leuk Res 34, Yonish-Rouach, E., Resnitzky, D., Lotem, J., Sachs, L., Kimchi, A., and Oren, M. (1991). Wild-type p53 induces apoptosis of myeloid leukaemic cells that is inhibited by interleukin-6. Nature 352, Yoshida, K., Taga, T., Saito, M., Suematsu, S., Kumanogoh, A., Tanaka, T., Fujiwara, H., Hirata, M., Yamagami, T., Nakahata, T., et al. (1996). Targeted disruption of gp130, a common signal transducer for the interleukin 6 family of cytokines, leads to myocardial and hematological disorders. Proc Natl Acad Sci U S A 93, Yu, H., and Jove, R. (2004). The STATs of cancer--new molecular targets come of age. Nat Rev Cancer 4, Zeng, H., Yucel, R., Kosan, C., Klein-Hitpass, L., and Moroy, T. (2004). Transcription factor Gfi1 regulates self-renewal and engraftment of hematopoietic stem cells. EMBO J 23, Zhang, C.C., Kaba, M., Ge, G., Xie, K., Tong, W., Hug, C., and Lodish, H.F. (2006). Angiopoietin-like proteins stimulate ex vivo expansion of hematopoietic stem cells. Nat Med 12, Zhang, J., Niu, C., Ye, L., Huang, H., He, X., Tong, W.G., Ross, J., Haug, J., Johnson, T., Feng, J.Q., et al. (2003). Identification of the haematopoietic stem cell niche and control of the niche size. Nature 425, Zheng, J., Huynh, H., Umikawa, M., Silvany, R., and Zhang, C.C. (2011). Angiopoietinlike protein 3 supports the activity of hematopoietic stem cells in the bone marrow niche. Blood 117, Zhou, J., and Brune, B. (2006). Cytokines and hormones in the regulation of hypoxia inducible factor-1alpha (HIF-1alpha). Cardiovasc Hematol Agents Med Chem 4,
92 66 Zsebo, K.M., Williams, D.A., Geissler, E.N., Broudy, V.C., Martin, F.H., Atkins, H.L., Hsu, R.Y., Birkett, N.C., Okino, K.H., Murdock, D.C., et al. (1990). Stem cell factor is encoded at the Sl locus of the mouse and is the ligand for the c-kit tyrosine kinase receptor. Cell 63,
93 CHAPITRE 3 ARTICLE A Functional Screen to Identify Novel Effectors of Hematopoietic Stem Cell Activity Publié dans: Cell 2009 Apr 17;137(2): PMID:
94 68 3 A Functional Screen to Identify Novel Effectors of Hematopoietic Stem Cell Activity Eric Deneault 1, Sonia Cellot 1, Amélie Faubert 1, Jean-Philippe Laverdure 1, Mélanie Fréchette 1, Jalila Chagraoui 1, Nadine Mayotte 1, Martin Sauvageau 1, Stephen B. Ting 1 and Guy Sauvageau 1,2,* 1. Molecular Genetics of Stem Cells Laboratory, Institute of Research in Immunology and Cancer (IRIC); University of Montreal; Montreal, Quebec, H3C 3J7; Canada. 2. Division of Hematology and Leukemia Cell Bank of Quebec (BCLQ); Maisonneuve- Rosemont Hospital; Montreal, Quebec, H1T 2M4; Canada. *Correspondence: Guy Sauvageau; phone: ; fax:
95 Contribution des Co-Auteurs Le chapitre 3 décrit la conception et la réalisation d un nouveau type de criblage fonctionnel permettant la découverte de nouveaux gènes impliqués dans l activité des cellules souches hématopoïétiques. Ma contribution à cet article est majeure (>95%). La liste des gènes candidats pour le criblage a été dressée par Amélie Faubert. Le criblage a été planifié par Guy Sauvageau et moi-même. J ai effectué toutes les expérimentations et analyses. Les co-auteurs ont apporté une aide technique. J ai écrit le manuscrit en collaboration avec Sonia Cellot sous la supervision de Guy Sauvageau. Ma contribution en pourcentage aux différentes figures et tables de l article est : Figure 3.1 : 100% Figure 3.2 : 100% Figure 3.3 : 100% Figure 3.4 : 100% Figure 3.5 : 100% Figure 3.6 : 100% Figure S3.1 : 50% Figure S3.2 : 100% Figure S3.3 : 100% Figure S3.4 : 100% Figure S3.5 : 100% Table 3.1 : 100% Table S3.1 : 100% Table S3.2 : 100%
96 70 Table S3.3 : 100% Table S4 : 100% Table S5 : 100% Table S6 : 100%
97 Summary Despite tremendous progress made towards the identification of the molecular circuitry that governs cell fate in embryonic stem cells, genes controlling this process in the adult hematopoietic stem cell have proven more difficult to unmask. We now report the results of a novel gain-of-function screening approach, which identified a series of 18 nuclear factors that affect hematopoietic stem cell activity. Overexpression of 10 of these factors resulted in an increased repopulating activity compared to unmanipulated cells. Interestingly, at least 4 of the 18 factors, Fos, Tcfec, Hmgb1 and Sfpi1, show non-cell autonomous functions. The utilization of this screening method together with the creation of a database enriched for potential determinants of hematopoietic stem cell self-renewal will serve as a resource to uncover regulatory networks in these cells.
98 Introduction The mature cell contingent of adult hematopoietic tissue is continuously replenished during the lifespan of an animal by the periodic supplies from hematopoietic stem cells (HSC) that reside in a niche. To maintain blood homeostasis, these primitive cells rely on two critical properties, namely multipotency and self-renewal. The former enables differentiation into multiple lineages, while the latter ensures preservation of HSC fate upon cellular division. By definition, a self-renewal division implies that an HSC is permissive to cell cycle entry, while restrained from engaging in differentiation, apoptosis or senescence pathways. The transcriptional regulatory network of HSC self-renewal still remains largely undefined, an observation that contrasts with that of embryonic stem cells (ESC) for which self-renewal is increasingly dissected molecularly (reviewed in (Jaenisch and Young, 2008)). Only a few nuclear factors have been documented as promoters of HSC expansion (reviewed in (Hai-Jiang et al., 2008)). Of these factors, Hoxb4 and its derivatives (Hoxa9, NA10HD) are among the most potent and best documented (Ohta et al., 2007; Thorsteinsdottir et al., 2002). The differential pace of progress propelling the fields of ESC and HSC research reflects, at least in part, seminal discoveries that rendered ESC more amenable to large scale experiments. First, although only observable as a transient state in vivo, ESC derived from the inner cell mass can be maintained in vitro as cell lines by the addition of serum (as a source of BMP) and LIF. Attempts to maintain or expand HSC ex vivo as homogenous populations have been modest and successful development of cell lines have not been reported, hampering harvest of large numbers of HSC. Second, a stringent surrogate marker to follow the HSC multipotent state, comparable to the pluripotency tags of Oct4, Nanog, AP or SSEA1 for ESC, is still lacking. Albeit yielding small numbers, current cell sorting strategies allow isolation of HSC populations to near purity (Kiel et al., 2005). However, shortly upon facing the selective pressures of in vitro culture conditions, changes in cell phenotype are observed (Uchida et al., 2004), impeding HSC tracking in this context. The gold standard to confirm HSC activity for cells kept in culture remains the in vivo competitive repopulation assay. Importantly, generation of retroviral vectors provides highly efficient tools to infect and thereby modulate gene expression in both ESC and HSC (Root et al., 2006). The demonstration that in mouse fibroblasts, a given nucleo-cytoplasmic configuration, or state, can be reverted to a stem cell phenotype by the enforced overexpression
99 73 of four defined nuclear factors, i.e., Oct4, Sox2, c-myc and Klf4 stands as a conceptual breakthrough (Takahashi and Yamanaka, 2006). Indeed, the ability to create induced pluripotent stem cells, or ips cells, suggests that a putative role for as yet unidentified nuclear factors in orchestrating HSC fate is probable. With this mindset, interrogation of stem cell expression profile databases was undertaken. From this dataset, a listing and ranking of nuclear factors whose transcripts were abundant in stem cell-enriched subpopulations was generated. Over 100 of the highest scoring candidates were then functionally tested in HSC, using a high-throughput overexpression in vitro to in vivo assay tailored to circumvent current limitations imposed by the biology of HSC. As detailed below, these studies serve as a further step forward into the exploration of the molecular circuitry that governs HSC self-renewal.
100 Results Selection and Ranking of Candidate Genes As a corollary of ESC studies, it can be proposed that HSC fate is also controlled by a series of master regulators analogous to Oct4 and several subordinate effectors, providing sound basis for the generation of a stem cell nuclear factors database. Towards this end, we created a database consisting of 689 nuclear factors (Figure 3.1A; Table S3.1; see also considered as candidate regulators of HSC activity. This list was predominantly derived from microarray gene expression profiling of normal and leukemia stem cells, including our recently generated FLA2 leukemia (1 in 1.5 cells is leukemia stem cell, G.S. et coll., in preparation). Genes obtained following a review of the literature on stem cell self-renewal were also added to the list (see legend of Table S3.1 for references). Genes in this database were then ranked from 1 (lowest priority) to 10 (highest priority) based on 3 factors: differential expression between primitive and more mature cell fractions (e.g., HSC-enriched), expression level (high levels were given highest priority) and the consistency of findings between datasets. Genes with a score of 6 and above (n=139) were selected for functional studies, of which 104 were tested (Figure 3.1A; see also asterisk in Table S3.1). Interestingly, the list of selected candidates is highly enriched for bona fide regulators of hematopoiesis, namely Egr1, Gata2, Sfpi1 (PU.1), Foxo1, Meis1, Myb, Hoxa9, and Runx1 (Min et al., 2008) and reviewed in (Lessard et al., 2004). However, the majority of the other candidates have no reported function in primitive hematopoietic cells Design and Principle of the Screen The screening protocol is outlined in Figure 3.1B. In brief, high-titre retroviruses were produced in 96 well plates seeded with viral producer cells using an optimized procedure. Protein extracts derived from producer cells in each of the 104 wells were analyzed by western blotting which confirmed the presence of a FLAG-protein in 89% of the cases (Figure 3.1C provides 8 representative candidates; details for all 104 genes are listed in Table S3.2, 6 th column), with 92% of these proteins showing the expected molecular size (Table S3.2, compare 5 th and 6 th column). CD150 + CD48 - Lin - mouse bone marrow (BM) cells were infected during 5 days and transplanted at 2 different time points (i.e., day 0 and day 7 in Figure 3.1B). Under these conditions, the average gene transfer to the cultured CD150 + CD48 - Lin - cells was at 49±31% (Figure 3.1D provides 8 representative
101 75 A B scoring (6-10) technical considerations primary screen + validation pkof-1, -2, -3 5' LTR KOZAK-FLAG-ORF CD gene/well HSC activity regulators P PGK 1500 CD150 + CD48 - Lin - BM cells/well C D NS FLAG NS BM infection rate (%GFP + ) n = 104 genes; 8 representatives shown Mef2c Rela Smarcc1 GFP 3' LTR 5 days infection 7 days ex vivo culture day 0 day 7 1/8 well + 2x10 5 CD competitors per mouse Mef2c Rela Smarcc1 Fos Irf8 Crebl1* Mycn Pbx2 vector n = 104 genes; 8 representatives shown Cs Fos Irf8 Crebl1 Mycn Pbx2 vector Screen 100 kda 75 kda 50 kda 37 kda average 49±31% 1/8 well + 2x10 5 CD competitors per mouse CD CD Cs Figure 3.1 Experimental design of nuclear factors screening strategy. (A) A list of candidate genes (see Table S3.1 for the complete list) was generated as described in the result section. The 689 nuclear factors were subsequently ranked based on an algorithm that stratifies them according to properties predictive of self-renewal regulation. The highest scoring candidates (n=139) were further selected for functional assessment using a retroviral overexpression approach. Of these, 104 were tested (see * in Table S3.1) and the remaining 35 genes were excluded for technical reasons. (B) The coding sequence of each tested candidate was subcloned into 1 out of 3 modified MSCV vectors each containing a different reading frame (pkof-1, -2 and -3). Respective retroviral producers were seeded in a single well of a 96 well plate and co-cultured for 5 days with 1,500 CD150 + CD48 - Lin - freshly sorted bone marrow CD cells. Immediately upon infection (day 0), 1/8 th of each well was transplanted into 2 congenic recipient mice along with 2x10 5 total BM cells (CD ). A similar assay, this time using 3 recipient mice was performed following an additional week of ex vivo culture (day 7), on which the screen was performed. (C) Expression of candidate proteins in retroviralproducing cells was tested by western immunoblotting and revealed using an anti-flag antibody. A list of predicted and observed molecular weights for most proteins tested in this screen is available in Table S3.2. NS = non-specific signal; *example of a protein that could not be detected by western blot analysis (see also Table S3.2). (D) Range of retroviral gene transfer efficiencies of sampled candidate genes based on EGFP expression assessed at day 4 of HSC culture (only 8 representatives shown; dashed line represents average on all 104 genes). candidates; details for all 104 genes are listed in Table S3.3, 2 nd column). Harvested cells from each well were transplanted into irradiated recipients together with 2x10 5 congenic BM cells. Donor-derived peripheral white blood cell reconstitution was assessed after short (4 and 8 weeks) and long periods of time (12 and 16 weeks) post-transplantation.
102 76 Previous results obtained from several in vivo transplantation experiments, using freshly transduced CD150 + CD48 - Lin - cells, revealed marked inter-recipient heterogeneity in hematopoietic tissue reconstitution for a given candidate gene, thereby raising the critical issue of signal to noise discrimination. Optimization of this parameter was crucial for increasing the specificity of the screen while limiting to a minimum the number of mice that would be required. Towards this goal, we confirmed previous findings (Antonchuk et al., 2002) showing that the activity of Hoxb4-overexpressing HSC is enhanced during short-term cultures (see red line in Figure 3.2A). For control HSC (i.e., vectortransduced), we also confirmed a noticeable decline in their activity during the 7 day culture (black line in Figure 3.2A). Interestingly, this HSC activity was preserved during the infection period (Figure 3.2A). Importantly, we found that recipients of these cultured control CD150 + CD48 - Lin - cells showed much less variation in blood cell reconstitution levels than those transplanted with day 0 cells (compare error bars at day 0 versus day 7 on the black line in Figure 3.2A). In search for additional genes with Hoxb4-like activity, it appears that the signal to noise ratio is thus substantially enhanced by keeping cells in such cultures (Figure 3.2A). For this reason, the primary screen was performed with cells harvested at day 7 of the culture (see Screen in Figure 3.1B) Primary Screen and Validation The minimal cut-off level for selection of positive candidates in the primary screen was set based on the standard deviation of the mean reconstitution level observed in multiple recipients of Hoxb4-transduced CD150 + CD48 - Lin - cells (Figure 3.2B, see also shaded area in Figure 3.2A). We therefore expected the newly identified candidates to be equivalent to, or more potent than, Hoxb4 in inducing enhanced HSC activity. Using this criterion, a total of 18 hits were identified for a frequency of 17% (18/104; Figure 3.2B, middle and upper right panels; see also Table S3.3, 10 th column). These 18 hits included Cnbp, Erdr1, Fos, Hdac1, Hmgb1, Hnrpdl, Klf10, Pml, Prdm16, Sfpi1 (PU.1), Ski, Smarcc1 (Baf155), Sox4, Tcfec, Trim27, Vps72, Xbp1 and Zfp472. To validate the primary screen, we repeated the procedure described in Figure 3.1B in several independent experiments and confirmed 10 primary hits (upper panels in Figure 3.2C; details in Table S3.3). From left to right and top to bottom, genes are presented based on the level of statistical significance reached in these experiments, in comparison to control vector: Hoxb4 (positive control, gray in Figure 3.2C), Smarcc1, Vps72, Fos, Trim27, Sox4, Klf10, Ski, Prdm16, Erdr1 and Sfpi1, for a positive predictive value (PPV) of 56%. Although the other 8 candidates failed to demonstrate Hoxb4-like activity (i.e., shaded area in Figure 3.2A), it is noteworthy that they all significantly enhanced HSC activity to level above that detected with vector-transduced cells (see other less potent candidates in Figure 3.2A and C).
103 77 A 100% HSC activity (~8 CRU per mouse) B Donor-derived reconstitution (%CD ) C Donor-derived reconstitution (%CD ) day -5 infection day 0 7 day culture day 7 HSC sort Based on peripheral blood reconstitution at 16 weeks weeks post-transplantation Hoxb4 Klf10 Tcfec Hoxb4 controls Smarcc1 Ski p=2.6x10⁻⁶ Zfp p=2.1x10⁻⁴ p=5.9x Hnrpdl Hdac p=0.002 p= Primary screen Hoxb4 vector Vps72 Prdm16 Hmgb candidates Fos Erdr1 Cnbp weeks post-transplantation Trim27 p=9.5x10⁻⁹ p=8.5x10⁻⁸ p=2.4x10⁻⁷ p=3.2x10⁻⁷ p=5.1x10⁻⁷ p=1.8x10⁻⁶ vector Validation experiments p=4.0x10⁻⁶ p=8.8x10⁻⁴ low signal to noise ratio Sfpi1 p=1.1x10⁻⁴ p=2.7x10⁻⁴ p= Pml p= Hoxb4-like cut-off high signal to noise ratio Sox4 p=1.0x10⁻⁶ Xbp1 p= candidate vector 18 considered for validation cut-off 86 not considered Hoxb4-like genes other less potent cand. Hes1 Hoxb4-like genes other less potent candiates Figure 3.2 Identification of positive candidates with Hoxb4-like activity. (A) Estimation of HSC activity during viral transduction and culture. Lines show estimation of HSC activity in recipients of day -5, day 0 or day 7 bone marrow cells transduced with Hoxb4 (red) or control vector (black). Two independent experiments were performed with purified and whole bone marrow (BM) cells for Hoxb4, and 3 with purified BM cells for controls. Extrapolation of HSC numbers in recipients (y axis) was based on relative reconstitution levels observed in the CRU assay performed with our starting HSC subpopulation in Figure S3.2B-C. In all experiments, each mouse received 8 equivalent day -5 HSC (representing 100% HSC activity and evaluated by CRU assay) and 20 equivalent fresh competitor HSC (see legend of Figure S3.2 for details). Cut-off for identification of Hoxb4-like candidates used in the primary screen/validation experiments (shaded area) is set based on the standard deviation/ error of the mean reconstitution level observed in multiple recipients of Hoxb4-transduced HSC. Cut-off for other less potent candidates (area between dotted lines) is used only in validation experiments and is based on statistical difference between candidates and vector control. (B) Graft-derived hematopoiesis was evaluated at 4 week intervals in recipients of cultured HSC during the primary screen. As a set of reference values, the left panel indicates peripheral blood reconstitution levels from mice transplanted with cells from cultures initiated with a positive regulator of self-renewal (Hoxb4) in relation to values observed with control vectors (mean of pkof-1, -2 and -3), all after 7 days of culture. Mean reconstitution level values for each of the 104 tested candidates (at day 7) are compiled and presented in the middle panel, with the established cut-off level for a gain-of-function readout. Candidates clustering above the cut-off
104 78 level for identification of Hoxb4-like genes (shaded area in Figure 3.2A), corresponding to 30% CD donor-derived cells in the primary screen, were sel ected for the validation experiments (upper right panel), while those below were disregarded (lower right panel). One candidate (Hes1) was eliminated based on the marked reduction in repopulation noted between early and late time points (upper line in lower right panel). Values are presented as mean±sem of independent experiments (n) for the left panel: n=2 for Hoxb4 and n=3 for control vector (mean of 3 mice per experiment); and as mean±sd for middle and right panels: n=3 mice for each candidate cdna. Note that several mice were eliminated at 12 or 16 weeks post-transplantation because they did not meet our criteria for hit selection (see also Table S3.3, 9 th and 10 th column). (C) Validation experiments confirming 10 Hoxb4-like genes and 8 other less potent candidates. P values were established at the 16 weeks post-transplantation time point. Values=mean±SEM. Number of independent experiments (n) per candidate gene equals 4, except for control vectors: n=8; Sox4, Zfp472, Xbp1 and Hnrpdl: n=5; Hoxb4, Cnbp, Ski and Prdm16: n=3. For each experiment, a mean of 3 mice per gene was evaluated; cand.=candidates. We then explored if the 10 newly identified Hoxb4-like genes are endogenously expressed in populations highly enriched in HSC. To test this, cells were sorted from hematopoietic tissues isolated from unmanipulated mice sacrificed at 3 different developmental stages including E14.5 fetal liver (HSC-enriched subset no. 1) and post-natal bone marrow, where a switch between cycling (3 weeks, subset no. 2) and quiescent (4 weeks, subset no. 3) HSC has been described (Bowie et al., 2006). In line with the selection of these factors in our database, all 10 genes are highly expressed in HSC-enriched populations with endogenous levels exceeding those of TATA Binding Protein (TBP), used as endogenous control (see relative Ct values for all HSC-enriched subsets in Figure S3.1A). Interestingly, most of these genes are expressed at higher levels in HSC-enriched populations than in total tissues (total bone marrow or fetal liver, Figure S3.1B). This observation is most prominent in fetal liver-derived HSC-enriched subset (upper panel Figure S3.1B). We next verified the level of overexpression achieved for each of these genes after retroviral infection in sorted CD150 + CD48 - Lin - ckit + Sca1 + BM cells and documented relative increases in mrna levels that could be as low as 3-fold (e.g., Smarcc1) to as high as 1,000-fold and above (e.g., Fos; Figure S3.1C) Most Genes Identified Confer Enhancement in HSC Activity One important question is whether the newly identified genes enhance or simply maintain input stem cell activity. To address this point, we compared the reconstitution levels by donor cells isolated (at day 7) from test cultures to that observed in recipients which received an equivalent number of freshly purified CD150 + CD48 - Lin - cells. As shown in Figure 3.3A, baseline long-term HSC (LT-HSC) activity (Sauvageau et al., 2004), measured at ~12-16% reconstitution level (see left black bars in Figure 3.3A), was essentially preserved during the 5 day infection period and set the baseline values for maintenance of input HSC activity (shaded area in Figure 3.3A). From this, we could
105 79 A Donor-derived reconstitution (%CD ) B Relative MAS vector (d0) Fresh cells (d-5) Fresh cells (d-5) vector (d7) vector (d0) vector (d7) Hoxb4 Smarcc1 Vps72 Fos Trim27 Sox4 Klf10 * genes Hoxb4 Smarcc1 Vps72 Fos Trim27 Sox4 Klf10 genes Ski Ski Prdm16 Erdr1 Sfpi1 Prdm16 Erdr1 Sfpi1 HSC activity: enhancement maintenance decreased C gene n p value vector vector (day 0) (day 7) vector (d0) vector (d7) Hoxb E-06 Smarcc E-06 Vps E-06 Fos E-06 Trim E-04 Sox E-04 Klf E-04 Ski E-04 Prdm E-05 Erdr E-04 Sfpi Figure 3.3 HSC activity is enhanced by overexpression of the newly identified Hoxb4-like genes. (A) Percentages of donorderived blood cells at 16 weeks post-transplantation in primary mice recipients of day 7 culture cells (experiments in Figure 3.2C) for the 10 identified hits. Bars at the far left show values for freshly purified CD150 + CD48 - Lin - cells, day 0 control cells (empty vector), as well as day 7 control and Hoxb4-transduced cells, as references. The shaded area represents mean reconstitution levels observed in mice transplanted with day 0 control-transduced HSC, ±1 SEM. Reconstitution values falling within this range are considered to reflect HSC activity derived from an injected dose of HSC equivalent to culture input numbers, i.e., 8 CRU (see Figure S3.2C); d-5= day -5; d0=day 0; d7=day 7. Note that 2 different cdna were tested for Trim27 (see Figure S3.5). (B) The mean activity of stem cells (MAS) was calculated from the data obtained in (A). As previously established, the MAS is equivalent to repopulation units (RU) divided by competitive repopulation units (CRU) (Ema and Nakauchi, 2000), where RU represents the donor-derived reconstitution level divided by the competitor-derived reconstitution level. MAS index was normalized to 1 for freshly sorted cells and excluded the gene transfer efficiency in its estimation for the candidate genes. In cases where gene transfer is low, this could lead to underestimated values. Grafts overexpressing genes shown in red and marked by an * give rise to a MAS significantly higher than day 0 control grafts (p 0.05); Note that values are presented as the MAS relative to that of fresh cells (d -5), which was set at a value of 1; d-5= day -5; d0=day 0; d7=day 7. (C) P values derived from MAS values presented in (B) comparing data obtained from control vectors (day 0 or 7) and validated genes. Day 0 p values framed in red (penultimate column) mirror the order and color code of candidate genes presented in (B) and are In comparison, day 7 p values are listed in the adjacent column; n=independent experiment; d0=day 0; d7=day 7 determine that all validated hits conferred a net increase in HSC reconstitution activity above that determined for fresh cells (Figure 3.3A). In order to further quantitate the impact of our validated genes on HSC activity, we used the mean activity of stem cell (MAS) index as reported by Ema and Nakauchi (Ema
106 80 and Nakauchi, 2000). This value, which provides a measure of the proliferative output per LT-HSC, is easily applicable to our culture condition since they were all initiated with a constant number of input LT-HSC measured at ~62 CRU per well (see Figure S3.2B-C for CRU assessment). The MAS was 3-fold higher for Hoxb4-transduced cells than for controls (Figure 3.3B). Similarly, the MAS varied between 2.8 (Vps72) to 4.9 (Trim27) for all 10 hits identified in our screen (Figure 3.3B). Except for Sfpi1 (p=0.18), all values reached statistical significance (see p values in red in Figure 3.3C) Impact of Candidate Genes on Cell Proliferation, Death and Dif- ferentiation In Vitro There is growing evidence to suggest that HSC self-renewal involves the active repression of a differentiation program, which is coupled to cell division (Cellot and Sauvageau, 2007). In support of this, we recently found that Hoxb4 or NA10HD-transduced cells, which actively undergo in vitro self-renewal divisions, show evidence of differentiation arrest [Figure 3.4A, left panels; (Cellot et al., 2007)]. We investigated if our newly identified hits behave similarly. To achieve this, we first analyzed the cytological characteristics of transduced and sorted CD150 + CD48 - Lin - cells after a 7 day in vitro culture period (prior to their transplantation). In this context, cultures initiated with control vector-transduced cells contained 70±8% of differentiated cells. These included neutrophils, monocytes and mast cells (Figure 3.4A, arrows in upper left panel with summary of results in right panel. Conversely, cellular differentiation was reduced in cultures initiated with HSC transduced with most of the candidates (Figure 3.4A, right panel). The increase in the proportion of undifferentiated to differentiated cells was most important for Vps72, Fos, Sox4, Klf10, Ski, Prdm16, Erdr1 and Sfpi1 when compared to cultures initiated with control vector-transduced HSC (see blue bars exceeding shaded area, representing mean of vector plus 2 standard deviations). Note that while some of these genes are as potent as Hoxb4 in this assay, none exceeds NA10HD in keeping cells undifferentiated. We also monitored transduced CD150 + CD48 - Lin - cells for cell death and proliferation. Figure 3.4B shows that all factors analyzed conferred a significant reduction in the proportion of dead cells harvested at day 4 of culture. Surprisingly, besides Hmgb1, there were no significant increases in total cell numbers in these cultures (Figure 3.4C). In fact, some genes such as Hoxb4, and possibly NA10HD, were associated with a reduction in total cell counts (Figure 3.4C) Transduced HSC Differentiate In vivo The in vitro differentiation arrest displayed by Hoxb4 or NA10HD-transduced HSC is eventually reverted following their transplantation in vivo (Cellot et al., 2007; Ohta et
107 81 A Blast Mast vector Hoxb4 NA10HD Neutrophil Monocyte BM cells distribution (gated on GFP + cell) Blasts Masts/Monocytes/Neutrophils vector Hoxb4 NA10HD Smarcc1 Vps72 Fos Trim27 Sox4 Klf10 Ski Prdm16 Erdr1 Tcfec Sfpi1 Hmgb1 Cnbp Xbp1 Hnrpdl Hdac1 B % Cell death (gated on GFP + cells) vector Hoxb4 NA10HD * Smarcc1 Vps72 Fos Trim27 Sox4 Klf10 Ski Prdm16 Erdr1 Tcfec Sfpi1 Hmgb1 C Cell count (x1000) vector * Hoxb4 NA10HD Smarcc1 Vps72 Fos Trim27 Sox4 Klf10 Ski Prdm16 Erdr1 Figure 3.4 In vitro differentiation, survival and proliferation profiles of cultured cells. * Tcfec Sfpi1 Hmgb1 (A) Morphological analysis of cytological preparations of the starting HSC fraction overexpressing most of identified primary hits at day 7 of culture. Proportions of immature (blasts: black arrow in middle left insert) versus terminally differentiated cells (neutrophils, monocytes and masts cells: black arrows in upper left insert) for respective cultures are depicted in the right panel. A field comprising 100 cells was examined per independent experiment (n) and values are presented as mean±sd; n=3, except for vector: n=6; Hoxb4, Ski, Tcfec, Sfpi1 and Hmgb1: n=1. The shaded area represents the mean of vector plus 2 standard deviations. Note that a vast majority of the less significant hits described in Figure 3.2C are included in this study (i.e., Tcfec, Hmgb1, Cnbp, Xbp1, Hnrpdl and Hdac1); BM=bone marrow. (B) Annexin V and PI stains were used to determine the fraction of cell death in cultures initiated with our validated hits and the less potent gene candidates (Tcfec and Hmgb1) as well as empty vector, Hoxb4 or NA10HD, serving as controls. Assessment was performed at the day 4 time point of culture. Values are presented as mean±sd of 2 independent experiments (n), where n represents the analysis of 30,000 cells; *=p (C) Cell proliferation was assessed by flow cytometry-based cell counts (y-axis) at day 4 of cultures. Analyses were performed for the same gene candidates as in (B). Values are presented as mean±sd of 2 independent experiments; *=p 0.05 al., 2007). Thus, depending on the environment, these 2 genes can either interfere with (e.g., in vitro in the presence of high levels of growth factors) or not affect (e.g., in vivo under steady state conditions) HSC differentiation. To determine if the newly identified regulators of HSC activity are similarly permissive to HSC differentiation in vivo, we used 4 different approaches. First, we evaluated the general health, spleen size and bone phenotype (white versus red) of each recipient. Except for the recipients of Prdm16- transduced cells, which eventually developed splenomegaly and myeloproliferation with
108 82 white femurs at 20 weeks post-transplantation (data not shown), none of the mice transplanted with cells expressing our 9 other genes ever presented this, or any other hematological phenotype. Second, we performed cytological evaluation of bone marrow and spleen derived from representative mice for each gene. Results from these analyses were normal for all groups, except for the Prdm16 cohort, which showed an excess of poorly differentiated myeloid cells in their bone marrow, as previously determined by others (Shing et al., 2007), and for the Ski cohort in which the number of lymphocytes in the bone marrow was reduced (data not shown). Besides recipients of Prdm16-transduced cells, spleens were never infiltrated with myeloid cells nor did they include enhanced numbers of erythroblasts. To confirm this, a third approach consisting of flow cytometry analysis on donor-derived (CD ) cells was devised. The results, presented in Figure 3.5A for the peripheral blood, bone marrow and thymus of a representative mouse (Trim27) and summarized in Figure 3.5B for all groups, largely confirmed our cytological evaluation. Indeed, except for recipients of Ski-transduced cells, which showed a marked reduction in B lymphocytes in their peripheral blood and marrow with a compensatory increase in other cell types, most groups of mice showed either normal distributions of various cell types or presented some minor variations. We further extended this analysis by gating only on CD /GFP + cells for genes in which this was possible and ended with the same conclusions, with the exception that B cell differentiation was not observed in Klf10-transduced cells (Figure S3.3A). Finally, clonal analyses of recipients that were reconstituted with retrovirally marked cells were performed on bone marrow (less than 5% T cells) and thymus (less than 5% non-t cells). A representative result is presented in Figure 3.5C for Trim27 which shows that identical clones contributed to the reconstitution of these 2 tissues, thus reinforcing the finding that these transduced HSC remain competent in T cell differentiation although they displayed enhanced reconstitution activity. This finding can be extended to all other genes except Ski, Prdm16 and Erdr1 for which we cannot be certain that the same clone contributed to thymic and bone marrow reconstitution (Figure S3.3B). We also used quantitative RT-PCR assays to monitor overexpression levels of the different transgenes in CD150 + CD48 - Lin -, CD150 + CD48 + Lin -, B and myeloid cells isolated from bone marrow to verify whether the in vivo reversal of the differentiation arrest noted in vitro (as shown in Figure 3.4A) was associated with loss of transgene expression. Results presented in Figure 3.5D suggest that overexpression of Vps72, Fos, Sox4, Klf10, Ski, Erdr1 and Sfpi1 does not interfere with in vivo differentiation as several types of immature/differentiated cells still express the transgene. However, in vivo extinction of the transgene may have occurred for the 3 following genes: Smarcc1, Trim27 and Prdm16. Together, these results confirm that the majority of the Hoxb4-like genes identified in our screen conferred enhanced HSC activity without causing hematological diseases or
109 83 C D Smarcc1 Th Trim27 (2240, 3467) GFP Sfpi1 M 0 3 (2071, 3463) 2 1 S P B M 0 S P Gated on B220+ cells B M PB BM Th Gated on CD3+ cells Hdac1 ( ) Hnrpdl ( ) Cnbp ( ) Xbp1 ( , 2816) Zfp472 ( ) Gated on CD11b+ cells Hmgb1 ( ) Hdac1 ( ) Hnrpdl ( ) Xbp1 ( , 2816) Cnbp ( ) Zfp472 ( ) Hmgb1 ( ) Sfpi1 (2069, 2071) Erdr1( ) Tcfec (2109, 3289) Ski ( ) Prdm16 ( ) Sox4 ( ) Klf10 (2111, 3292) Fos ( ) Trim27 ( ) Vps72 ( ) Smarcc1 ( ) vector ( ) NA10HD ( ) Gated on CD45.1+ cells B Sox4 ( ) 10 (2111, 3293) 10 Fos ( ) P (3448, 3887) 200 Klf10 (2081, 3472) S Erdr Trim27 ( ) 30 (2143, 3438) 100 Vps72 ( ) Th Smarcc1 ( ) BM vector ( ) PB NA10HD ( ) Gated on CD45.1+ cells %CD11b (2532, 3447) Fos 0 Hematopoietic reconstitution (%CD45.1) %B Gated on CD45.1+ cells %CD3+ Hematopoietic reconstitution Sox4 200 %B220 /CD3 /CD11b (see left panels in (B)) + Vps B 0 Sfpi1 (2069, 2071) CD Th FSC see Figure S3A SSC BM 1 Trx 4 Erdr1( ) PB CD11b Ctrl 6 Tcfec (2109, 3289) CD3 Relative fold difference B220 Ski (2556, 2557) (2115, 3294) Ski ( ) BM Prdm16 ( ) %CD45.1+ (see right panels in (B)) Klf10 (2111, 3292) A Figure 3.5 In vivo differentiation potential of HSC overexpressing validated hits. (A) In vivo differentiation potential along the lympho-myeloid lineages was assessed in long-term recipients (20 weeks post-transplantation) of HSC transduced with Trim27, used as an example. Immunophenotypic analysis by flow cytometry was performed using specific antibodies against B, T and myeloid cell surface markers (B220, CD3 and CD11b, respectively) on the CD45.1+ population of cells derived from the peripheral blood, bone marrow (BM) and thymus of these mice (and on CD45.1+/GFP+ cells in Figure S3.3A). (B) Compilation of B/Tlymphoid and myeloid cell percentages within the CD45.1+ population (left panels) and of CD45.1+ cell proportions in the B-, T-lymphoid or myeloid populations (right panels) of blood, thymus and BM tissues, as gathered in (A), for most of the primary hits. Values are presented as mean±sd. Mouse identification numbers are presented between brackets. Dashed lines indicate values obtained with control mice (vector) for the different hematopoietic tissues. Note that multilineage reconstitution was observed in all of mice analysed except for those transplanted with cells transduced with Ski, which showed a block in B-lymphoid differentiation. The proportion of CD45.1+ cells within the B-lymphoid or myeloid populations in the thymus was not calculated in the right panels because these populations represent less than 5% of total cells in this tissue. Since weak donor-derived reconstitution levels were observed in mice transplanted with control vector cells at day 7 of culture (i.e., 4% in Figure 3.3A), we used mice transplanted with control vector cells at day 0 of culture in this case. Values pertaining to less statistically significant hits are also presented (Tcfec, Zfp472, Hmgb1, Cnbp, Xbp1, Hnrpdl
110 84 and Hdac1). (C) Proviral integration pattern studies by Southern blot analysis performed on genomic DNA extracted from bone marrow (left panel) and thymus (right panel) of 3 longterm recipients of Trim27-overexpressing HSC. Each lane represents a specific mouse (ID number below). For a given animal, identical integrations are found in both tissues, indicating a common precursor cell origin. Identical clones are also observed in 2 distinct recipients, retrospective molecular evidence for a self-renewal division in vitro. Multi-potentiality (BM and thymus) analyses in reconstituted tissues harvested from primary recipients of culture cells overexpressing the various validated hits are shown in Figure S3.3B. (D) Q-RT-PCR analysis of mrna expression levels of 9 of the 10 newly identified Hoxb4-like gene transcripts. For technical reasons, Prdm16 was excluded from the analysis. RNA was extracted from distinct bone marrow cell fractions isolated from long-term, highly reconstituted recipients of day 7 culture cells (S=CD150 + CD48 - Lin - ; P=CD150 + CD48 + Lin - ; B=B220 + ; M=Mac + ). Average Ct values (representative of expression level) were determined with β-actin serving as an endogenous control to normalize levels of target gene expression. Relative fold differences were determined using control cells as a reference calibrator for each candidate gene. Reactions were done in triplicate; black bars represent mean endogenous expression levels of 3 independent wild-type mice (Ctrl); red bars represent mean overexpression levels of 2 transplanted mice (Trx) from 2 independent experiments. The identification numbers of mice used in this assay are presented between brackets. Note that control black bars on each panel are set at a relative fold difference value of 1. profoundly altering cell differentiation, while still overexpressing the transgenes at least until 20 weeks post-transplantation. Prdm16 was a notable exception Evidence of Self-Renewal Divisions by Transduced HSC We next verified if HSC transduced with each of the confirmed hits remained capable of symmetrical self-renewal divisions in vitro. To address this, we performed clonal analysis (i.e., proviral integration pattern) of hematopoietic tissues derived from selected recipients that were highly reconstituted (17-83% CD cells) at 20 weeks post-transplantation, a time point deemed sufficient for inferring that reconstitution is solely derived from the LT-HSC. For 8 of the 10 newly identified Hoxb4-like genes, namely Smarcc1, Vps72, Trim27, Sox4, Klf10, Ski, Prdm16 and Erdr1, we observed proviral DNA in the vast majority of mice that were analyzed (i.e., 43/49; Figure 3.6, 2 upper panels). Several different clones with long-term reconstitution ability contributed to hematopoiesis among different recipients from a given experiment, and from subsequent validation experiments. In several instances, we could identify the same proviral integrations in the DNA from 2 different mice reconstituted by cells derived from the same culture, demonstrating that LT-HSC self-renewal has indeed occurred in these cultures (see a-g in Figure 3.6). We also performed this analysis with the less potent candidates and found evidence for HSC self-renewal for Cnbp and Xbp1 (see clone h and i in Figure 3.6). Together, this data indicates that a significant proportion of HSC engineered to overexpress our validated
111 85 candidate experiment no. Smarcc1 1 2 Vps Trim27 1 Sox4 1 2 Klf Ski 1 mouse no =21 kb =5 kb GFP a b c d e f %CD %GFP X X X X X X X X X X X 12 X 12 X X candidate experiment no. Prdm Erdr1 1 2 Cnbp 1 2 Xbp1 1 2 Hnrpdl 1 2 mouse no =21 kb =5 kb GFP g h i %CD %GFP X X X X X X X X X X candidate experiment no. mouse no Fos Sfpi =21 kb =5 kb GFP see Table S4 β-actin %CD %GFP Figure 3.6 Clonal analysis to track HSC self-renewal divisions. Southern blot analyses of genomic DNA extracted from the bone marrow (BM) of selected longterm recipients (20 weeks post-transplantation) of day 7 culture cells. Each blot was hybridized with a GFP specific probe and systematically exposed for the same period of time. Each well was equally loaded taking into consideration donor-derived peripheral blood reconstitution level of recipients as measured 16 weeks post-transplantation (i.e., 17-83% CD cells). Top and bottom panels show gene sets for which proviral DNA was either detected or absent in the majority of recipients analyzed, respectively. For most bottom panels, the brightness and contrast was enhanced using photoshop to further verify the absence of integrated proviral DNA, and a β-actin probe was also used to confirm the presence of genomic DNA. Clones that self-renewed during the 7 day culture, prior to transplantation, are labelled a to i and identified in more than one recipient. X indicates that GFP expression was not detectable for these constructs/clones. Note that panel 5, representing the Trim27 gene, is also included in
112 86 Figure 3.5C (left panel). hits remained capable of symmetrical self-renewal divisions in vitro Evidence of a Non-Cell Autonomous Activity for Selected Genes Surprisingly, we could not reveal any integrated provirus in the majority of recipients transplanted with cells transduced with the Hoxb4-like genes Fos and Sfpi1 (Figure 3.6, bottom panels). This suggests that untransduced HSC in these cultures have favourably responded to some extrinsic factors. A detailed evaluation of recipients from which these observations are derived is provided in Table S3.4. Consistent with the presence of a non-cell autonomous effect, we observed that upon exposure to Fos or Sfpi1 viral producer cells, HSC contribution to long-term repopulation increased from 5-6% after 5 days of infection (i.e., day 0) to 26-31% with 7 additional days of culture [Table S3.4, compare %CD45.1 at day 0 (7 th column) versus day 7 (8 th column)]. The absence of Fos and Sfpi1 proviruses in the hematopoietic system of long-term recipients is surprising considering the high level of gene transfer to transplanted cells (Table S3.4, 3 rd column). This possibly indicates that these genes also intrinsically interfere with HSC repopulation when overexpressed, leading to depletion of transduced HSC. Similar observations were found with Tcfec and Hmgb1, members of the less potent category (data not shown). To provide a more direct evidence of non-cell autonomous activities for Fos, Sfpi1, Tcfec and Hmgb1, non-viral producing NIH 3T3 cells were transduced with each of these constructs and used as feeder cells replacing the viral producers described in Figure 3.1B. Overexpression of each of these 4 factors in NIH 3T3 cells was verified by quantitative RT-PCR, with a relative fold difference above baseline values ranging from 3 (Hmgb1) to 18,000 (Tcfec) -fold (data not shown). As per our experimental protocol, 1,500 CD150 + CD48 - Lin - cells were seeded on non-viral producing cells and maintained for 7 days prior to their transplantation into irradiated hosts. Strikingly, we found that 3 of the 4 genes, namely Fos, Tcfec and Hmgb1, conferred a similar impact on HSC activity whether viral-producing or non-viral producing cells were present in the cultures (see Table 3.1). Interestingly, background-level reconstitution was found in recipients of cells kept on Sfpi1-transduced NIH 3T3 cells, possibly indicating a more complex cellular network involved with this gene.
113 87 Table 3.1 HSC activity is enhanced extrinsically. Donor-derived reconstitution levels (%CD ) observed 16 weeks post-transplantation in mice transplanted with cells co-cultured either with virus-producing cells (GP+E-86) or similar cells not producing virus (NIH 3T3), both overexpressing selected genes. Values are presented as mean±sem of independent experiments (n) per candidate gene, where n=4, except for control vector: n=8. For each independent experiment, a mean of 3 mice per gene was evaluated; *=mice were analysed at 16 (experiments 1-2) and 8 (experiments 3-4) weeks post-transplantation; %GFP=gene transfer assessed by flow cytometry
114 Discussion In this study, we combined the power of expression profiling and functional studies to uncover candidate factors that impact on HSC activity. Our experimental procedure included an efficient production of high-titre retroviruses, a sharp and discriminating HSC gain-of-function signal optimized by an ex vivo culture step together with a robust and reliable in vivo assay (see importance of culture step for signal to noise discrimination in Figure S3.4). Using this strategy, we individually tested 104 pre-selected candidates revealing 18 genes that conferred a clear repopulation advantage to HSC. Of these, 10 displayed a Hoxb4-like effect thereby greatly extending the repertoire of potential regulators of HSC activity. These factors, which are highly and in some case preferentially expressed in HSC are implicated in a diversity of processes such as chromatin modification (e.g., Smarcc1 and Vps72), stress response (e.g., Fos) and gene transcription (e.g., Trim27 and Klf10) (see Table S3.4 and legend for more details on these Hoxb4-like factors). With this significant cohort of genes impacting on HSC activity, it was possible to discern a subset of 4 factors (i.e., Fos, Tcfec, Sfpi1 and Hmgb1) that exerted their influence on stem cell function through a non-cell autonomous phenomenon. Importantly, the non-cell autonomous activity of 3 of these 4 factors was confirmed in gene transfer-free conditions Identified Hits Display Hoxb4-like HSC Activity Similar to our previous results with Hoxb4-overexpressing HSC, 9 of the 10 hits identified in this screen also significantly conferred increased HSC activity to levels above those observed with input cells (genes in red in Figure 3.3B-C). Considering the ~50% average gene transfer level, not taken into consideration in the evaluation of the mean activity of stem cell (MAS) reported in Figure 3.3B, the impact of some of our confirmed hits was likely underestimated. Interestingly, our newly identified candidates also induced a maturation block in vitro, which was reversed in vivo. Moreover, and similar to Hoxb4, the majority of these genes failed to enhance cellular proliferation in vitro. The increase in HSC repopulation potential (i.e., activity) observed with Hoxb4 overexpression involves a net expansion (self-renewal) of these cells (Antonchuk et al., 2002). Although our validated candidates show Hoxb4-like effects and we could document self-renewal divisions in vitro for several HSC engineered to express these genes (Figure 3.6), it is important to stress that the formal proof for HSC expansion (enhancement in self-renewal divisions) as the driving force behind these effects will require inten-
115 89 sive investigations which combine serial determinations of HSC numbers at consecutive time points (e.g., CRU assay) with large scale clonal analyses as previously reported for the Hoxb4 gene (Antonchuk et al., 2002; Cellot et al., 2007). Indeed, among several possibilities, enhancement in proliferative potential combined with in vitro HSC maintenance could explain the Hoxb4-like effects observed with our validated hits. Secondary transplantation assays performed with selected candidates (Vps72, Klf10, Erdr1 and Fos, Table S3.5) argue against, but do not refute, such a possibility. The eventual identification of shared target genes between these factors would further strengthen this argumentation. Of interest, attempts to build transcriptional networks, or hubs, among the hit genes have currently proven inconclusive, when most of the respective mrna expression levels were assessed in HSC freshly transduced with each of the candidate genes (see SR Network in: Non-Cell Autonomous Enhancement in HSC Activity The non-cell autonomous influence exerted by Fos, Tcfec and Hmgb1 was confirmed in cultures with NIH 3T3 support confirming that gene transfer to sorted HSC was not required for these 3 genes. In line with these findings, the proportion of GFP-positive cells was 0% in recipients of cells kept for 7 days in NIH 3T3-containing cultures (see column 4 in Table 3.1). It is also important to stress that these so-called non-cell autonomous factors were identified in a context of overexpression, which in some case (i.e., Fos) was outstanding (e.g. 38,000-fold above endogenous levels in some experiments, data not shown) potentially resulting in toxicities to transduced HSC. It is therefore likely that several of these factors normally perform cell autonomous activity in steady-state hematopoiesis. Sfpi1 is a notable example for this (Rosenbauer et al., 2006). The results obtained with Sfpi1 during the screen and several additional experiments could not be confirmed in viral-free cultures. Reasons for this remain unclear. Several possibilities exist including the presence of non-cell autonomous contribution by some differentiated hematopoietic cells found in our culture or by essential co-factors unique to GP+E-86 viral producer cells. These results thus raise critical questions about a possible, and even essential, contribution by the feeder cells (in this case NIH 3T3) to the observed effects on HSC activity. While this level of characterization is beyond the scope of our paper, this set of experiments exposes a complexity, often underestimated, when using packaging (feeder) cell lines for co-cultures in gene transfer studies. Awareness of this potentially confounding factor must therefore be taken into consideration in future experiments. Although the demonstration of the non-cell autonomous activity is relatively
116 90 straightforward (e.g., 3 of the 4 factors described above), the proof for cell autonomous function (e.g., the other newly identified factors) is more difficult to obtain within the scope of our experimental design. Thus, it is possible that some of the 8 other Hoxb4-like genes (Smarcc1, Vps72, Trim27, Sox4, Klf10, Ski, Prdm16 and Erdr1) also or only display non-cell autonomous activity Future of the resource Entries pertaining to candidate nuclear factors implicated in stem cell activity are stored in an open access database ( as part of a building block in creating an interactive resource for the scientific community. Information thus far includes mrna expression profiles, together with specific probe and primer sets, blood reconstitution patterns over time with possibilities of data reanalysis, and the complete nuclear factor list with ranking criteria. This database will eventually include similar data emerging from ongoing gain- and loss-of-function screens from different laboratories that will exploit this resource. Thus far, nuclear factor candidates clustering in the uppermost levels (8-10) of our classification harbour a 23% primary hit rate, compared to 12% for those scoring lower (6-7). This suggests that while positive HSC regulators tend to segregate in the top ranks, other downstream genes listed in our database (scores 1-5, n=585 candidates) also include potential determinants of HSC self-renewal, with putative derivation of cross-regulation nodes as mentioned. Our understanding of HSC self-renewal will mirror advancements in the rapidly evolving field of cellular therapy. As pioneered with Hoxb4 (Krosl et al., 2003a), recombinant TAT-fusion proteins could be envisioned and therapeutically tested on human cells. Moreover, findings from this work will potentially pave the way to identify the mediator(s) that link these non-cell autonomous candidates to enhanced HSC activity, thereby bypassing the requirement for retroviral vectors in the goal of expanding HSC for clinical purpose.
117 Experimental Procedures Retroviral Vectors MSCV-Hoxb4-IRES-GFP and MSCV-NUP98-HOXA10HD-IRES-GFP (NA10HD) were previously described (Antonchuk et al., 2001; Ohta et al., 2007). For all candidate genes, single ORF were amplified by PCR (see Table S3.2 and Supplemental Experimental Procedures for details) Animals (C57Bl/6J-CD45.2 x C3H/HeJ) F1 recipient mice and (C57Bl/6J-CD45.1-Pep3b x C3H/HeJ) F1 congenic donor mice were bred at a specific pathogen-free (SPF) animal facility at IRIC in Montreal CRU Assay on HSC-Enriched Populations CRU assay and calculation was performed as described originally (Szilvassy et al., 1990) with modifications as in (Sauvageau et al., 1995). Recipients were considered reconstituted (i.e., positive) when 1% of their peripheral blood leukocytes were of donor (CD ) origin at weeks after transplantation. Two CRU assays were performed using CD150 + CD48 - Lin - cells and one CRU assay for the CD150 + CD48 - Lin - ckit + Sca1 + subpopulation Bone Marrow Cells Culture, Retroviral Infection and Transplan- tation Generation of retrovirus-producing GP+E-86 cells, or gene-overexpressing NIH 3T3, were performed as previously described (Krosl et al., 2003b), and seeded in a 96 well plate format, enabling production of a single ecotropic pseudotyped retrovirus per well (for GP+E-86). See Supplemental Experimental Procedures for details Flow Cytometry Assessment of Donor-Derived Hematopoiesis The contribution of donor cells to peripheral blood reconstitution was determined at regular intervals following transplantation in individual recipients. See Supplemental Experimental Procedures for details.
118 Analysis of Proliferation and Cell Death Transduced cells harvested at day 4 of culture using trypsinization were counted using BD Trucount TM Tubes (BD Biosciences, San Jose, CA, USA) according to manufacturer s guidelines, or stained with Alexa350-annexin V (Invitrogen Molecular Probes, Eugene, Oregon, USA) and propidium iodide (50 µg/ml) in accordance with the manufacturer s instructions. Individual well contents were analysed by flow cytometry. Gates were set to exclude GP+E86 retroviral producers by forward- and side-scatter criteria Resource Database and Web Application The open-source postgresql relational database engine was used to store the accumulated data and the web application was built using the open-source Webware application server framework. The application is designed to house results from other ongoing screens from our lab as well as screens performed elsewhere. As such, a sections-based authentication system has been implemented in order to restrict access to sensitive or nonpublished results. We expect this website to become an open access resource for teams working on deciphering the molecular basis for stem cell self-renewal Statistical Analysis The significance of differences was determined by a two-tailed Student s t test.
119 Acknowledgments The authors thank Dr. Jana Krosl, Richard Bisaillon and Dr. Brian T. Wilhelm for technical help, Christian Charbonneau from IRIC imagery platform, Danièle Gagné from IRIC flow cytometry platform, and Dr. Pierre Chagnon and Raphaëlle Lambert from IRIC genomic platform for their expertise with quantitative RT-PCR. We also want to acknowledge Dr. Claude Perreault, Dr. Marc Therrien, Dr. Kristin J. Hope and Dr. R. Keith Humphries for discussions and critical comments about the manuscript. This work was supported by the Canadian Institute of Health Research (CIHR) Team Grant in Hematopoietic Stem Cell Self-Renewal: From Genes to Bedside (Grant no , ). G.S. holds a Canada Research Chair on molecular genetics of stem cells; E.D. and S.C. are recipients of a CIHR studentship and Clinician Scientist award, respectively; J.C. holds an American Society of Hematology (ASH) fellowship; M.S. holds a National Canadian Institute of Cancer (NCIC) studentship; S.B.T. is the recipient of a National Health Medical Research Council (NHMRC) and a Royal Australian College of Physicians (RACP) fellowships.
120 References Antonchuk, J., Sauvageau, G., and Humphries, R.K. (2001). HOXB4 overexpression mediates very rapid stem cell regeneration and competitive hematopoietic repopulation. Exp Hematol 29, Antonchuk, J., Sauvageau, G., and Humphries, R.K. (2002). HOXB4-induced expansion of adult hematopoietic stem cells ex vivo. Cell 109, Bowie, M.B., McKnight, K.D., Kent, D.G., McCaffrey, L., Hoodless, P.A., and Eaves, C.J. (2006). Hematopoietic stem cells proliferate until after birth and show a reversible phase-specific engraftment defect. J Clin Invest 116, Cellot, S., Krosl, J., Chagraoui, J., Meloche, S., Humphries, R.K., and Sauvageau, G. (2007). Sustained in vitro trigger of self-renewal divisions in Hoxb4hiPbx1(10) hematopoietic stem cells. Exp Hematol 35, Cellot, S., and Sauvageau, G. (2007). Zfx: at the crossroads of survival and self-renewal. Cell 129, Ema, H., and Nakauchi, H. (2000). Expansion of hematopoietic stem cells in the developing liver of a mouse embryo. Blood 95, Hai-Jiang, W., Xin-Na, D., and Hui-Jun, D. (2008). Expansion of hematopoietic stem/ progenitor cells. Am J Hematol 83, Jaenisch, R., and Young, R. (2008). Stem cells, the molecular circuitry of pluripotency and nuclear reprogramming. Cell 132, Kiel, M.J., Yilmaz, O.H., Iwashita, T., Terhorst, C., and Morrison, S.J. (2005). SLAM family receptors distinguish hematopoietic stem and progenitor cells and reveal endothelial niches for stem cells. Cell 121, Krosl, J., Austin, P., Beslu, N., Kroon, E., Humphries, R.K., and Sauvageau, G. (2003a). In vitro expansion of hematopoietic stem cells by recombinant TAT-HOXB4 protein. Nat Med 9,
121 95 Krosl, J., Beslu, N., Mayotte, N., Humphries, R.K., and Sauvageau, G. (2003b). The competitive nature of HOXB4-transduced HSC is limited by PBX1: the generation of ultracompetitive stem cells retaining full differentiation potential. Immunity 18, Lessard, J., Faubert, A., and Sauvageau, G. (2004). Genetic programs regulating HSC specification, maintenance and expansion. Oncogene 23, Min, I.M., Pietramaggiori, G., Kim, F.S., Passegue, E., Stevenson, K.E., and Wagers, A.J. (2008). The transcription factor EGR1 controls both the proliferation and localization of hematopoietic stem cells. Cell Stem Cell 2, Ohta, H., Sekulovic, S., Bakovic, S., Eaves, C.J., Pineault, N., Gasparetto, M., Smith, C., Sauvageau, G., and Humphries, R.K. (2007). Near-maximal expansions of hematopoietic stem cells in culture using NUP98-HOX fusions. Exp Hematol 35, Root, D.E., Hacohen, N., Hahn, W.C., Lander, E.S., and Sabatini, D.M. (2006). Genomescale loss-of-function screening with a lentiviral RNAi library. Nat Methods 3, Rosenbauer, F., Owens, B.M., Yu, L., Tumang, J.R., Steidl, U., Kutok, J.L., Clayton, L.K., Wagner, K., Scheller, M., Iwasaki, H., et al. (2006). Lymphoid cell growth and transformation are suppressed by a key regulatory element of the gene encoding PU.1. Nat Genet 38, Sauvageau, G., Iscove, N.N., and Humphries, R.K. (2004). In vitro and in vivo expansion of hematopoietic stem cells. Oncogene 23, Sauvageau, G., Thorsteinsdottir, U., Eaves, C.J., Lawrence, H.J., Largman, C., Lansdorp, P.M., and Humphries, R.K. (1995). Overexpression of HOXB4 in hematopoietic cells causes the selective expansion of more primitive populations in vitro and in vivo. Genes Dev 9, Shing, D.C., Trubia, M., Marchesi, F., Radaelli, E., Belloni, E., Tapinassi, C., Scanziani, E., Mecucci, C., Crescenzi, B., Lahortiga, I., et al. (2007). Overexpression of sprdm16 coupled with loss of p53 induces myeloid leukemias in mice. J Clin Invest 117, Szilvassy, S.J., Humphries, R.K., Lansdorp, P.M., Eaves, A.C., and Eaves, C.J. (1990). Quantitative assay for totipotent reconstituting hematopoietic stem cells by a competitive repopulation strategy. Proc Natl Acad Sci U S A 87,
122 96 Takahashi, K., and Yamanaka, S. (2006). Induction of pluripotent stem cells from mouse embryonic and adult fibroblast cultures by defined factors. Cell 126, Thorsteinsdottir, U., Mamo, A., Kroon, E., Jerome, L., Bijl, J., Lawrence, H.J., Humphries, K., and Sauvageau, G. (2002). Overexpression of the myeloid leukemia-associated Hoxa9 gene in bone marrow cells induces stem cell expansion. Blood 99, Uchida, N., Dykstra, B., Lyons, K., Leung, F., Kristiansen, M., and Eaves, C. (2004). ABC transporter activities of murine hematopoietic stem cells vary according to their developmental and activation status. Blood 103,
123 Supplemental Figures and Tables A Relative Ct values (gene/tbp) C Fold overexpression relative to endogenous ,000 FL 14.5 dpc 1, Smarcc1 Vps72 BM 3 weeks Fos Trim27 Sox4 Klf10 BM 4 weeks Ski Prdm16 Erdr1 Sfpi1 Ski Smarcc1 Vps72 Fos Trim27 Sox4 Klf10 Prdm16 Erdr1 Sfpi1 B n/a 0.1 vector Ratio of expression (HSC/total tissue): enrichment in HSC compared to unpurified subsets 1, ,000 Figure S3.1 Expression levels of confirmed hits in purified HSC. Smarcc1 Vps72 Subset no. 1: FL 14.5 dpc Subset no. 2: BM 3 weeks Subset no. 3: BM 4 weeks (A) Endogenous expression levels of newly identified Hoxb4-like genes in highly purified HSC at 3 different time points during development, i.e., in CD150 + CD48 - Lin - ckit + Sca1 + Mac + fetal liver (FL) at 14.5 days post-coitum (dpc), and in CD150 + CD48 - Lin - ckit + Sca1 + bone marrow (BM) cells at 3 and 4 weeks after birth. Results are presented as the Ct values of tested genes divided by the corresponding Ct values of TATA Binding Protein (TBP), serving as an endogenous control to normalize levels of target gene expression. Reactions were done in triplicate. (B) Quantitative analysis on HSC vs total tissues with the same genes at the same time points as in (A). Average Ct values were determined in highly purified HSC [see (A)] and in total tissue, with TBP serving as an endogenous control to normalize levels of target gene expression. Relative fold differences were calculated using the total tissue as a reference calibrator for each candidate gene. Reactions were done in triplicate for each independent experiment (n): n=2 or each gene, except for Smarcc1, Fos, Sox4 and Ski: n=1. (C) Quantitative analysis of the newly identified Hoxb4-like gene-overexpression levels in HSC-enriched subpopulation. RNA was extracted from CD150 + CD48 - Lin - Kit + Sca + bone marrow cells that were beforehand co-cultured with retroviral producers for 5 days and sorted for the GFP positive fraction (or from GFP + retroviral producers for Sfpi1). Average Ct values were determined with β-actin serving as an endogenous control to normalize levels of target gene expression. Relative fold differences were determined using control vector cells as a reference calibrator for each candidate gene. Reactions were done in triplicate for each independent experiment (n): n=4 for all, except for Sfpi1: n=3; Hoxb4 and Klf10: n=2; Ski: n=1; n/a=not available Fos Trim27 Sox4 Klf10 Ski Prdm16 Erdr1 Sfpi1
124 98 A C CD150 Donor-derived reconstitution (%CD ) CRU=1/24 Lin - CD % c-kit Estimated CRU numbers Figure S3.2 Purity and activity of sorted HSC subpopulation. Sca CRU=1/5 CRU assay on freshly sorted CD150 + CD48 - Lin - cells 21% 8 CRU/mouse (=62 CRU/well) B % Negative mice % Number of transplanted cells (A) Left panel shows representative flow cytometry sort profile of the starting HSC-enriched population used in the primary screen. Events are gated on the Lin-APC - cell fraction of freshly sorted bone marrow cells, with CD150-PE and CD48-FITC positivity along the y-and x-axis, respectively. Percentage of Sca-PECy5 + c-kit-pecy7 + cells within the CD150 + CD48 - Lin - contingent is depicted in the right panel. (B) In vivo competitive repopulation assay performed using CD CD150 + CD48 - Lin - cells described in (A). Results are presented as cell numbers (x-axis) against the corresponding percentage of negative mice (y-axis) per dose. Hematopoietic reconstitution at 20 weeks post-transplantation was deemed negative if less than 1% of the recipient blood cells were derived from the sorted graft. The mean of two representative assays is shown. The obtained average CRU frequency was 1 in 24 cells (95% CI: 1/10 to 1/57). In that respect, ~62 CRU per well (or 8 CRU* per mouse) were seeded at day -5 (see Figure 3.1B). (C) Results from in vivo limit dilution assays in (B) are displayed as peripheral blood reconstitution values in relation to calculated CRU numbers. The extrapolated percentage of blood reconstitution derived from 8 freshly sorted CRU, as indicated, is ~12.5%. This value mirrors the mean reconstitution level observed in control mice transplanted with an equivalent CRU fraction (i.e., 8 CRU/mouse; see Figure 3.2A) in the same competitive context, after 5 days of retroviral infection (day 0 of the screen), and suggests HSC activity maintenance after this short co-culture period; CRU=competitive repopulation unit. *Based on the CRU evaluation of the starting CD150 + CD48 - Lin - population, it was possible to estimate at ~8 the maximal number of CRU transplanted per mouse at day 0: 1,500 cells x 1/24 CRU (at day -5) x 1/8 well per mouse = 8 CRU per mouse.
125 99 A B Hematopoietic reconstitution (distribution in CD /GFP + fraction) Smarcc1 Vps B220 + CD3 + CD11b + vector 2241 NA10HD 2533 n/a n/a n/a n/a n/a n/a n/a n/a n/a Smarcc1 Trim27 Sox4 Klf10 Ski Prdm16 Erdr1 Cnbp Xbp Vps Trim Sox Klf n/a n/a n/a 2557 Ski n/a n/a n/a n/a n/a n/a n/a n/a n/a n/a n/a n/a 3347 Prdm Erdr n/a n/a n/a Cnbp PB BM Th Xbp Hnrpdl 2075 Hnrpdl BM Th Figure S3.3 In vivo differentiation of HSC transduced with newly identified genes. (A) Differentiation potential along the lympho-myeloid lineages in long-term recipients (20 weeks post-transplantation) of HSC transduced with selected candidates. Immunophenotypic analysis by flow cytometry was performed using specific antibodies against B, T and myeloid cell surface markers and gated on CD /GFP + populations derived from the peripheral blood, bone marrow and thymus of these mice. Technical difficulties inherent to GFP expression in certain contexts preclude this type of analysis for the following genes: Smarcc1 and Prdm16 in all tissues analysed; Ski, Klf10, and Erdr1 in the thymus. Values represent mean±sd and the number of mice analyzed (n) per candidate gene was n=2, except for vector: n=5; NA10HD and Cnbp: n=3; Trim27 and Klf10: n=1. (B) Southern blot analysis showing the proviral DNA in the BM (upper panel) and in the thymus (lower panel) of selected recipients that were highly reconstituted at 20 weeks post-transplantation. Transduced HSC remain competent in T cell differentiation although they displayed enhanced reconstitution activity for each gene, except for Ski, Prdm16 and Erdr1, where we cannot be certain that the same clone contributed to thymic and bone marrow reconstitution. Membranes were exposed for 3 days and DNA loading normalized based on CD45.1 level in peripheral blood. Trim27 blots are also presented in Figure 3.5C; n/a=not available.
126 100 Donor-derived reconstitution (%CD ) day 0 day weeks post-transplantation Figure S3.4 Importance of the ex vivo culture in the specificity of the screen. positive genes negative genes control vector The background noise characteristic of day 0 (left panel) was abolished by the 7 day ex vivo culture (right panel) when comparing test values (black: negatives, and red: positives lines) with vector (yellow lines). This variability at day 0 is due to the short in vitro exposure period (5 days), the survival benefits granted by viral producer cells, and discrepancies in proliferative potential (output) of individual HSC, despite equivalent cell doses per well at initiation of culture. In sharp contrast, a week in vitro culture period led to HSC exhaustion in the absence of a positive maintenance/self-renewal factor. Relying only on reconstitution data from day 0 cultures, the rate of false positive would dramatically increase to an estimated 19%, negating this screening method from larger-scale applications.
 C: BC003219 (complete cds) C Donor-derived reconstitution (%CD45.")
127 101 A BC (containing frame-shift error) RING-type B box-type Coiled coil Zinc finger Zinc finger (potential) BC (complete cds) 314 a.a. Coiled (poten RING-type B box-type Coiled coil Coiled coil Zinc finger Zinc finger (potential) (potential) B30.2/SPRY Domain 513 a.a. B kda * F: BC (containing frame-shift error) C: BC (complete cds) C Donor-derived reconstitution (%CD ) F C BC (containing frame-shift error) p=5.1x BC (complete cds) weeks post-transplantation Figure S3.5 Different forms of Trim27 with different potential. p=6.5x (A) Two different forms of Trim27 have been tested in this study, i.e., one containing a frameshift error (truncated and used in primary screen; accession number BC085503; upper panel) preserving intact only the RING, B-box and first Coiled-coil domains, and another full-length form (accession number BC003219; bottom panel) containing in addition the second Coiledcoil and the SPRY domains. (B) Western blot analysis presenting the detection of the 2 FLAG- Trim27 proteins of expected sizes; *=degradation product or unknown isoform. (C) Competitive repopulation assays reporting the differential reconstitution level of recipient mice by HSC transduced with the different forms of Trim27. Note that the SPRY domain within the full-length form of Trim27 seems to limit the potential of this gene in enhancement of HSC activity. The left panel is a replicate from that presented in Figure 3.2C.
128 gene symbol score gene symbol score gene symbol score gene symbol score gene symbol score gene symbol score gene symbol score Acin1* 10 Sp1 7 Supt16h 5 Tgfb1 2 Fezf2 1 Msh5 1 Sqstm1 1 Baz1b 10 Swap70* 7 Supt5h 5 Tnp1 2 Fhl1 1 Msx3 1 Srf 1 Crem* 10 Tada2l* 7 Surf1 5 Tnp2 2 Fiz1 1 Mtf1 1 Sry 1 Dnmt3b 10 Tcea1* 7 Syf2 5 Trim30 2 Fli1 1 Mtf2 1 Ssb 1 Erdr1* 10 Tcf3* 7 Tacc3 5 Trp53 2 Foxb1 1 Mycl1 1 Ssbp2 1 Egr1* 10 Tcf7l2* 7 Taf3 5 Ubp1 2 Foxb2 1 Mynn 1 Ssbp3 1 Gata2* 10 Tfam* 7 Tarbp2 5 Zbtb16 2 Foxc2 1 Myst2 1 Stat6 1 H3f3b* 10 Tle4 7 Tceb3 5 Zfand5 2 Foxd2 1 Nab1 1 Sub1 1 Klf9* 10 Trp53bp1* 7 Tcf12 5 Zfp148 2 Foxj2 1 Nap1l3 1 Supt3h 1 Mef2c* 10 Vps72* 7 Tnip2 5 Zfp289 2 Foxj3 1 Nap1l4 1 Suv39h1 1 Meis1* 10 Zfp238* 7 Trerf1 5 Zfp42 2 Foxp1 1 Narg1 1 Syt4 1 Ncl* 10 Zfp385* 7 Trim25 5 Zfp513 2 Foxp3 1 Nasp 1 Tada3l 1 Nfat5 10 Bmi1 6 Trim47 5 Zfp787 2 Fubp1 1 Nfatc1 1 Taf10 1 Rela* 10 Cbx3* 6 Uhrf2 5 Zic1 2 Gabpa 1 Nfatc2 1 Taf11 1 Rest 10 Cebpb 6 Uty O10Rik 1 Garnl1 1 Nfix 1 Taf12 1 Runx2 10 Cnbp* 6 Ybx M15Rik 1 Gcn5l2 1 Nfxl1 1 Taf15 1 Sf1* 10 Csda 6 Zbtb O15Rik 1 Gem 1 Nfyb 1 Taf1b 1 Sfpi1* 10 Dnmt1* 6 Zc3h N22Rik 1 Gfi1b 1 Nfyc 1 Taf2 1 Smarcc1* 10 H3f3a* 6 Zfand K11Rik 1 Glis1 1 Nkx2-6 1 Taf7 1 Tcf4* 10 Hdac1* 6 Zfp K07Rik 1 Gnl3 1 Nkx6-2 1 Tax1bp1 1 Tgif1* 10 Hipk2* 6 Zfp P20Rik 1 Gsx1 1 Nr0b1 1 Tbx21 1 Trim28 10 Hmgn1* 6 Zfp M24Rik 1 Gtf2e2 1 Nr1h2 1 Tcea2 1 Xbp1* 10 Maged1* 6 Zfp N21Rik 1 Gtf2h1 1 Nr2f2 1 Tcea3 1 Bptf* 9 Mkl1* 6 Zfp J15Rik 1 Gtf2h2 1 Nr4a1 1 Tceb1 1 Fos* 9 Ncoa3 6 Batf 4 A630033E08Rik 1 Gtf2h4 1 Nsbp1 1 Tcf7 1 Foxo1 9 Phf3* 6 Cited2 4 Abt1 1 Gtf3c2 1 Nucb1 1 Tcfe2a 1 Hey1* 9 Ppfibp2 6 Crebbp 4 Acaa1b 1 Gtf3c4 1 Nucb2 1 Tcfeb 1 Hmga1* 9 Prdm16* 6 Ctnnb1 4 Adnp 1 Gtl3 1 Nufip1 1 Tead1 1 Hmgn2* 9 Rbbp7* 6 Gtf2a1l 4 Aff4 1 H2afv 1 Pax1 1 Tead2 1 Hoxa2 9 Set 6 Hif1a 4 Akna 1 H2afx 1 Pbrm1 1 Terf1 1 Ilf3* 9 Ski * 6 Hoxb4 4 Amotl2 1 Hcfc1 1 Pbxip1 1 Terf2 1 Irf8* 9 Ssrp1* 6 Myod1 4 Angel1 1 Hdac2 1 Pdlim1 1 Tfdp1 1 Mxi1* 9 Sumo1* 6 Nr5a1 4 Angel2 1 Hdac3 1 Per2 1 Thoc4 1 Myb* 9 Supt6h 6 Parp1 4 Ap3s1 1 Hes2 1 Phf10 1 Thra 1 Mycn* 9 Tsc22d1* 6 Prm1 4 Arhgap30 1 Hesx1 1 Phf17 1 Tnfrsf4 1 Ncor1 9 Tsn* 6 Rbpj 4 Arid1a 1 Hhex 1 Phf20 1 Trim21 1 Nfe2l1* 9 Zfp472* 6 Stat3 4 Arid3a 1 Hic2 1 Phf20l1 1 Trim24 1 Nfkb1 9 Zfp64* 6 Zscan21 4 Arl3 1 Hif3a 1 Phf23 1 Trim46 1 Nr4a2* 9 Zfp706 6 Ash1l 3 Atf3 1 Hira 1 Phkb 1 Trim8 1 Pbx2* 9 Zmynd11* 6 Bclaf1 3 Atf7ip 1 Hist1h2ai 1 Phox2b 1 Trip11 1 Phc1* 9 Bcl11a 5 Gtf3a 3 Atoh8 1 Hist1h3a 1 Phtf1 1 Trrap 1 Prox1* 9 Bcl6 5 Klf2 3 Atrx 1 Hist2h2aa1 1 Pias4 1 Tsc22d2 1 Rlf 9 C Mlf2 3 Banp 1 Hlf 1 Pitx2 1 Tsc22d4 1 Sirt1 9 Cbx5 5 Npm1 3 Bhlhb2 1 Hmg20a 1 Pmf1 1 Tshz1 1 Smarca4* 9 Cdk8 5 Psip1 3 Bhlhb8 1 Hmgb2 1 Polr2k 1 Ttf1 1 Sox4* 9 Cdr2 5 Rbm5 3 Bicd2 1 Hmgb3 1 Polrmt 1 Tut1 1 Tcerg1* 9 Chaf1a 5 Sin3a 3 Blm 1 Hnf1a 1 Pot1a 1 U2af1 1 Tes* 9 Chpt1 5 Tcfe3 3 Brd4 1 Hnf4a 1 Pou2f2 1 Ubtf 1 Tle6* 9 Cited4 5 Yy1 3 Brd7 1 Hnrpul1 1 Pou2f3 1 Unc84a 1 Tsc22d3* 9 Clp A23Rik 2 Btf3 1 hop 1 Ppp1r9a 1 Utf1 1 Zfp35 9 Cnot2 5 Abl1 2 C130039O16Rik 1 Hoxa10 1 Pqbp1 1 Vezf1 1 Ctcf* 8 Cnot8 5 Ahctf1 2 C1d 1 Hoxa3 1 Prdm1 1 Xpc 1 Hes1* 8 Cops5 5 Ap4m1 2 C Hoxa4 1 Prkcbp1 1 Yap1 1 Hmgb1* 8 Crebzf 5 Aurkb 2 Calcoco1 1 Hoxa5 1 Prrx1 1 Zbtb22 1 Hnrpab* 8 Cul1 5 Ccar1 2 Calr 1 Hoxa6 1 Ptf1a 1 Zc3h3 1 Klf10* 8 D3Ertd300e 5 Cebpz 2 Cand2 1 Hoxb6 1 Pttg1 1 Zeb1 1 Nap1l1* 8 E2f6 5 Creb3 2 Carm1 1 Hoxb8 1 Purb 1 Zfp1 1 Pml* 8 Egr3 5 Creg1 2 Cbfa2t3h 1 Hoxc8 1 Rab11fip3 1 Zfp110 1 Tcfec* 8 Elk4 5 Csde1 2 Cbx1 1 Hoxd10 1 Rai1 1 Zfp125 1 Trim27* 8 Epc1 5 Dlx2 2 Cbx4 1 Htatip 1 Ran 1 Zfp202 1 Actl6a* 7 Exosc8 5 Dpf2 2 Ccnt2 1 Ifi35 1 Rarg 1 Zfp26 1 Brf1* 7 Ezh1 5 E2f1 2 Cdc5l 1 Igf2bp2 1 Rbm16 1 Zfp260 1 Cbfb* 7 Flywch1 5 Elk3 2 Cebpa 1 Ing3 1 Rcc1 1 Zfp275 1 Cebpg* 7 Gif 5 Emx2 2 Cenpa 1 Irf1 1 Rcor1 1 Zfp282 1 Crebl1* 7 Gtf2b 5 Etv5 2 Cenpf 1 Irf3 1 Relb 1 Zfp287 1 Cutl1 7 Hbp1 5 Etv6 2 Chd1 1 Irx2 1 Rhoq 1 Zfp292 1 Dnmt3a* 7 Hirip3 5 Foxd3 2 Chd4 1 Jarid1c 1 Rnf12 1 Zfp313 1 Edf1* 7 Hmgb2l1 5 Gsk3b 2 Chfr 1 Jun 1 Rnf138 1 Zfp326 1 EG Hp1bp3 5 Gtf2i 2 Cic 1 Junb 1 Rnf2 1 Zfp33b 1 Elf1* 7 Ikzf1 5 Gtf2ird1 2 Cnot6l 1 Kcmf1 1 Rnf38 1 Zfp354a 1 Etv1 7 Ing5 5 Gtf3c5 2 Cnot7 1 Kcnip3 1 Rnf4 1 Zfp358 1 Evi1 7 Irf7 5 H1f0 2 Coil 1 Klf12 1 Rora 1 Zfp36 1 Fosb 7 Jund 5 Hist1h1c 2 Creb3l3 1 Klf6 1 Rorc 1 Zfp383 1 Gabpb1* 7 Kbtbd4 5 Id1 2 Csdc2 1 L3mbtl2 1 Rpa3 1 Zfp386 1 Gata3* 7 Lasp1 5 Id2 2 Ctbp2 1 Lhx9 1 Rrp1 1 Zfp40 1 H2afy* 7 Lmna 5 Id3 2 Cul5 1 Limd1 1 Rsl1 1 Zfp422 1 H2afz* 7 Lyar 5 Jarid2 2 D16Ertd472e 1 Lims1 1 Ruvbl1 1 Zfp445 1 Hmga2* 7 Mafk 5 Mbd1 2 Dbp 1 Lmnb1 1 Rxrb 1 Zfp46 1 Hnrpdl* 7 Med24 5 Mbnl1 2 Dcp1a 1 Lmo2 1 Sap18 1 Zfp503 1 Hnrpk* 7 Morf4l2 5 Mbtd1 2 Ddit3 1 Luzp1 1 Satb1 1 Zfp52 1 Hoxa9 7 Ndufs3 5 Msi1 2 Ddx21 1 Lyl1 1 Scand1 1 Zfp54 1 Kif4* 7 Nkx2-3 5 Mxd4 2 Ddx5 1 Lztfl1 1 Scap 1 Zfp595 1 Klf4* 7 Nsd1 5 Nanog 2 E2f5 1 Lztr1 1 Scml2 1 Zfp629 1 Lass4* 7 Nxn 5 Nfe2 2 E430018J23Rik 1 Maf 1 Sfrs15 1 Zfp646 1 Mbnl3* 7 Pcaf 5 Nfx1 2 E4f1 1 Maff 1 Sgk 1 Zfp68 1 Mga 7 Pou2f1 5 Pax6 2 Ebf1 1 Mafg 1 Sin3b 1 Zfp69 1 Mta2* 7 Prmt5 5 Pou5f1 2 Ecd 1 Matr3 1 Sirt3 1 Zfp7 1 Ncoa6 7 Rabep2 5 Preb 2 Eif4a1 1 Mbd2 1 Six5 1 Zfp704 1 Nfe2l2* 7 Rbl1 5 Ring1 2 Elavl4 1 Mbtps1 1 Smad5 1 Zfp72 1 Nkx2-9 7 Rnf10 5 Smad4 2 Elk1 1 Mdfi 1 Smarca2 1 Zfp809 1 Nr1i3* 7 Rybp 5 Smarce1 2 Eltd1 1 Med1 1 Smarcd2 1 Zfp92 1 Patz1 7 Sap30bp 5 Sox1 2 En2 1 Med14 1 Smc5 1 Zfx 1 Polr3k* 7 Sart1 5 Sox2 2 Ep400 1 Med6 1 Snapc4 1 Zkscan3 1 Prdm5* 7 Skp1a 5 Sox3 2 Erh 1 Mef2a 1 Snrpf 1 Zranb2 1 Rnps1* 7 Smarcad1 5 Sp100 2 Esr1 1 Meox1 1 Snw1 1 Zzz3 1 Runx1* 7 Sox9 5 Sp2 2 Ets2 1 Mid2 1 Sox17 1 Runx3 7 Srebf1 5 Tbp 2 Etv2 1 Mll3 1 Sox6 1 Sirt2* 7 Stat2 5 Tbpl1 2 Eya2 1 Mnt 1 Sp3 1 Smarca5 7 Stxbp1 5 Tcfcp2 2 Fau 1 Mphosph8 1 Spib 1 102
129 103 Table S3.1 Scoring system used in candidate selection. Candidates were selected using microarray gene expression profiling from a leukemia stem cell line (FLA2, G.S. et coll., in preparation) and expression profiles from enriched stem cell populations (Bhattacharya et al., 2004; Georgantas et al., 2004; Ivanova et al., 2002; Phillips et al., 2000; Ramalho-Santos et al., 2002; Shim et al., 2004; Shojaei et al., 2004; Terskikh et al., 2001). Nuclear factors were selected and rated relative to their expression in different reports/ databases (i.e., high rank=high expression) according to the criteria listed in the text (full details available upon request). Using this ranking system, genes with a score of 6 or above were selected for functional studies (n=139), of which 104 have been tested in the screen (genes followed by an *).
130 104 gene symbol accession no. forward primer sequence reverse primer sequence MW (kda)* determined MW (kda) special note Acin1 BC GAGAGAGCGGCCGCATGTTCTCAGACAGCAGAG GAGAGAGAATTCAGTGTTTTCTTGGCTAGCG Actl6a AK GAGAGAGCGGCCGCGTGTACG GAGAGACAATTGACAGACGTTGAGGTGACG Bptf BC GAGAGAGCGGCCGCATGGCAGCCAAGGCTC GAGAGACAATTGCTAAGGAGCTGTAGATTGC Brf1 BC GAGAGAGCGGCCGCACCATGACGGGCCGC GAGAGACAATTGCTCAGTAGCCATCATCTTC Cbfb AK GAGAGAGCGGCCGCATGTCGCGCGTCGTCCC GAGAGACAATTGTTAACGAAGTTTGAGATCATC Cbx3 AK GAGAGAGCGGCCGCATGGCCTCCAATAAAACTAC GAGAGACAATTGATTATTGTGCTTCATCTTCAG Cebpg AK GAGAGAGCGGCCGCATGAGCAAGCTGTCGCAG GAGAGACAATTGCCTGGAAGGAGATCTAC 17.4 not detected Cnbp BC GAGAGAGCGGCCGCCAGCAACGAATGCTTCAAG GAGAGAGAATTCAATAATTAGGCTGTAGCCTC Crebl1 BC GAGAGAGCGGCCGCAAGATGGCGGAGCTGATG GAGAGAGAATTCTGAGGTGAGGATGTCAGG 77.1 not detected Crem BC GAGAGAGCGGCCGCAAATGACCATGGAAACAG GAGAGAGAATTCCTGTGTCTATGGAATCATAGC Ctcf BC GAGAGAGCGGCCGCATGGAAGGTGAGGCGGTTG GAGAGAGAATTCTCACCGGTCCATCATGCTG Dnmt1 BC GAGAGAGCGGCCGCATGCCAGCGCGAACAGC GAGAGACAATTGCTAGTCCTTGGTAGCAGC Dnmt3a AK GAGAGAGCGGCCGCATGCCCTCCAGCGGCC GAGAGACAATTGATGTCCCTTACACACAAGC Edf1 AK GAGAGAGCGGCCGCTGGCCGAGAGTGACTGG GAGAGACAATTGGTTCATTTCGCCTTCGGC Egr1 AK GAGAGAGCGGCCGCGATGGCAGCGGCCAAGG GAGAGAGAATTCTTCCTGCCTCTCCCTTTGC Elf1 BC GAGAGAGCGGCCGCGCTGCTGTTGTCCAACAG GAGAGAGCGGCCGCAAATACCCACCCATAATTCC Erdr1 BC GAGAGAGCGGCCGCATGCCCACGGGACGC GAGAGACAATTGTCAACTGCAATTTTATTGAGG 20.5 n/a not FLAG-tagged Fos BC GAGAGAGCGGCCGCCCATGATGTTCTCGGGTTTC GAGAGACAATTGTGCTCACAGGGCCAGCAG Gabpb1 AK GAGAGAGCGGCCGCATGTCCCTGGTAGATTTGG GAGAGACAATTGTGGCAGCTAAACGGCTTC Gata2 AK GAGAGAGCGGCCGCCATGGAGGTGGCGCCTG GAGAGACAATTGCTAGCCCATGGCAGTCACC Gata3 BC GAGAGAGCGGCCGCATGGAGGTGACTGCGG GAGAGACAATTGCTGCCTCTCTAACCCATG H2afy BC GAGAGAGCGGCCGCATGTCGAGCCGCGGC GAGAGACAATTGCCTAGTTGGCGTCCAG H2afz AK GAGAGAGCGGCCGCATGGCTGGCGGTAAGGC GAGAGACAATTGATAAGGAATCCAGGCATCC 14.6 not detected H3f3a AK GAGAGAGCGGCCGCGGCTCGTACAAAGCAGAC GAGAGACAATTGACTCTTAAGCACGTTCTC H3f3b AK GAGAGAGCGGCCGCAATGGCCCGAACCAAGCAG GAGAGACAATTGCCGCTTCAACTTAAGCTCTC Hdac1 BC GAGAGAGCGGCCGCATGGCGCAGACTCAGGG GAGAGACAATTGTCAGGCCAACTTGACCTC Hes1 BC GAGAGAGCGGCCGCATGCCAGCTGATATAATGGAG GAGAGACAATTGCTCAGTTCCGCCACGGTC Hey1 BC GAGAGAGCGGCCGCCCATGAAGAGAGCTCACCC GAGAGACAATTGTTTAGAAAGCTCCGATCTCTG Hipk2 BC GAGAGAGCGGCCGCATGGCCCCCGTGTACG GAGAGAGAATTCGTTTATATGTAAGGGTATTGG Hmga1 BC GAGAGAGCGGCCGCAATGAGCGAGTCGGGCTC GAGAGACAATTGTCACTGCTCCTCCTCAGAG Hmga2 BC GAGAGAGCGGCCGCAGCGCACGCGGTGAGG GAGAGACAATTGGCGAGGATGTCTCTTCAG Hmgb1 BC GAGAGAGCGGCCGCAACATGGGCAAAGGAGATCC GAGAGACAATTGACTTATTCATCATCATCATCTTC Hmgn1 BC GAGAGAGCGGCCGCCCCAAGAGGAAGGTTAGC GAGAGACAATTGATGCTTAGTCGGACTTAG Hmgn2 BC GAGAGAGCGGCCGCCCACCATGCCCAAAAGAAAG GAGAGACAATTGATCACTTGGCATCTCCAGC Hnrpab AK GAGAGAGCGGCCGCGCCGACCATGTCGGAC GAGAGACAATTGGCCTCTCAGTATGGCTTG Hnrpdl BC GAGAGAGCGGCCGCATGGAGGACATGAATGAG GAGAGACAATTGGCGTCCTCCTTTAGTAGG Hnrpk AK GAGAGAGCGGCCGCAAAATGGAGACCGAACAGC GAGAGAGAATTCGACTCCTTCAGTTCTTCAC Ilf3 AK GAGAGAGCGGCCGCTGTGAATGATGATCGCCACG GAGAGACAATTGTTATCTGTACTGGTAGTTCATG Irf8 BC GAGAGAGCGGCCGCATGTGTGACCGGAACGGC GAGAGACAATTGCTTAGACGGTGATCTGTTG Kif4 BC GAGAGAGCGGCCGCAGAGGTGAAGGGGATTCC GAGAGACAATTGAAACTCAGTGGGACTCTTC Klf10 BC GAGAGAGCGGCCGCATGCTCAACTTCGGCGC GAGAGACAATTGTCACTGTGCGGAAGCAG Klf4 BC GAGAGAGCGGCCGCATGAGGCAGCCACCTGG GAGAGACAATTGGGTCACATCCACTACG Klf9 AK GAGAGACAATTGCCATGGCCGCGGCCGCC GAGAGACAATTGACCTCACAAGGGGCTGGC Lass4 AK GAGAGAGCGGCCGCTCCAGCATGTCGTTCAG GAGAGACAATTGGTCCAAGGTTGTCTATGTG 47.1 ~120 Maged1 AK GAGAGAGCGGCCGCATGGCTCAGAAACCGGAC GAGAGAGAATTCTTTACTCAACCCAGAAGAAG Mbnl3 AK GAGAGAGCGGCCGCACACCTGTCAATGTAGCTC GAGAGACAATTGTACTCTGTAACTCTGCTGC Mef2c BC GAGAGAGCGGCCGCCACGGGGACTATGGGGAG GAGAGACAATTGTCATGTTGCCCATCCTTCAG Meis1 BC GAGAGAGCGGCCGCATGGCGCAAAGGTACGACG GAGAGAGAATTCTTCATTTACCAGGCAGCAGC Mkl1 AK GAGAGAGCGGCCGCTGCCGCCTTTGAAAAGCC GAGAGACAATTGCTACAAGCAGGAATCCC Mta2 AK GAGAGAGCGGCCGCTGGCGGCTAACATGTACC GAGAGACAATTGTGCTCAATCCTCCAGGAC 76.1 not detected Mxi1 BC GAGAGACAATTGATGCCCCCGGCCGCGG GAGAGACAATTGCTAGGACGCGAAGGAGAG Myb BC GAGAGAGCGGCCGCCCATGGCCCGGAGACCC GAGAGACAATTGTCACATGACCAGAGTTCGAG Mycn BC GAGAGAGCGGCCGCACCCATGCCCAGCTGCAC GAGAGACAATTGCGTTTAGCAAGTCCGAGCG Nap1l1 AK GAGAGAGCGGCCGCGCCGACATTGACAACAAAG GAGAGACAATTGTCACTGCTGCTTGCACTC 46.4 ~60 Ncl AK GAGAGAGCGGCCGCCACCATGGTGAAGC GAGAGACAATTGAAGGAACTATTCAAACTTCGTC 77.8 ~95 Nfe2l1 BC GAGAGAGCGGCCGCCCTTCAGCAATGCTTTCTC GAGAGACAATTGCTCACTTCCTCCGGTC 82.6 not detected Nfe2l2 BC GAGAGAGCGGCCGCCATGATGGACTTGGAGTTG GAGAGACAATTGCTCCATCCTCCCGAAC 68.0 not detected Nr1i3 BC GAGAGAGCGGCCGCATGTTTGACCAG GAGAGACAATTGTTAAAGGGACCGAGAGTTG Nr4a2 AK GAGAGAGCGGCCGCCATGGCTTGTGTTCAGGC GAGAGACAATTGTTAGAAAGGTAAGGTGTCCAG Pbx2 BC GAGAGAGCGGCCGCATGGACGAGCGGCTGCTG GAGAGACAATTGGGTCAGTTGGAGGTGTCAG Phc1 BC GAGAGAGCGGCCGCATGGAAACGGAGAGTGAG GAGAGACAATTGACTTAGGTCTCCTTGAGGAC Phf3 AK GAGAGAGCGGCCGCATGGTCGGCTGTGGGAC GAGAGACAATTGAGTTCTGCTTTAAGAGCATG Pml BC GAGAGAGCGGCCGCCCATGCCTCCCCCAGAG GAGAGACAATTGGCTAGGCCAGGCATCCC Polr3k AK GAGAGAGCGGCCGCATGCTGTTGTTCTGCCCG GAGAGACAATTGCCCTTAATCCCTCCAG Prdm16 BC GAGAGAGCGGCCGCCATGCGATCCAAGGCG GAGAGACAATTGATCATTGCATATGCCTCCG Prdm5 AK GAGAGAGCGGCCGCTGCTGGGCATGTACGTAC GAGAGACAATTGCTCCTCTTAGCTGTCAG 70.5 not detected Prox1 BC GAGAGAGCGGCCGCGATGCCTGACCATGACAGC GAGAGACAATTGCTCTACTCGTGAAGGAGTTC 84.1 not detected Rbbp7 AK GAGAGAGCGGCCGCAAGATGGCGAGTAAAG GAGAGACAATTGTGGGTTTAAGATCCTTGCC Rela BC GAGAGAGCGGCCGCATGGACGATCTGTTTCCC GAGAGACAATTGCTTAGGAGCTGATCTGACTC Rnps1 BC GAGAGAGCGGCCGCGAATGGATTTATCAGGAGTG GAGAGACAATTGCCCTGCTTATCGGGAGG Runx1 BC GAGAGAGCGGCCGCACGATGGCTTCAGACAGC GAGAGACAATTGGCTAAATCAGAAGCATTCAC Sf1 BC GAGAGAGCGGCCGCATGGCGACCGGAGCG GAGAGACAATTGCTAGTTCTGTGGTGGAGG Sfpi1 BC GAGAGAGCGGCCGCCTGGATGTTACAGGCGTGC GAGAGACAATTGTCAGTGGGGCGGGAGGC Sirt2 BC GAGAGAGCGGCCGCATGGCCGAGCCGGAC GAGAGACAATTGACTGTTACTGCTGTTCCTC Ski BC GAGAGAGCGGCCGCATGGAAGCTGCAGCGG GAGAGACAATTGTCACTGCCCAGGCTAGG Smarca4 BC GAGAGAGCGGCCGCATGTCTACTCCAGACCCAC GAGAGACAATTGTCAGTCGCTGTAGTCTAC ~150 old version (partial cds) Smarcc1 BC GAGAGAGCGGCCGCTATGGCCGCGACAGCGG GAGAGAGAATTCCTACTTACACATGCCGTTTG Sox4 AK GAGAGACAATTGGCCATGGTACAACAGACC GAGAGACAATTGCCTCTCTCCTCTCCTGCC Ssrp1 BC GAGAGAGCGGCCGCAACATGGCAGAGACATTGG GAGAGACAATTGTTCATCAGATCCCGAGGC Sumo1 AK GAGAGAGCGGCCGCATGTCTGACCAGGAGGC GAGAGACAATTGCTAAACCGTCGAGTGACC Swap70 BC GAGAGAGCGGCCGCGGCCATG GAGAGACAATTGCCGTCACTCTGTGGTC Tada2l BC GAGAGAGCGGCCGCATGGACCGTTTGGGTTCC GAGAGACAATTGTCAGGCTTTCGTGATGTAC Tcea1 BC GAGAGAGCGGCCGCATGGAGGACGAGGTGG GAGAGAGAATTCACTCAACAGAACTTCCACC Tcerg1 BC GAGAGAGCGGCCGCATGGCTCAACAGCAGGCC GAGAGAGAATTCTTATTTTGTTGATCGTCTAGTG Tcf3 AK GAGAGACAATTGCAGCTCGGTGGTGGCC GAGAGACAATTGCTTAGTGGGCAGACTTG Tcf4 AK GAGAGAGCGGCCGCAATGGATCACCAACAGCGAATG GAGAGACAATTGTTTTCACATCTGTCCCATGTG Tcf7l2 BC GAGAGAGCGGCCGCATGCCGCAGCTGAACGG GAGAGACAATTGGAGGCGAGTCTAGTAAG Tcfec BC GAGAGAGCGGCCGCATGACCTTTGACTGTCGG GAGAGACAATTGTTACAACTCATCACCATCCTC Tes BC GAGAGAGCGGCCGCGCCCAGTATGGACCTG GAGAGACAATTGCTCTTAGGACATCATCCTC Tfam AK GAGAGAGCGGCCGCTGGCGCTGTTCCGGGG GAGAGACAATTGTTAATGCTCAGAGATGTCTCC 29.0 not detected Tgif BC GAGAGAGCGGCCGCGAATGAAAAGCAAGAAGGGTC GAGAGACAATTGGTTAAGCTGTGAGTTTGGC Tle6 BC GAGAGAGCGGCCGCAAGATGAGTATTGGTGTTG GAGAGACAATTGTTGAAGTTGTCAGTACTTG Trim27 BC GAGAGAGCGGCCGCATGGCCTCCGGGAGCG GAGAGACAATTGTCAACTGAGTATAACTGAGCC 59.6 ~40 old version (containing frame-shift errors) Trp53bp1 BC GAGAGAGCGGCCGCGTGGAGATCAATGATCCTC GAGAGACAATTGTTTAGTGAGAAACATAATCATG Tsc22d1 BC GAGAGAGCGGCCGCCACCCGGCAATGTTCCC GAGAGAGCGGCCGCAGGCTATGCGGTTGATCC Tsc22d3 BC GAGAGAGCGGCCGCCCATGAACACCGAAATGTATC GAGAGACAATTGCTTACACCGCAGAACCACC Tsn AK GAGAGAGCGGCCGCCTGTGAGCGAGATCTTCG GAGAGACAATTGGCCAGCAAGGCCAGCC Vps72 BC GAGAGAGCGGCCGCGGTATGAGTTTGGCTG GAGAGACAATTGAGGTGTCTCTATTTGATGAC 41.8 ~55 Xbp1 BC GAGAGAGCGGCCGCATGGTGGTGGTGGCAGCG GAGAGACAATTGAACTAGAGGCTTGGTGTATAC unspliced variant Zfp238 BC GAGAGAGCGGCCGCGAGTTTCCAGACCACAGC GAGAGACAATTGAATTATTTCCAAAGTTCTTGAG 59.4 ~30 Zfp385 BC GAGAGAGCGGCCGCATGCAGCCACCGATGG GAGAGACAATTGAGGGTTGAGGTCAGTAGG Zfp472 BC GAGAGAGCGGCCGCGAGCCAGTGACCTTTGAG GAGAGACAATTGTTAGCCACTGAGCTTCTTC 62.5 not detected Zfp64 BC GAGAGAGCGGCCGCATGAACGCGAGCGTGG GAGAGACAATTGCTAGAGGTCGTGGCTGG Zmynd11 BC GAGAGAGCGGCCGCATGTCCCGAGTCCACGG GAGAGAGAATTCTCATCTCTTCCGGCGG Table S3.2 Subcloning strategy and protein expression of candidates. The accession numbers corresponding to each cdna used as template for PCR amplification are presented in addition to the sequence of forward and reverse primers used for subcloning. The size of corresponding FLAG-proteins produced in retroviral producers were estimated and determined by western blot using an anti-flag antibody; sequences underlined in columns 3-4 represent restriction sites used for subcloning; *=estimated according to bioinformatics.org/sms/prot_mw.html; +=same molecular weight as estimated within a margin of error of 10 kda; n/a=not applicable.
131 105 exp1 inf. lev. Day 0 Day 7 Day 7 Day 7 Day 7 Day 7 construct (%GFP + ) 4 w 8 w 12 w 16 w 4 w 8 w 12 w 16 w 16 w 16 w 16 w 16 w vector only HOXB NA10HD Acin Actl6a Bptf Brf Cbfb Cbx Cebpg Cnbp Crebl Crem Ctcf Dnmt Dnmt3a Edf Egr Elf Erdr Fos Gabpb Gata Gata H2afy H2afz H3f3a H3f3b Hdac Hes Hey Hipk Hmga Hmga Hmgb Hmgn Hmgn Hnrpab Hnrpdl Hnrpk Ilf Irf Kif Klf Klf Klf Lass Maged Mbnl Mef2c Meis Mkl Mta Mxi Myb Mycn Nap1l Ncl Nfe2l Nfe2l Nr1i Nr4a Pbx Phc Phf Pml Polr3k Prdm Prdm Prox Rbbp Rela Rnps Runx Sf Sfpi Sirt Ski Smarca Smarcc Sox Ssrp Sumo Swap Tada2l Tcea Tcerg Tcf Tcf Tcf7l Tcfec Tes Tfam Tgif Tle Trim Trp53bp Tsc22d Tsc22d Tsn Vps Xbp Zfp Zfp Zfp Zfp Zmynd exp2 exp3 exp4 exp5 Table S3.3 Summary of gene transfer and reconstitution data obtained from primary screen and validation experiments. Gene transfer efficiencies, based on the proportion of GFP + cells at day 4 (4 days after day 0 in Figure 3.1B), are presented in the 2 nd column for each candidate tested in the primary screen. Values in other columns represent mean percentages of peripheral blood reconstitution levels by CD cells in independent experiments (see also ca/self-renewal for more details and mice identification numbers used in the different experiments). For validation experiments (i.e., experiments 2 to 5), only day 7 data are presented. Note that several mice were eliminated at 12 or 16 weeks post-transplantation because they did not meet our reconstitution level criteria for primary screen hit selection (see also Figure 3.2B). Except for day 0 (n=2 mice) and vector control (n=9 mice), all values represent mean of 3 different mice; expt=experiment; w=weeks; inf. lev.=infection level.
132 106 Selected mice at 20 weeks All mice at 16 weeks Gene transfer DDR Provirus DDR (%CD45.1) Gene Description (%GFP)(%CD45.1) detect. Clonality Day 0 Day 7 Concl. vector negative control 67±28 6±4 0/ ±2 4±1 Hoxb4 positive control 15 30±8 3/3 4 32±6 31±6 Smarcc1 SWI/SNF related, subfamily c, member 1 10±5 40±12 5/7 5 33±3 31±8 Vps72 Vacuolar protein sorting 72 56±8 38±13 7/7 5 12±3 26±8 Fos FBJ osteosarcoma oncogene 71±9 43±13 2/7 2 5±1 31±8 NCA Trim27 Tripartite motif protein 27 71±26 55±25 4/5 4 9±5 36±11 Sox4 SRY-box containing gene 4 76±20 43±16 8/ ±8 33±9 Klf10 Krüppel-like factor 10 54±12 52±14 6/6 6 16±8 35±7 Ski Sloan-Kettering viral oncogene homolog 9±4 44±13 3/3 4 33±3 36±6 Prdm16 PR domain containing 16 2±1 48±14 6/6 8 35±2 33±15 Erdr1 Erythroid differentiation regulator 1 45±19 58±9 4/5 7 24±12 28±14 Sfpi1 SFFV proviral integration 1 40±24 63±21 0/3 0 6±2 26±12 NCA Table S3.4 Summary of Hoxb4-like candidates on HSC activity and clonality of reconstitution. Hoxb4-like candidates Columns 3 to 6 present results for selected mice, which were analyzed at 20 weeks posttransplantation. These include gene transfer efficiencies as proportion of GFP-positive cells in cultures at day 4 (mean±sd, column 3), peripheral blood reconstitution by CD HSC (mean±sd, column 4), proportion of mice containing proviral DNA in their BM (column 5), and the minimal number of independent clones contributing to reconstitution (column 6). Results presented in column 6 show that, except for the 2 non-cell autonomous candidates Fos and Sfpi1, several different clones (n=4-8 per gene) contributed to reconstitution in recipient mice. In some cases (e.g., Smarcc1), we could track up to 5 clones reconstituting a cohort of mice derived from a single well for an estimated recovery of above 50% of the input LT- HSC introduced in such cultures. This suggests the absence of clonal dominance, typically associated with low frequency events such as insertional mutagenesis. Columns 7 to 9 present peripheral blood reconstitution values (in %) for the entire cohort of mice transplanted at day 0 (mean±sem, column 7) and at day 7 (column 8). Column 9 provides an assessment of possible non-cell autonomous (NCA) activity for each of the candidate gene. Below is a brief description of the known activity for these 10 genes. Smarcc1 (SWI/SNF-related matrixassociated actin-dependent regulator of chromatin subfamily C member 1, or BRG1-associated factor 155) overexpression positively correlates with tumour recurrence and dedifferentiation in prostate cancer (Heeboll et al., 2008). Vps72 (vacuolar protein sorting-associated protein 72 homolog) is a new subunit of the TRRAP/TIP60 HAT complex and seems to play multiple roles in chromatin modification and remodelling in cells (Cai et al., 2005). Fos, or proto-oncogene protein c-fos, is a nuclear phosphoprotein, which is thought to have an important role in signal transduction, cell proliferation, differentiation and protection against stress-induced cell death in certain cell types (Zhou et al., 2007). Trim27 (tripartite motif-containing protein 27) represses transcriptional activation by basic helix-loop-helix (bhlh) transcription factors (Bloor et al., 2005). Note that 2 versions (truncated and full-length) of this gene were tested (see Figure S3.5 for details). Sox4 (SRY-related HMG-box gene 4) is overexpressed in t(8;21)(q22;q22) acute myelogenous leukaemia (Tonks et al., 2007). Klf10 (Krüppel-like factor 10) acts as an inducer or repressor of gene transcription to enhance the TGFb/Smad pathway, as well as other signaling pathways, to regulate cell proliferation, differentiation, and apoptosis in skeletal disease (osteopenia/osteoporosis), heart disease (hypertrophic cardiomyopathy), and cancer (breast and prostate) (Subramaniam et al., 2007). Ski (Sloan-Kettering viral oncogene homolog) seems
133 107 to be involved in the blocking of differentiation in AML via inhibition of RARalpha signaling (Ritter et al., 2006). Prdm16 (PR domain-containing protein 16) is involved in leukemias with chromosomal rearrangements. Overexpression of the short isoform, sprdm16, in mouse bone marrow induced AML with full penetrance, but only in the absence of p53. Overexpression also increased the pool of HSC in vivo, and in vitro blocked myeloid differentiation and prolonged progenitor life span (Shing et al., 2007). Erdr1 (erythroid differentiation regulator 1) expression is observed in many normal mouse tissues, yet in hematopoiesis is largely confined to CD34 + cells (Dormer et al., 2004). Finally, Sfpi1 (transcription factor PU.1 or SFFV proviral integration 1 protein) acts as a lymphoid-specific enhancer and is a transcriptional activator that may be specifically involved in the differentiation or activation of macrophages and B cells. DDR=donor-derived reconstitution; detect.=detection; Concl.=Conclusion.
134 108 1 ary recipients ary 2 recipients (%CD45.1 in blood at 14 wks) %CD45.1 Fold exp. in Provirus Total + B220 + CD8 CD11b gene mouse no. (16 wks) CD150 + CD48 - Lin - detection blood vector ±1 n/a no n/d n/d n/d n/d Vps yes Klf yes yes Erdr yes Fos n/a no 1 n/d n/d n/d n/a no 1 n/d n/d n/d Table S3.5 Secondary transplantation assay for selected genes. For secondary transplantation experiments, frozen-thawed bone marrow cells isolated from primary animals (20 weeks after transplantation) were cultured for 7 days in feeder-free growth factor-supplemented media to simulate the conditions utilized between day 0 to day 7 in the primary screen (see Figure 3.1B). ~5 x 10 6 input cells (~1/4 femur) cultured cells were transplanted per myeloablated secondary recipient and blood reconstitution (%CD45.1) analyzed at 4, 8 and 14 weeks after transplantation (only 14 week data are presented). Note that, except for primary recipients of vector control cells, reconstitution levels were between 50-72% for all primary mice used in these experiments. Note also that while proviral DNA for Vps72, Klf10 and Erdr1 was easily detected in the bone marrow of each of the primary recipients (5 th column in Table S3.5 and Figure 3.6) it was not found for Fos (Figure 3.6, bottom panels) and for control vectors (data not shown). The results from Q-RT-PCR experiments show relative expression levels of the indicated transgenes over their corresponding normal endogenous levels (expressed as Fold exp. in 4 th column) in purified CD150 + CD48 + Lin - cells isolated at the time the primary mice were sacrificed. Interestingly for Klf10, there was a correlation between reconstitution level in secondary recipients and transgene expression in primary donors (compare results for mouse 2111: 6-fold increase in Klf10 and 25% CD cells in corresponding secondary recipient, to that of mouse #3293 in which Klf10 levels are lower). Also note that the peripheral blood reconstitution in all four secondary recipients analyzed was multi-lineage. Consistent with a non-cell autonomous function for Fos, secondary recipients of cells isolated from mice #2081 and #3472 were poorly reconstituted by donor cells. Together, these results suggest that enhanced self-renewal of HSC, rather than transient expansion of (multipotent) progenitor cells, is responsible for the observed effects of Vps72, Klf10 and Erdr1 on HSC activity described in this manuscript. Secondary transplantation experiments also further validate the non-cell autonomous function of Fos within this experimental setup. Wks=weeks post-transplantation; n/a=not applicable; n/d=not determined +
135 109 Gene symbol Mouse RefSeq Forward primer Reverse primer Universal ProbeLibrary # Bmi1 NM_ aaaccagaccactcctgaaca tcttcttctcttcatctcatttttga 95 Cnbp NM_ tcttgccaaggattgtgatct gccacctctaccgcagttat 88 Erdr1 NM_ gacggagcgattctcacg ggcatttctgtacgcagtca 12 Fos NM_ gggacagcctttcctactacc gatctgcgcaaaagtcctgt 67 Gpx3 NM_ ggcttcccttccaaccaa cccacctggtcgaacatact 92 Hdac1 NM_ tgctggacttacgaaacagc gtcgttgtagggcagctcat 81 Hmgb1 NM_ ttttcttctcaaggggaagcta cagggcatgtggacaaaag 11 Hnrpdl NM_ aagatcaacgcgagcaaga ccagctcaagcctccaataa 18 Hoxa9 NM_ tccctgactgactatgcttgtg gttggcagccgggttatt 25 Hoxb4 NM_ ctggatgcgcaaagttcac gtgaaactccttctccaactcc 62 Klf10 NM_ ggctaactaagcagccagca gggcttttcagaaattagttcca 27 Pml NM_ cactcacccagtgacaacca cttcatggagccgactgtct 15 Prdm16 NM_ acaggcaggctaagaaccag gatgttcaaccaagcatcca 55 Sfpi1 NM_ atggagaagctgatggcttg ggaactggtacaggcgaatc 27 Ski NM_ gagaaagagacgtccccaca tcaaagctcttgtaggagtagaagc 33 Smarcc1 NM_ tccaagaaaacactggcaaa gggtctcctgttctgtccac 11 Sox4 NM_ acagcgacaagattccgttc gtcagccatgtgcttgagg 79 Tcfec NM_ ccatgagcccagacagtga catccaaaatactcccagataaatg 76 Trim27 NM_ ccgactggaccacctaagaa tttttccctctccatctgagtc 32 Vps72 NM_ gacaacttacgggggtttca tccccttcatcaatgtcaaag 88 Xbp1 NM_ agcaagtggtggatttggaa ccgtgagttttctcccgtaa 78 Zfp472 NM_ tgcatcagaagcaggaaatg gagtccaacatagtccactctccta 5 Table S3.6 Primer sequences and Universal ProbeLibrary probe numbers used in Q-RT-PCR assays. Universal ProbeLibrary # refers to the identification number for the Taqman-like short probes used in these studies. Sequences for these probes are available online at roche-applied-science.com/
136 Supplemental Experimental Procedures Retroviral Vectors Template cdna listed in Table S3.2 are from the following source: cdna corresponding to BC accession numbers come from ATCC, Manassas, VA, USA; cdna corresponding to AK accession numbers come from Riken DNABook, Japan. Amplicons were digested with appropriate restriction enzymes [Not1, EcoR1 (Invitrogen, Burlington, ON, Canada) and/or Mfe1 (New England Biolabs, Ipswich, MA, USA)], and subcloned into 1 of 3 modified MSCV-PGK-GFP vectors (pkof-1, -2 or -3, containing different reading frames) in accordance with specific frameshift requirements upon subcloning. Confirmatory sequencing of all cloned cdna was performed using the ABI 3730 Genetic Analyser at the Institute for Research in Immunology and Cancer (IRIC) genomics platform in Montreal (Dr. Pierre Chagnon) Animals Animals were housed in ventilated cages and provided with sterilized food and acidified water under veterinary supervision. Experimental procedures were revised and approved by University of Montreal animal ethics committee (Comité de Déontologie de l Expérimentation sur les Animaux de l Université de Montréal) Hematopoietic Stem Cell Isolation Bone marrow cells harvested from C57Bl/6J-CD45.1-Pep3b mice were stained with allophycocyanin (APC)-conjugated primary antibodies recognizing differentiation specific cell surface markers [Gr-1, B220 and Ter119 (BioLegend, San Diego, CA)]. Cells were washed, pelleted, and stained with anti-apc magnetic MicroBeads according to manufacturer guidelines (Miltenyi Biotec Inc, Auburn, CA, Order no ). Depletion of the lineage positive cells was achieved using the AUTO-MACS magnetic cell separator system (Becton-Dickinson, San Jose, CA, USA). The lineage negative cell fraction was subsequently stained with fluorescein isothiocyanate (FITC)-conjugated anti-cd48 and phycoerythrin (PE)-conjugated anti-cd150 antibodies (BioLegend, San Diego, CA). This step was followed by purification of the PE-CD150 + /FITC-CD48 - /APC-Lin - stem cell enriched subpopulation by flow cytometry using the FACSAria cell sorter (Becton- Dickinson, San Jose, CA, USA). Cell populations used for Q-RT-PCR expression stud-
137 111 ies were additionally stained with PE-Cy7-conjugated anti-ckit and PE-Cy5-conjugated anti-sca1 antibodies (BioLegend, San Diego, CA) after the lineage depletion step, and sorting gates set to isolate the PE-CD150 + /PE-Cy5-Sca1 + /PE-Cy7-cKit + /FITC-CD48 - / APC-Lin - cell fraction from bone marrow, or PE-Cy7-CD150 + /PE-Cy5-Sca1 + /APC-Cy7- ckit + /FITC-CD48 - /PE-Mac + /APC-Lin - cell fraction from fetal liver Bone Marrow Cells Culture, Retroviral Infection and Transplantation Freshly sorted CD150 + CD48 - Lin - CD bone marrow cells were plated at a density of 1,500 cells per well, and co-cultured for 5 days on these confluent and irradiated (1,500 cgy of 137 Cs gamma radiation) retroviral producers in the presence of Dulbecco s modified Eagle s medium (DMEM) supplemented with 15% fetal bovine serum (FBS), 10 ng/ml human interleukin-6 (IL-6), 6 ng/ml murine interleukin-3 (IL-3), 100 ng/ml murine stem cell factor (SF), and 6 µg/ml polybrene, 10 µg/ml ciprofloxacin and 10-4 M β-mercaptoethanol. Upon this infection interval (day 0), contents from each well were harvested by trypsinization and the retrieved cell volume was partitioned between cell culture and transplantation requirements. For every candidate gene, 2 independent C57Bl/6J-CD45.2 recipient mice were sublethally irradiated (800 cgy of 137 Cs gamma radiation) and received 1/8 of the cell suspension, along with 2x10 5 whole bone marrow competitor cells (CD ). One half of the cell suspension remained in culture for an additional 7 day period, at the end of which (day 7), 3 independent recipient mice were similarly transplanted with a graft equivalent to 1/8 of the original cell input, for each condition. A small aliquot was drawn from day 4 cultures to assess gene transfer by EGFP expression using flow cytometry esis Flow Cytometry Assessment of Donor-Derived Hematopoi- A 50µl blood sample obtained from tail vein puncture was incubated with excess ammonium chloride (StemCell Technologies, Vancouver, BC, Canada) to favour lysis of erythrocytes. The washed cell pellet was then stained with a primary PE-conjugated antibody recognizing the CD (donor-derived) leucocyte cell surface marker (BioLegend, San Diego, CA), as described (see HSC isolation section above). Immunophenotype was determined by flow cytometry (BD LSR II flow cytometer, BD Biosciences, San Jose, CA, USA) and data analyzed using FlowJo software (Tree Star Inc., Ashland, OR, USA). Similarly, at 20 weeks post-transplantation, cells isolated from blood, bone marrow and thymus were stained with a cocktail of antibodies directed against various cell surface differentiation markers [APC-Cy7-conjugated anti-b220, PE-Cy5-conjugated an-
138 112 ti-cd11b and PE-Cy5.5-congugated anti-cd3 ε antibodies (BioLegend, San Diego, CA)] and analyzed by flow cytometry Southern Blot Analysis of Genomic DNA High-molecular-weight DNA from hematopoietic tissues of long-term (20 weeks) post-transplantation recipients was isolated with DNAzol reagent (Invitrogen, Carlsbad, CA, USA), as recommended by the manufacturer guidelines. Proviral integration patterns were determined by Southern blot analysis of isolated DNA as previously described (Krosl et al., 2003b) using the EcoRI restriction enzyme, with a unique specific recognition sequence within the integrated provirus DNA. 20 µg of the digested genomic DNA were separated by 1% agarose gel electrophoresis and transferred to a Zeta-probe membrane (Bio-Rad, Mississauga, ON, Canada). A 710 bp [ 32 P]dCTP EGFP probe, digested from peyfp-n1 (Clontech Laboratories Inc., Palo Alto, CA, USA) with EcoRI/HindIII (Invitrogen, Burlington, ON, Canada), was used to reveal the integration patterns, and a 1.8 kb [ 32 P]dCTP β-actin probe was used for loading control Western Blot Analysis Protein expression of cloned cdna was assessed in retroviral producing cell lines. Protein extracts were obtained from transfected GP+E86 cells grown in 96 well plates by incubation with a 30 µl volume of 1x Laemmli (1/60 β-mercaptoethanol) solution per well, followed by a 10 min boiling step. Western blots analyses were performed as previously described (Krosl et al., 2003b). A mouse anti-flag primary antibody (BioLegend, San Diego, CA) was used to reveal the presence of the candidate protein, followed by a goat horseradish peroxidase-conjugated anti-mouse secondary antibody (Santa Cruz Biotechnology Inc, Santa Cruz, CA, USA) Q-RT-PCR Expression Studies For gene expression profile analyses, cells were harvested following 5 days of infection using trypsinization, and individual well contents resubmitted to cell sorting (FACSAria cell sorter, Becton-Dickinson, San Jose, CA, USA). Gates were set to positively select for GFP + cells, excluding GP+E86 retroviral producers by forward- and side-scatter criteria. Cells were directly collected in Trizol solution to isolate total RNA, according to the manufacturer s protocol (Invitrogen, Burlington, ON, Canada). Reverse transcription of total RNA was performed using the MMLV-reverse transcriptase (RT) and random hexamers according to manufacturer s guidelines (Invitrogen, Burlington, ON, Canada). Resulting cdna was pre-amplified using a TaqMan PreAmp (Applied Biosystems, Foster City, CA, USA) algorithm in which candidate genes specific oligo-
139 113 nucleotides (sequences available on request) were added to the PreAmp Master mix (final concentration of 50nM). PCR conditions for the pre-amplification reactions were as follows: 95 C for 10 minutes, followed by 12 cycles of 95 C/15 sec and 60 C/4 min. The ABI Gene Expression Assay was performed to measure gene expression levels using primer and probe sets from Applied Biosystems (primer and probe sequences are available on request). Q-RT-PCR reactions were done on a high-throughput ABI 7900HT Fast Real-Time PCR System (Applied Biosystems). Briefly, from a given test sample, the Ct (threshold cycle) values for each gene were normalized to the endogenous control gene TBP or β-actin (Applied Biosystems; CT = Ct target - Ct endogenous ) and compared to the mean CT from control sample (calibrator) using the Ct method ( CT = Ct Sample - Ct Calibrator ). Q-RT-PCR cycling conditions were as follows: 2 minutes at 50 C and 10 minutes at 95 C, followed by 40 cycles of 15 seconds at 95 C and 1 minute at 59 C. The primer sequences and probes used in qpcr assays are presented in Table S3.6.
140 Supplemental References Bhattacharya, B., Miura, T., Brandenberger, R., Mejido, J., Luo, Y., Yang, A.X., Joshi, B.H., Ginis, I., Thies, R.S., Amit, M., et al. (2004). Gene expression in human embryonic stem cell lines: unique molecular signature. Blood 103, Bloor, A.J., Kotsopoulou, E., Hayward, P., Champion, B.R., and Green, A.R. (2005). RFP represses transcriptional activation by bhlh transcription factors. Oncogene 24, Cai, Y., Jin, J., Florens, L., Swanson, S.K., Kusch, T., Li, B., Workman, J.L., Washburn, M.P., Conaway, R.C., and Conaway, J.W. (2005). The mammalian YL1 protein is a shared subunit of the TRRAP/TIP60 histone acetyltransferase and SRCAP complexes. J Biol Chem 280, Dormer, P., Spitzer, E., Frankenberger, M., and Kremmer, E. (2004). Erythroid differentiation regulator (EDR), a novel, highly conserved factor I. Induction of haemoglobin synthesis in erythroleukaemic cells. Cytokine 26, Georgantas, R.W., 3rd, Tanadve, V., Malehorn, M., Heimfeld, S., Chen, C., Carr, L., Martinez-Murillo, F., Riggins, G., Kowalski, J., and Civin, C.I. (2004). Microarray and serial analysis of gene expression analyses identify known and novel transcripts overexpressed in hematopoietic stem cells. Cancer Res 64, Heeboll, S., Borre, M., Ottosen, P.D., Andersen, C.L., Mansilla, F., Dyrskjot, L., Orntoft, T.F., and Torring, N. (2008). SMARCC1 expression is upregulated in prostate cancer and positively correlated with tumour recurrence and dedifferentiation. Histol Histopathol 23, Ivanova, N.B., Dimos, J.T., Schaniel, C., Hackney, J.A., Moore, K.A., and Lemischka, I.R. (2002). A stem cell molecular signature. Science 298, Krosl, J., Beslu, N., Mayotte, N., Humphries, R.K., and Sauvageau, G. (2003). The competitive nature of HOXB4-transduced HSC is limited by PBX1: the generation of ultracompetitive stem cells retaining full differentiation potential. Immunity 18,
141 115 Phillips, R.L., Ernst, R.E., Brunk, B., Ivanova, N., Mahan, M.A., Deanehan, J.K., Moore, K.A., Overton, G.C., and Lemischka, I.R. (2000). The genetic program of hematopoietic stem cells. Science 288, Ramalho-Santos, M., Yoon, S., Matsuzaki, Y., Mulligan, R.C., and Melton, D.A. (2002). Stemness : transcriptional profiling of embryonic and adult stem cells. Science 298, Ritter, M., Kattmann, D., Teichler, S., Hartmann, O., Samuelsson, M.K., Burchert, A., Bach, J.P., Kim, T.D., Berwanger, B., Thiede, C., et al. (2006). Inhibition of retinoic acid receptor signaling by Ski in acute myeloid leukemia. Leukemia 20, Shim, M.H., Hoover, A., Blake, N., Drachman, J.G., and Reems, J.A. (2004). Gene expression profile of primary human CD34+CD38lo cells differentiating along the megakaryocyte lineage. Exp Hematol 32, Shing, D.C., Trubia, M., Marchesi, F., Radaelli, E., Belloni, E., Tapinassi, C., Scanziani, E., Mecucci, C., Crescenzi, B., Lahortiga, I., et al. (2007). Overexpression of sprdm16 coupled with loss of p53 induces myeloid leukemias in mice. J Clin Invest 117, Shojaei, F., Gallacher, L., and Bhatia, M. (2004). Differential gene expression of human stem progenitor cells derived from early stages of in utero human hematopoiesis. Blood 103, Subramaniam, M., Hawse, J.R., Johnsen, S.A., and Spelsberg, T.C. (2007). Role of TIEG1 in biological processes and disease states. J Cell Biochem 102, Terskikh, A.V., Easterday, M.C., Li, L., Hood, L., Kornblum, H.I., Geschwind, D.H., and Weissman, I.L. (2001). From hematopoiesis to neuropoiesis: evidence of overlapping genetic programs. Proc Natl Acad Sci U S A 98, Tonks, A., Pearn, L., Musson, M., Gilkes, A., Mills, K.I., Burnett, A.K., and Darley, R.L. (2007). Transcriptional dysregulation mediated by RUNX1-RUNX1T1 in normal human progenitor cells and in acute myeloid leukaemia. Leukemia 21, Zhou, H., Gao, J., Lu, Z.Y., Lu, L., Dai, W., and Xu, M. (2007). Role of c-fos/jund in protecting stress-induced cell death. Cell Prolif 40,
142 CHAPITRE 4 ARTICLE Asymmetrical Segregation and Self-Renewal of Hematopoietic Stem and Progenitor Cells with Endocytic Ap2a2 Publié dans: Blood 2012 Mar 15;119(11): PMID:
143 117 4 Asymmetrical segregation and self-renewal of he- matopoietic stem and progenitor cells with endocytic Ap2a2 Stephen B. Ting 1,2,3,4, Eric Deneault 1, Kristin Hope 1,5, Sonia Cellot 1,6, Jalila Chagraoui 1, Nadine Mayotte 1, Jonas F. Dorn 7, Jean-Philippe Laverdure 1, Michael Harvey 2, Edwin D. Hawkins 2, Sarah M. Russell 2,8, Paul S. Maddox 7, Norman N. Iscove 9, Guy Sauvageau 1,10 1. Molecular Genetics of Stem Cells Laboratory, Institute of Research in Immunology and Cancer (IRIC), University of Montreal, Montreal, Canada 2. Immune Signalling Laboratory, Cancer Immunology, Research Division, Peter Mac- Callum Cancer Centre, East Melbourne, Australia 3. Department of Clinical Hematology, Peter MacCallum Cancer Centre, East Melbourne, Australia 4. Current address: Stem Cell Research Group, Division of Blood Cancers, Australian Centre for Blood Diseases (ACBD), Department of Hematology, Central Clinical School, Monash University-Alfred Health, Prahran, Australia 5. Current address: McMaster Stem Cell and Cancer Research Institute, McMaster University, Hamilton, Canada 6. Hematology and Oncology and Division of Viral and Immune Disorders and Cancers, CHU Sainte-Justine, Montreal, Canada 7. Mitotic Mechanisms and Chromosome Dynamics Laboratory, IRIC, University of Montreal, Montreal, Canada 8. Centre for Micro-Photonics, Faculty of Engineering and Industrial Sciences, Swinburne University of Technology, Hawthorn, Australia 9. Department of Medical Biophysics and Immunology, The Ontario Cancer Institute, University of Toronto, Toronto, Canada 10. Division of Hematology and Leukemia Cell Bank of Quebec (BCLQ), Maison- neuve- Rosemont Hospital, Montreal, Canada Corresponding author: Stephen B. Ting 1,2,3,4 Correspondence and requests for materials should be addressed to S.B.T.
144 Phone , Fax
145 Contribution des Co-Auteurs Le chapitre 4 présente les résultats d un criblage de facteurs de division asymétrique, en utilisant la même méthode que celle du chapitre précédant, et caractérise en profondeur le rôle d AP2A2 lors de l auto-renouvellement des HSCs. En tout, six nouveaux facteurs de division asymétrique augmentant l activité des HSCs ont été identifiés. Parmi eux, cinq ont été identifiés par moi-même en même temps que le criblage de facteurs nucléaires présenté au chapitre 3, c est-à-dire AP2A2, GPSM2, TMOD1, KIF3A et CCNB1. J ai contribué à cet article de manière importante (>40%). Le projet a été élaboré principalement par Guy Sauvageau et Stephen B. Ting. J ai effectué près de la moitié des expérimentations et des analyses. Ma contribution en pourcentage aux différentes figures et tables de l article : Figure 4.1 : 0% Figure 4.2 : 90% Figure 4.3 : 40% Figure 4.4 : 80% Figure 4.5 : 20% Figure 4.6 : 0% Figure 4.7 : 0% Figure S4.1 : 0% Figure S4.2 : 0% Table S4.1 : 30% Table S4.2 : 40%
146 Abstract The stem cell intrinsic model of self-renewal via asymmetric cell division (ACD) posits that fate determinants be partitioned unequally between daughter cells to either activate or suppress the stemness state. ACD is a purported mechanism by which hematopoietic stem cells (HSCs) self-renew, but definitive evidence of this cellular process remains open to conjecture. To address this issue, we chose 73 candidate genes that function within the cell polarity network to identify potential determinants that may concomitantly alter HSC fate whilst also exhibiting asymmetrical segregation at cell division. Initial gene expression profiles of polarity candidates showed high and differential expression in both HSCs and leukemia stem cells. Altered HSC fate was assessed by our established in vitro to in vivo screen on a sub-cohort of candidate polarity genes. This revealed six novel positive regulators of HSC function: Ap2a2, Gpsm2, Tmod1, Kif3a, Racgap1 and Ccnb1. Interestingly, live cell videomicroscopy of the endocytic protein AP2A2 shows instances of asymmetric segregation during hematopoietic stem/progenitor cell cytokinesis. These results contribute further evidence that ACD is functional in HSC self-renewal, suggests a role for Ap2a2 in HSC activity, and provides a unique opportunity to prospectively analyze progeny from HSC asymmetric divisions.
147 Introduction Self-renewal is inextricably linked to stem cell division, and despite the premise that these processes in mammalian systems likely involve ACD, the molecular details remain enigmatic. Our approach to address self-renewal via ACD in the HSC has been based on increasing evidence that the mechanistic insights pertaining to polarity molecular networks, which are integral to ACD and cell fate in the invertebrate models of Drosophila melanogaster and Caenorhabditis elegans, are functionally conserved throughout evolution 1-3. Studies from invertebrate models support both extrinsic (niche) and stem cell intrinsic mechanisms of ACD. In relation to the cell intrinsic machinery, polarity is initiated by asymmetrically localizing protein complexes to the cell membrane. Subcomponents of these complexes act as cell fate determinants that are maintained asymmetrically during mitosis, and are subsequently segregated differentially into daughter cells. During this process, at the simplest level and without factoring in other potential cell organelle 4,5 or cell cycle component interactions 6,7, these membrane complexes interact with centrosomes and the cytoskeletal network to respectively anchor and enable correct mitotic spindle orientation for an ACD The distinct advantages of these invertebrate models include the ability to follow the end fate of daughter cells during successive rounds of ACD, together with real-time video tracking to observe the clear segregation of established cell fate determinants during and after the ACD process. In contrast, within the hematopoietic system, these advantages are attenuated by the absence of definitive HSC markers or cell fate determinants that could allow for investigations of successive divisions of the long-term repopulating HSC (LT-HSC). The added factor of HSC motility outside of its niche further hinders prospective daughter cell fate analysis. Despite these limitations, important aspects of HSC self-renewal with indirect implications for ACD as a mechanism have been reported. For example, for many decades single cell manipulations with more enriched HSC populations over time have documented different in vitro 11,12 and in vivo cell fates. And, evidence of asymmetrical segregation of proteins within the hematopoietic system has also been reported 16-18, although without confirming an alteration in cell fate, as in vivo daughter cell assays were not tenable in these studies. Other studies have used live cell videomicroscopy of single
148 122 cells derived from a population enriched for HSCs together with clonal fate of progeny as measured by in vivo repopulation assays to provide morphological clues as to the identity of LT-HSCs without in this setting, confirming ACD per se 19. Far from being a critique, these examples reflect the difficulty of directly connecting ACD to daughter cell fate within the heterogeneity of the HSC system. Our paper aims to provide further evidence that the process of ACD is functional in HSC fate and to serve as a foundation for ongoing future studies that may allow ACD, HSC fate and self-renewal to be directly and mechanistically linked.
149 Material and Methods Retroviral vectors; Animal husbandry; Hematopoietic stem cell isolation; Q-RT-PCR expression studies; Bone marrow cells culture, retroviral infection and transplantation; Flow cytometry assessment of donor-derived hematopoiesis; Southern blot analysis of genomic DNA; CRU assay on HSC-enriched cells; and Cell proliferation and cell death analyses. All of these methods are as detailed in Deneault et al. 20. All animal procedures were performed after approval from the Animal Ethic Committees of University of Montreal and Peter MacCallum Cancer Institute Resource database and web application Found at Confocal Microscopy Mouse adult bone marrow (BM) and E14.5 fetal liver (FL) cells were independently isolated and lineage depleted by staining with APC-conjugated primary antibodies to Gr1, B220 and Ter119 (all from Biolegend). Respective BM and FL cells were stained with anti-apc magnetic microbeads according to manufacturer guidelines (Miltenyi Biotec), and lineage positive cells depleted via the AUTO-MACS magnetic cell separator system (Becton-Dickinson). For the adult BM cells, lineage negative cells were stained with PE-CD150, APC - CD48, PE-Cy5-Sca, and PE-Cy7-Kit conjugated antibodies, and the enriched CD Lin - Sca + Kit + (LSK) subpopulation of cells collected by flow cytometry using the Aria II FACS machine (Becton Dickinson). For the FL cells, lineage negative cells were stained with PE-CD150, APC-CD48, PE-Cy5-Sca, FITC-Mac conjugated antibodies, and the enriched CD Sca + Mac1 + Lin - subpopulation of cells collected. These respective subpopulations of cells were resuspended in Dulbecco s Modified Eagle s Medium (DMEM) with 15% fetal bovine serum. Respective BM and FL enriched subpopulations up to 50,000 cells per slide were seeded onto poly-l-lysine coated coverslips and incubated at 37 C for 60 minutes. Cells were then fixed with 4% PFA for 15 minutes at 4 C and permeabilized with PBS, 1% BSA, 0,1% Tween and stained with
150 124 primary antibodies to Ap2a2 (Abcam AP6, ab2730) and/or Numb (Abcam, ab4147) and revealed by Alexa Fluor 488 and/or Alexa Fluor 594 labelled secondary antibodies (Molecular Probes). Fluorescent images were obtained with a confocal microscope (LSM510 meta Zeiss) Videomicroscopy Freshly sorted PE-CD150 + /APC-CD48 - /PE-Cy5-Sca + /PE-Cy7-cKit + /Lin - bone marrow cells from histone H2B-GFP mice were transduced with retroviral producers infected with MSCV-cherry-Ap2a2 and/or pcxibsr-venus-numb vectors for 3 days. Cells were then sorted based on forward and side scatter, to differentiate between hematopoietic and feeder cells. Isolated hematopoiteic cells in bone marrow media 20 were seeded into 8 mm sterile cloning discs (Bel-Art, Scienceware No.F ) placed on glass-bottom MakTek no.1.5 dishes (MatTek Corporation, Ashland, MA, USA) of a confluent and irradiated (1500 cgy of 137 Cs gamma radiation) layer of either NIH 3T3 or OP9 cells. Video imaging comprised of 3 colors (green and red fluorescence, and transmitted light) and 4 z-sections, 2.5 μm apart, every 15 minutes for 24 hours with an Olympus 60x/1.42NA oil immersion lens and a Photometric CoolSnap HQ2 camera on a DeltaVision video microscope fitted with a 37 C environmental chamber (Applied Precision). Video analyses were performed with softworxexplorer software (Applied Precision), and Imaris (Bitplane Scientific Software) Statistical analysis The significance of differences was determined by two-tailed Students t test.
151 Results Candidate polarity screen for HSC expansion Using existing expression databases 21 and literature analyses, we compiled a candidate gene list of polarity cell fate determinants for initial gene expression profiling. Given the heterogeneity of the HSC compartment, we used two established enriched HSC subpopulations, the CD Lin - and CD49b - Rhodamine low LSK cells for assessment (Figures 4.1A-C and supplemental Table 1). These gene expression profiles show that a broad range of polarity candidates are highly and differentially expressed in both HSC and leukemia cells (Figures 4.1A-C). To assess whether polarity genes would be altered by an established HSC expansion factor 22, we profiled gene expression levels of a subset of candidate genes after HSCs were transduced with HoxB4 in comparison to MSCV vector (Figure 4.1D). This data shows that HoxB4 does not impact on this subset of polarity candidate genes at the mrna level. Based on our gene expression profiles (Figure 4.1), 43 (~60%) of the candidates were chosen to assess whether any of these genes could alter the fate of LT-HSC by utilizing an established gain of function in vitro to in vivo assay (see Deneault et al. 20, for full details) (Figure 4.2A-B and The theoretical essence of this screen is based on the relative inability of HSCs to preserve functional identity (i.e. self-renewal) during a period of in vitro culture, where apoptosis or differentiation are the predominant HSC fate, and as measured by the relative absence of in vivo repopulation of sublethally irradiated recipients upon transplantation. In contrast, transduction by a candidate fate-transforming gene, to either maintain or expand the HSC population after in vitro culture would result in a predominant donor-derived in vivo transplantation output. Briefly, 1,500 enriched CD Lin - HSCs (equivalent to ~62 competitive repopulating units (CRU) per well or 8 CRU per transplanted mouse 20 ) from CD45.1 mice were transduced with high titer retroviruses produced from transfections with the candidate genes and cultured in vitro for 7 days before transplantation into 3 recipient CD45.2 mice. Every 4 weeks up to 16 weeks, donor-derived white blood cell reconstitution was assessed. The two negative controls were HSCs transduced with vectors pkof and MSCV; whilst the two positive controls were transduced with the NUP98-HOXA10 fusion (NA10HD) 23 and HoxB4 22,24, with the positive cut-off set at the latter s mean reconstitution of 30% at 16 weeks. This primary screen revealed six (14%) positive candidates that significantly increased hematopoietic reconstitution: Ap2a2, Gpsm2, Tmod1, Kif3a, Racgap1 and Ccnb1
 groups (see below) based initially on: biological process (Groups Ι-XΙ).")
152 126 Figure 4.1 Gene expression profiles of HSC polarity fate determinants. Candidate genes were classified according to Gene Ontology (GO) groups (see below) based initially on: biological process (Groups Ι-XΙ). In the absence of a biological process, then based on: molecular function (Group XΙΙ) and cellular component (Group XΙΙΙ). The expression of these candidate genes was performed on purified HSC populations in comparison to more differentiated progenitors. Each data set is represented by the mean average delta Ct from two experiments. Gene expressions from: (A) HSCs sorted on CD Lin - (with a stem cell frequency of 1 in 10 based on competitive repopulation unit assay (CRU), data not shown) and Progenitors CD Lin - (B) HSCs sorted on CD49b - Rhodamine low LSK (with a stem cell frequency of 1 in 8 based on CRU, data not shown) and Progenitors CD49b - Rhodamine high LSK, and (C) Two independent murine leukemias, FLA2 and FLB1 derived from HoxA9 + Meis1 transduced fetal liver cells, that differ in leukemia stem cell frequency of respectively, 1 in 1.4 and 1 in 347 (based on previous CRU, data not shown). (D) A subset of these candidate genes were profiled after CD Lin - HSCs were transduced with an established expansion
153 127 factor, HoxB4 in comparison to MSCV vector alone transduced HSCs. GO Groups: Ι_GO_7049 cell cycle; ΙΙ_51301 cell division; ΙΙΙ_30154 cell differentiation; ΙV_45165 cell fate commitment; V_7163 establishment or maintenance of cell polarity; VΙ_16192 vesicle mediated transport; VΙΙ_16459 myosin complex; _7017 microtubule-based process; VΙΙΙ_7154 cell communication; ΙX_50678, _7242, _7169, _6468 receptor signaling pathways; X_48729 tissue morphogenesis; and, _43066 negative regulation of apoptosis; XΙ_33036, _51234 macromolecule and establishment of localization; XΙΙ_5515, _8092 protein and cytoskeleton binding; _3774 motor activity; _8266, _3723 RNA binding; XΙΙΙ_5886,16020 membrane; _45177 apical part of cell. From studies (A, B and C), a scoring criteria (data not shown) based on the absolute average delta Ct and the relative expression in the stem versus progenitor cell populations was used to quantify the candidates chosen for the in vitro to in vivo overexpression screen (see also Supplemental Table 4.1). (Figure 4.2B, supplemental Table 2 for full results without (Day 0) and with (Day 7) in vitro culture). Whilst the other positive candidates will be subsequently analyzed, we have initially focused on the candidate, Ap2a2, given it was the most potent HSC expansion gene within the screening experiments (Figure 4.2B) Validation and self-renewal of Ap2a2-transduced HSCs in vitro To validate Ap2a2 as a genuine candidate, we performed 3 further independent in vitro to in vivo assays with the mean reconstitution levels from each assay supporting the initial screen results (Figure 4.2C, and see Ap2a2 gene results at iric.ca/self-renewal/). We also confirmed the expression of Ap2a2 protein from NIH 3T3 (i.e., GP+E-86) producer cells used during HSC transduction (Figure 4.2D). To ensure that aberrant retroviral insertion was not aiding the reconstitution advantage of Ap2a2- transduced HSCs, we performed clonal analysis of cells obtained from bone marrow and thymus from two reconstituted mice (Figure 4.2E). This showed the presence of many clones in different independent mice, together with multipotentiality of transduced cells given the same clones were present in both myeloid (bone marrow) and lymphoid (thymus) predominated tissues of the same mouse. Further evidence of the multipotency is provided by flow cytometry analysis from a representative recipient transplanted with Ap2a2-transduced HSCs, sorted on donor CD45.1 cells with B cell (B220), monocytemacrophage (CD11b) and mature T cell (CD4, 8) reconstitution (Figure 4.2F). To validate and test whether Ap2a2-transduced HSCs expanded and/or are maintained ex vivo, we performed CRU assays 24,25 (Figure 4.3A). Initially, (based on day 0 CRU assays) 200 CD Lin - HSCs from CD45.1 mice were transduced with Ap2a2, pkof vector (negative control) and, HoxB4 and NA10HD (positive controls), cultured
 Summary of the HSC polarity genes in vitro to in vivo gain of function screen. Respective gene plasmids labeled (^ or *) in relation to respective vector backbones, (see also Supplemental Table 4.")
154 128 Figure 4.2 Polarity screen to identify agonists of HSC expansion. (A) Schematic representation of the screening approach. (B) Summary of the HSC polarity genes in vitro to in vivo gain of function screen. Respective gene plasmids labeled (^ or *) in relation to respective vector backbones, (see also Supplemental Table 4.2). (C) The mean ± SEM of 3 validation experiments. (D) Protein expression of AP2A2 in transfected GP+E-86 cells. (E) Southern blot analysis on DNA extracted from bone marrow (BM) and thymic tissues of two mice, 1 & 2, and hybridized with a GFP specific probe. (F) Flow cytometry from an Ap2a2-transduced recipient mouse sorted on donor CD45.1 cells. for 7 days in vitro and transplanted in limiting cell numbers into sublethally irradiated CD45.2 recipients. Analyses of donor white blood cell reconstitution at 12 weeks were used to determine CRU frequencies. The respective frequencies were: pkof (1 in 457,107), Ap2a2 (1 in 136,135), HoxB4 (1 in 8,165) and NA10HD (1 in 1,036) cells (Fig-
155 129 Figure 4.3 Analyses of Ap2a2- transduced HSCs In vitro. Cells used for (A to E) are CD Lin -. (A) CRU assay in primary recipients with respective transduced cells. (B) Southern blots with GFPspecific probe on bone marrow (BM) of 11 recipient mice ( ) from four independent culture wells of Ap2a2- transduced HSCs (1-4). (C) Donorderived compared to competitor, recipient-derived CD LSK LT- HSCs in bone marrow from primary recipients analysed at 20 weeks post transplantation with vector- and Ap2a2-transduced HSCs. (D) The mean acitivity of stem cells (MAS) for transplanted Ap2a2-transduced HSCs as calculated from data in Figure 4.2B- C. As these Ap2a2-transduced assays were performed in conjunction with our previous overexpression screen (20) where the control CRU was known for freshly purified CD Lin - HSCs, the published data for fresh cells, days 0 and 7 grafts, and positive grafts for Hoxb4- and Trim27-transduced cells are used as valid respective, negative controls and positive comparators. The MAS for Ap2a2 (asterisk) is statistically significantly higher (see value in (E)), compared to day 0 and 7 controls. (E) p value for Ap2a2-transduced HSCs derived from MAS data in (D) as compared to published control vectors (day 0 or 7) and the most potent HSC activators from our initial screen (20). ure 4.3A). Interestingly, when these calculated CRU frequencies are analyzed in relation to the input 200 CRU cells at day 0, and the absolute numbers of cells at the end of the in vitro culture period, we find the following fold differences in CRU cells after transduction with pkof (a 29-fold reduction), Ap2a2 (an 11-fold reduction), HoxB4 (a 2-fold increase) and NA10HD (a 19-fold increase), respectively. These results suggest that the enhanced HSC activity invoked by Ap2a2 transduction may be attributable to a relative reduced loss and/or maintenance of HSC numbers in vitro coupled with a proliferative effect in vivo, after transplantation.
156 130 To further investigate for self-renewal of expansion in vitro we looked for clonal expansion of Ap2a2-transduced HSCs by analyses of proviral integration patterns from 11 primary recipients (Figure 4.3B). Based on the absence of the same clones in any of these 11 mice from 4 independent cell culture populations (Figure 4.3B), we surmised there was no clear evidence of predominant in vitro symmetrical self-renewal with Ap2a2 during our seven days of culture. In contrast, similar clonal analyses from the majority of transcriptional positive regulators of HSCs from our previous screen 20 showed symmetrical self-renewal divisions in vitro. In the context of seemingly limited numbers of Ap2a2-transduced HSCs providing enhanced HSC function, we quantified phenotypic LT-HSC populations and the proliferative output of Ap2a2-transduced HSCs. From a separate cohort of CD45.1 donor mice, CD Lin - HSCs were transduced with vector and Ap2a2 and in vitro cultured before transplantation with 200,000 CD45.2 bone marrow competitor cells into sublethally irradiated CD45.2 recipients. We measured the percentage of LT-HSCs (CD LSK) within the donor CD45.1-transduced and CD45.2 subpopulations of recipient mice 20 weeks after transplantation (Figure 4.3C). In the Ap2a2-transduced mice, the percentage of LT-HSCs was less in the donor CD45.1 population in comparison to the CD45.2 recipient-competitor cells (Figure 4.3C). In contrast, measurement of the proliferative output per Ap2a2-transduced LT-HSC using the mean activity of stem cell (MAS), as detailed in our previous functional screen for HSC activity 20, we found a 13-fold higher MAS for Ap2a2-transduced LT-HSC when normalised to freshly sorted HSCs (Figure 4.3D). This relative MAS activity is not only higher, but statistically more significant, than both Hoxb4-transduced and the most potent gene from our initial screen, Trim27-transduced cells 20 (Figure 4.3D-E). This suggests Ap2a2-transduced HSCs possess the ability for superior proliferative output per HSC. Overall, these studies of in vitro cultured Ap2a2-transduced HSCs exhibit increased HSC activity in vivo (Figure 4.3D-E), yet absence of obvious in vitro HSC expansion based on CRU assay (Figure 4.3A) and clonal analyses in primary recipients (Figure 4.3B); and without a quantitative increase in LT-HSCs (Figure 4.3C) infers Ap2a2 induces maintenance of HSCs in vitro that is translated to an in vivo proliferative advantage by either a preference for asymmetric self-renewal divisions and/or a qualitative change in LT-HSCs Self-renewal of Ap2a2-transduced HSCs in vivo To assess whether Ap2a2-transduced LT-HSCs retained self-renewal capacity in vivo, we performed secondary transplantation assays. Eleven primary Ap2a2-transduced mice from Figure 4.3B (mice 2119 to 3491), and a further 5 mice (Figure 4.4A, 5317 to
 mice and transplanted secondary recipient (sr) mice. Horizontal bar shows the mean level of reconstitution for each (sr) group.")
157 131 Figure 4.4 Self-renewal of Ap2a2-transduced HSCs in vivo. (A) Analyses of secondary transplantation recipients. Donor CD45.1 reconstitution in numbered primary donor (pd) mice and transplanted secondary recipient (sr) mice. Horizontal bar shows the mean level of reconstitution for each (sr) group. (B) In vivo clonal analyses of selfrenewal. Southern blots with GFP-specific probe on BM from one (pd) mouse from each Ap2a2-transduced well (1-4 in Figure 4.3B) and their respective (sr) mice (as numbered and indicated by respective colour codes). (C) CRU assay in secondary recipients. From three further independent in-vitro to in-vivo assays with vector-transduced and Ap2a2-transduced CD45.2 donor CD Lin - HSCs transplanted into CD45.1 recipients: one representative primary CD45.1 recipient mouse from each assay was taken at 20 weeks post-transplantation (supplemental Figure 4.1A). From these three vector-transduced and three Ap2a2-transduced primary recipient mice, bone marrow cells were flow sorted for donor CD45.2 cells. Equivalent limiting donor cell numbers, together with 200,000 CD45.1 competitor bone marrow cells were transplanted into sublethally irradiated secondary CD45.1 recipients for assessment of donor reconstitution. Analyses at 16 weeks post secondary transplantation via WEHI bioinformatics ELDA software ( au/software/elda/). (D) Quantification of CD45.2 donor reconstitution in secondary recipients
158 132 with respective transduced-hscs from CRU in (C). p values for recipients transplanted with respectively, 100,000, 200,000 and 500,000 Ap2a2- compared to vector-transduced cells are 0.02, 0.03 and 0.01 (asterisks). (E) Donor-derived compared to recipient-derived LSK cells in bone marrow from secondary recipients analysed at 20 weeks post transplant. Given the minimal CD45.2 donor repopulation in vector-transduced recipient mice (Figure 4.4D), the two vector-transduced mice together with the competitor CD45.1 subpopulations from the Ap2a2-transduced recipients were assessed together as the competitor CD45.1 population, and compared to the Ap2a2-transduced CD45.2 donor populations for respective LSK%. *p value = ) from another experiment with high Ap2a2-transduced HSC donor reconstitution were sacrificed at 16 weeks, and used as primary donors. Approximately 5x10 6 cells (without congenic helper cells) were transplanted into 4 secondary recipients per primary mouse (Figure 4.4A-B) that were analysed at 23 weeks post transplantation. Positive donor reconstitution in the majority of secondary recipients confirmed that Ap2a2-transduced HSCs exhibited prolonged in vivo activity within the primary mouse (Figure 4.4A). Secondary recipient bone marrow and thymic tissue gated on donor CD45.1 expressed markers for B, myeloid and T cell lineages suggesting donor cells retained lymphomyeloid differentiation capacity (data not shown). To assess for in vivo clonal composition, one primary donor from each independent well of Ap2a2-transduced cell population in Figure 4.3B, together with respective multiple secondary recipients were analysed for proviral integrations (Figure 4.4A-B as color coded). This showed at least two independent clones from each primary donor in multiple respective secondary recipients (Figure 4.4B) consistent with clonal in vivo symmetrical cell divisions. As clonal symmetrical HSC divisions may be expected to occur in the transplant setting, to quantify the in-vivo self-renewal of Ap2a2-transduced HSCs, we performed CRU assays in another batch of secondary recipients (Figure 4.4C-E). At 16 weeks post transplantation, the CRU frequency for the vector-transduced cohort was 1 in 402,807 cells as compared to 1 in 57,428 cells for the Ap2a2-transduced cohort of secondary recipient mice (Figure 4.4C and supplemental Figure 4.1A-C). Furthermore, for equivalent transplanted donor cell doses, Ap2a2-transduced HSCs provided significantly greater and incremental dose-dependent reconstitution in comparison to vector-transduced HSCs (Figure 4.4D). To correlate and quantify HSC numbers after in vivo self-renewal, ten of these secondary recipient mice (two vector-transduced and eight Ap2a2-transduced) were sacrificed at 20 weeks for analyses of donor CD45.2- versus competitor CD45.1-derived bone marrow LSK subpopulations (Figure 4.4E). The percentage of LSK cells in the Ap2a2-transduced CD45.2-derived population when normalised to an equivalent 200,000 CD45.1 competitor cell dose, showed a modest but statistically significant two-fold greater
159 133 increase in the Ap2a2-transduced CD45.2 donor-derived LSK population (Figure 4.4E). These secondary recipients reconstitution results show that Ap2a2-transduced HSCs have a modest quantitative in vivo self-renewal expansion, yet maintain potent HSC reconstitution activity (Figure 4.4C-E). These results are similar to the in vitro to in vivo transplantation assay results in primary recipients (Figure 4.3A-E) where the increased Ap2a2-transduced HSC reconstitution is also seen without a significant corresponding quantitative increase in HSCs. This suggests that the Ap2a2-induced enhanced HSC activity occurs mostly in vivo, both in primary and secondary recipients Effect of Ap2a2 shrna in HSCs We further investigated the role of Ap2a2 in HSC activity by studying the impact of shrnas that reduce Ap2a2 mrna levels by 50 to 90% within the context of our in vitro to in vivo reconstitution assay (supplemental Figure 4.2A-B). Results from these experiments suggest that Ap2a2 is dispensable for hematopoiesis. Homing efficiency as measured by percentage of donor CD45.2 transduced cells in the bone marrow of recipients at twenty-four hours post transplantation, and Annexin V apoptosis assays of respective transduced-hscs cultured for seven days in vitro revealed no significant differences between 3-, 4- and 5-shAp2a2-transduced as compared to shluciferase-transduced CD Lin - HSCs (data not shown). These Ap2a2 knockdown assay results together with the findings from our previous screen 20 of non-cell-autonomous activity for other positive regulators of HSC expansion during in vitro culture, led us to assess whether such activity was also aiding the in vivo effect of Ap2a2-transduced cells. Using non-viral-producing NIH 3T3 cells for transfection with Ap2a2, followed by subsequent HSC co-culture and transplantation, details as per Deneault et al. 20, we found no evidence for a non-cell-autonomous contribution (data not shown). Therefore, overexpression of Ap2a2-transduced HSCs results in enhanced HSC activity upon in vivo transplantation, whilst the knockdown of Ap2a2 in HSCs suggests Ap2a2 has a redundant role within the limits of the in vitro culture and transplantation assay Evaluation of Ap2a2-transduced HSCs We next assessed whether we could detect qualitative differences in Ap2a2-transduced HSCs by looking at Ap2a2 overexpression on proliferation, survival or differentiation of CD Lin - cells. The absolute cell count after in vitro culture of CD Lin - cells transduced with pkof, Ap2a2, HoxB4 and NA10HD (60% to 69% gene transfer) showed that the number of Ap2a2-transduced cells was not enhanced (Figure 4.5A). In
, pap2a2 (N=4), HoxB4 (N=4) and NA10HD (N=2). (B) Methylcellulose assays for in vitro proliferation and differentiation.")
160 134 Figure 4.5 Qualitative effects of Ap2a2-transduced HSCs. (A) Cell proliferation counts of respective GFP positive transduced cells, *p=0.03. Values presented are mean ± SEM from independent experiments for pkof (N=3), pap2a2 (N=4), HoxB4 (N=4) and NA10HD (N=2). (B) Methylcellulose assays for in vitro proliferation and differentiation. Values presented are mean ± SEM number of GFP positive colonies from 3 independent experiments. Statistical significance between vector and Ap2a2, for CFU-G (*p<0.001), CFU-GEMM (*p=0.02) and BFU-E (*p=0.002). (C) Cytospin morphology of respective GFP positive transduced cells. Ap2a2 (asterisk, clusters of undifferentiated blasts). (D) Mean ± SEM from 300 cell differential counts with respective GFP positive transduced cells from (N=x) independent experiments for Vector (N=5), pap2a2 (N=5) and NA10HD (N=2). Statistical significance between vector and Ap2a2 (*p=0.002) and NA10HD (*p=<0.0001). (E) Q-RT-PCR expressed as G0:Cycling ratio (mean ± SEM) from LT-HSC (CD49b - Rho low LSK) and IT-HSC (CD49b + Rho low LSK) populations paired for G0-quiescent and cycling from seven independent sorts. Both Ccnb1 (Cyclin B1) as part of the cell cycle network (6) and Gpsm2, involved in active mitotic spindle orientation (8-10) serve as effective internal controls given their (expected) relative higher expression during cycling (see also supplemental Figure 4.2C). vitro proliferation analyses with methylcellulose colony forming assays showed that Ap2a2-transduced HSC-progenitor cells were capable of producing the full spectrum of
161 135 differentiated colonies (Figure 4.5B) with no differences in colony size (data not shown). Differentiation arrest has been found to contribute to the prominent HSC expansion mediated by HoxB4 and NA10HD (Cellot et al., 2007). Ap2a2-transduced HSCs however show a limited differentiation arrest compared to NA10HD-transduced HSCs (Figure 4.5C-D corresponding blue bars). Other key cellular pathways assessed via in vitro analyses of LSK cells transduced with and without Ap2a2 for 5 days were: cell cycle by Hoescht/phospho-histone H3 and BrdU-pulse and chase for 24 hours; cell death by annexin V/propidium iodide; senescence by beta-galactosidase, and measurement of cell divisions using cell track violet for up to 10 days in culture. All of these assays showed no differences between Ap2a2-transduced versus vector-transduced cells (data not shown). Overall, in vitro Ap2a2 modestly inhibits primitive hematopoietic cell differentiation without altering apoptosis and the other key cellular processes involved in self-renewal. Another important property of the stem cell is the ability to remain quiescent until actively required. This concept has been highlighted within the hematopoietic system by the identification of a small population of multipotent, dormant LT-HSCs 26,27. To assess this in vivo, we assessed the cell cycle status from ten secondary recipients sacrificed at 20 weeks. The LSK subpopulations from the Ap2a2-transduced CD45.2 donor-derived and competitor CD45.1-derived subpopulations were stained with DAPI-Ki67 to assess in particular, the percentage of cells in G0. There was no difference in G0 or any other cell cycle parameters between the two cell subpopulations (data not shown). As the dormant LT-HSC population is both small and heterogenous, detection of a difference at the bulk population level would be difficult. To circumvent this, and further investigate the Ap2a2-quiescence link, from independent sorts we isolated batches of cells of the LT-HSC and multipotent intermediate-term HSC (IT-HSC) 28 populations whilst in quiescence and in cell cycle for Ap2a2 expression. This IT-HSC population, isolated in the CD49b hi Rhodamine low LSK fraction and separable from the classical shortterm repopulating HSC, generates multilineage clones that expand through to 8 weeks. Although the clones subsequently regress, lymphoid components remain detectable beyond 6 months. In contrast, the established LT-HSC (CD49b - Rhodamine low LSK) sustains multilineage reconstitution beyond 6 months and for the lifetime of the animal. Gene expression was measured on Affymetrix microarrays (full method as per Benveniste et al. 28 ). These results (supplemental Figure 4.2C) suggest that Ap2a2, and to a lesser degree, Numb are preferentially expressed in the quiescent versus cycling state of both the LT- and IT-HSC. To quantify these microarray results, we performed Q-RT-PCR on paired G0- quiescence and cycling LT-HSC and IT-HSC populations from seven independent mouse sorts (Figure 4.5E). These results confirmed the microarray findings, and in particular
 Adult CD150 + 48 LSK cell showing disparate AP2A2 and Numb vesicles. (B) Localization of endogenous AP2A2 and NUMB in CD 150+48- LSK HSCs.")
162 136 Figure 4.6 Endogenous AP2A2 localization in hematopoietic and leukemic cells. All subsequent cells stained for AP2A2 (Cy3-red), NUMB (Fitc-green) and nucleus (Dapi-blue). (A) Adult CD LSK cell showing disparate AP2A2 and Numb vesicles. (B) Localization of endogenous AP2A2 and NUMB in CD LSK HSCs. Definitions: Vesicles, if vesicles are clear and distinct (see Figure 4.6A); Clusters, if any vesicles are coalesced (see Figure 4.6C). Co-localized, if vesicles or clusters are yellow when merged (see Figure 4.6A,C). Total number of cells, N=75. Co-localization % for vesicles, n=39 cells; Co-localization % for clusters, n=36 cells. Values represent mean ± SEM from 2 independent experiments. (C) Adult CD LSK cells showing asymmetrical AP2A2 and NUMB clusters, that are (lower cell) or not (top cell) co-localized. (D) Comparison of AP2A2 distribution in adult HSC (N=120 from 3 independent experiments) versus E14.5 fetal liver HSC (N=127 from 2 independent experiments). Asymmetrical defined arbitrarily as distinctly more AP2A2 vesicles on one half of the HSC in any plane (eg. Figures 4.6A and 4.6E, symmetrical; Figures 4.6C and 4.6F, asymmetrical). Values represent mean ± SEM. (E) E14.5 fetal liver CD Sca + Mac1 + Lin - cells with symmetrical distribution. (F) E14.5 CD Sca + Mac1 + Lin - cell exhibiting
163 137 asymmetrical AP2A2 with symmetrical NUMB. (G) A representative fetal liver E14.5 CD Sca+Mac1+Lin- cell during mitosis, showing endogenous AP2A2 and NUMB as diffusely symmetric vesicles that are essentially not co-localized (N=7 cells in mitoses). (H) Still frames from live cell videomicroscopy of representative adult CD LSK cell, co-transduced with cherry-ap2a2 (Cherry-red) and venus-numb (Fitc-green) constructs showing the absence of co-localization during mitosis. Total of N=20 cells seen in mitoses. From 2 independent experiments, 17 out of 20 cells (85%) seen in mitoses showed absence of co-localization. (I) FLA2 leukemia cells stained for Ap2A2 and NUMB. (J) Adult CD LSK cells transduced with vector alone and (K) HoxB4, then stained for AP2A2, (see Supplemental Figure 4.2B). All confocal images acquired with inverted LSM 510 microscope (Carl Zeiss) using Planapochromat 63x/1.4 NA oil lens objective (Carl Zeiss) and analysed with Software LSM version 3.2 (Carl Zeiss). All scale bars = 10 µm. showed that Ap2a2 mrna expression was respectively, 4.5- and 7.5-fold increased in the LT- and IT-HSCs during quiescence as compared to the cycling state Disparate Ap2a2 and Numb localization in HSC In our screen, Ap2a2 was chosen as a candidate based on its association with the cell fate determinant, Numb. AP2A2 is the large alpha adaptin subunit of the adaptor-protein 2 (AP-2) heterotetrameric complex that is integral to clathrin-coated pits during endocytosis of transmembrane receptors 29,30. AP2A2 has been shown to bind NUMB in mammalian cells 31,32, and in the Drosophila sensory organ precursor system it is hypothesized that AP2A2 binding to NUMB allows the latter to be transported to the cell membrane for Notch receptor inhibition 32. Within these contexts, we investigated the relationship between AP2A2 and NUMB localization in purified hematopoietic cells. Initially, we analyzed adult CD LSK cells for endogenous localization of both proteins. Both AP2A2 and NUMB were localized in distinct vesicles (Figure 4.6A). But, surprisingly the majority of these respective vesicles were not co-localized (Figure 4.6A-B blue bars). Especially for AP2A2, individual vesicles appeared to coalesce as cytoplasmic clusters (Figure 4.6C). These AP2A2 and NUMB clusters more frequently co-localized (Figure 4.6B-C red bars). Whereas AP2A2 in adult HSCs was more often localized asymmetrically in cytoplasmic clusters; in embryonic day 14.5 (E14.5) fetal liver CD Sca + Mac1 + Lin - cells, AP2A2 and NUMB were more often distributed symmetrically at the cortical membrane (Figure 4.6D-E). In a smaller fraction of E14.5 fetal liver cells, AP2A2 was localized asymmetrically, and often when NUMB remained symmetrically distributed (Figure 4.6F). In both E14.5 fetal liver CD Sca + Mac1 + Lin - and adult CD LSK cells during mitoses, the asynchronous distribution of Ap2a2 and Numb vesicles persists (Figure 4.6G-H). Recent literature 18,33,34 has suggested that an underlying mechanism of mammalian
164 138 cancer cell expansion includes disruption of the balance between symmetric cell division (SCD) and ACD. We analyzed the distribution of AP2A2 and NUMB in two murine myeloid leukemia lines derived in our laboratory (FLA2 and FLB1) (Figure 4.6I). In both leukemias the symmetrical distribution patterns resembled that found in E14.5 fetal liver CD Sca + Mac1 + Lin - cells (compare Figure 4.6E to 4.6I). This may infer that leukemia cells and primitive hematopoietic cells during development are balanced towards SCD pathways that theoretically drive their expansion. Interestingly, when we transduced adult CD LSK cells with the expansion factors, HoxB4 or NA10HD, the AP2A2 distribution was altered from a predominantly asymmetrical to symmetrical pattern (Figure 4.6J-K and supplemental Figure 4.2D). This change in Ap2a2 protein distribution induced by HoxB4 is in contrast to the absence of change at the mrna level (Figure 4.1D), and suggests that a re-localization of fate determinant(s) may contribute to HoxB4- and NA10HD-induced HSC expansion Ap2a2 segregation during HSC mitosis Another important aspect of our investigations was to identify potential cell fate determinants that would clearly delineate an ACD, with the eventual aim of prospective isolation of daughter cells for further single progeny cell studies. Specifically for this purpose, we have generated 28 candidates (Figure 4.2A, and self-renewal/) fused in-frame with fluorescence proteins for live cell videomicroscopy. In investigating ACD, the overexpression of a polarity factor with possible loss of polarity could theoretically skew mitoses towards SCD and thereby, mask potential ACD mitoses. However, conversely and importantly, within this context any candidate actually seen to asymmetrically segregate at division could be argued to be utilizing stable intrinsic pathway(s) for ACD. Based on our screen and our complementary shrna screen 35 we initially videoscreened Ap2a2, Numb, and Par6a cherry-fusions. Of these candidates, only AP2A2 has shown clear asymmetric segregation at mitosis in purified HSCs, suggesting a possible specificity for Ap2a2 in ACD. During an ACD, cytoplasmic AP2A2 vesicles cluster asymmetrically during interphase and throughout mitosis before preferential segregation into only one daughter cell at division (Figure 4.7A-B and supplemental Videos 1, 2 and 3). The daughter cell with absent AP2A2 at division re-expresses AP2A2 at a variable time thereafter (Figure 4.7B, asterisk, time 4:42:52). In contrast, during hematopoietic SCD, AP2A2 vesicles are diffusely and equally distributed throughout the cytoplasm during interphase and mitosis (Figure 4.7C-D and supplemental Videos 4 and 5). These distinct and replicable differences in AP2A2 localization during mitoses allowed us to quantify hematopoietic cell division as either an ACD or SCD (Figure 4.7E,
 or ACD (48%) (Figure 4.")
165 139 blue bars), together with the percentage of successful mitoses (Figure 4.7E, red bars). This quantification suggests that Ap2a2-transduced HSCs under in vitro culture conditions during the initial cell divisions enter equally into either SCD (52%) or ACD (48%) (Figure 4.7E, blue bars D3-5), but only a small percentage of those entering ACD (7%) have a successful mitotic division (Figure 4.7E, red bar D3-5, Asymmetrical). Analyses Figure 4.7 Asymmetrical and symmetrical AP2A2 during mitosis. Still frames from live cell videomicroscopy. All cells, adult CD LSK: DNA (Fitc-green); AP2A2 (Cherry-red/orange). All time points referenced to onset of mitosis (time, 00:00:00 as hours:minutes:seconds). The mean total mitosis times for an ACD was 3:04:17 (N=6 visualized mitotic cells) and for SCD was 2:56:04 (N=32 visualized mitotic cells). The difference of which was not statistically significant. (A) Hematopietic cell showing AP2A2 asymmetrical clustering during and after cell division into daughter cells. (B) Hematopietic cell (on right) with AP2A2 polarized clustering and asymmetrical segregation into only one daughter cell (asterisk). Other daughter cell (non-asterisk) re-expresses small vesicles of AP2A2 from time, 3:58:04
166 140 onwards. (See also Supplemental Videos 1-3) (C) Hematopoietic cell with diffuse, symmetrical Ap2a2 distribution during and after mitosis with both daughter cells acquiring Ap2a2. (D) Hematopoietic cell with AP2A2 symmetrical in division. Telophase midbody concentration at time, 2:39:42. (See also Supplemental Videos 4-5). Videos were acquired with a DeltaVision video microscope fitted with a 37 Cenvironmental chamber (Applied Precision) using Olympus 60x/1.42 NA oil immersion lens and a Photometric CoolSnap HQ2 camera. Video analyses and still frames were performed with softworxexplorer software (Applied Precision). All scale bars = 10 µm. (E and F) Influence of different feeder layers (external environment) on AP2A2 localization during mitosis. Symmetrical and asymmetrical as defined by Figures (4.6E,I) and (4.6C,F), respectively. D3-5 and D7-12 refer to days post CD KLS cell transduction with Ap2a2. NIH 3T3 (i.e., GP+E-86) and OP9 are respective feeder layers. CK refers to cytokinesis seen i.e. a successful mitotic division. Failed M (mitosis)-apotosis was defined as cells seen to be in mitosis for longer than 4 hours as these cells would eventually abort mitosis to re-enter interphase or undergo apoptosis. Analyses based on accumulated total number of dividing cells seen in each time period. (E) D3-5 with NIH 3T3 layer, total cells=162 from 3 independent experiments; D7-12 with NIH 3T3 layer, total cells=128 from 2 independent experiments; and (F) D3-5 with OP9 layer, total cells=147 from 2 independent experiments. All values presented are mean ± SEM of respective experiment groups. at days 7-12 during the one week of in vitro culture show the majority of visualized HSCs entering mitoses have a symmetrical Ap2a2 distribution (Figure 4.7E, blue bars of D7-12, 86% versus 14%). However, the success rate of the Ap2a2-symmetrical mitoses is comparatively reduced (Figure 4.7E, compare red bars D3-5 (45%) to D7-12 (22%), Symmetrical). In contrast, even though the number of cells entering ACD at days 7-12 are reduced, the percentage of successful mitotic divisions seen in those that enter ACD is increased or at least, relatively maintained compared to initial analyses at D3-5 (Figure 4.7E, compare red bars D3-5 (7%) and D7-12 (27%), Asymmetrical). Although there are many variables to consider, these live cell videomicroscopy results suggest that during the one week of in vitro culture, even though the overall rate of successful hematopoietic cell mitotic divisions is not high, that ACD is relatively maintained in comparison to SCD. It has also recently been reported that external niche factors are able to influence the balance between ACD and SCD in hematopoietic precursors 18. With respect to the localization of AP2A2 we have confirmed this phenomenon. In contrast to when HSCs were cultured with a NIH 3T3 layer (i.e., GP+E-86 cells) as per Figure 4.7E (D3-5, blue bars), when cultured with OP9 feeder cells with a more HSC supportive environment(ueno et al., 2003) (Figure 4.7F), the distribution of initial Ap2a2-tracked HSC divisions (D3-5) favored SCD in a ratio almost identical to that seen during (D7-12) co-culture with the NIH 3T3 layer (compare blue bars of Figure 4.7E, D7-12 with blue bars of 4.7F). A possible interpretation of these results is that external (i.e. niche-related) factors can skew the balance of ACD and SCD towards more symmetrical divisions. In addition, the OP9 layer, presumably via extrinsic cues to the HSCs, increased the relative percentage of
167 141 symmetrical mitotic cells that successfully divided (as opposed to apoptosis) (compare red bars of Figure 4.7E D7-12 and 4.7F, Symmetrical). Yet, the relative number of successful asymmetric mitoses seen with OP9 culture again remained relatively stable (compare red bars of Figure 4.7E, F Asymmetrical). Whether this reflects successful ACD is programmed intrinsically into primitive hematopoietic cells is another potential interpretation awaiting investigation.
168 Discussion Clear supporting evidence for the presumption of ACD governing self renewal in the hematopoietic system has been lacking. In addressing this question, we have acquired materials that have and will continue to be, an important resource for our future studies in this field. In an established gain of function screen, we have identified the endocytic gene, Ap2a2 as a novel in vivo agonist of mouse LT-HSC activity. When overexpressed in populations enriched for LT-HSCs, AP2A2 clearly segregates asymmetrically during mitosis in a significant proportion of these cells. Within these contexts, we conclude that ACD is operational in primitive hematopoietic cells enriched for LT-HSCs. The findings of Ap2a2-transduced HSCs maintaining enhanced HSC activity after both in vitro cultured and secondary in vivo transplantation in the relative absence of increased HSC numbers suggests these transduced HSCs are either favoured or maintained for ACD as opposed to SCD. One possibility, given the heterogeneity within even the small population of LT-HSCs, may be that the subset of dormant LT-HSC is intrinsically restricted to ACD, thereby ensuring one daughter retains the dormant state whilst the non-dormant daughter HSC undergoes expansion SCDs. Thus, whilst Ap2a2-transduced LT-HSCs in vitro are maintained in quiescence, upon in vivo transplantation these Ap2a2- transduced dormant HSCs have a potent proliferative output. This phenomenom of clonal variability in proliferative and self-renewal capabilities within HSC populations has been previously reported 37. Interestingly, the dormant fraction was seen to be 20-30% of total LT-HSC population (Wilson et al., 2008), which is similar to the percentage of ACDs seen in our in vitro videomicrosocopy of Ap2a2-transduced HSCs. Our hypothesis of LT-HSC dormancy restricted to ACD is currently being addressed through post-mitotic single cell analyses. In a parallel study to also identify novel HSC regulators, we performed and published an RNAi screen on a large cohort our candidate polarity genes 35, which included three shrnas to Ap2a2. In the context of the current overexpression screen showing enhanced activity of Ap2a2-transduced HSCs, one might have expected impaired HSC repopulation with shrna to Ap2a2. To try to understand why this was not the case for the three shrnas to Ap2a2 in our RNAi screen ( the initial caveat was that confirmation of specific gene knockdown was only performed retrospectively with the hairpins that provided impaired or enhanced HSC repopulation at the primary screen level. Post-screen Q-RT-PCR to assess Ap2a2 mrna levels with the
169 143 1-, 2-, and 3-shAp2a2 hairpins was performed and showed the maximal Ap2a2 knockdown was only 50% with 3-shAp2a2. Although the use of 4-, and 5-shRNAs to Ap2a2 with greater knockdown also did not definitively show impairment of HSC reconstitution (supplemental Figure 4.2A-B), this has to be taken within the confines of our assay. For example, the RNAi screen identified Prkcz (also known as, atypical protein kinase Cζ (apkcζ)) as an enhancer of HSC activity, yet recent conditional apkcζ studies showed its dispensability in hematopoiesis. Given AP2A2 is part of the AP-2 heterotetrameric endocytic complex with potential for redundancy from partners in this complex, it might also require a conditional Ap2a2 knock-out to see a hematopoiesis-specific phenotype. In the setting of the crucial role of Ap2a2 in AP-2 clathrin-mediated endocytosis of transmembrane receptors, its overexpression in HSCs may either enhance or suppress the membrane expression of hematopoietic cytokine receptors known to be internalized via this endocytic pathway 38. For example, thrombopoietin (Tpo) signaling is an important mediator of HSC quiescence 39,40, and the Tpo receptor is internalized via AP-2 endocytosis 38. As receptor internalization into endosomes form platform hubs of signaling 41,42, Ap2a2-endosomes could involve the intersection of multiple signaling pathways such as, tyrosine kinases, TGFβ and G-coupled protein receptors. The in vitro effect of Ap2a2 overexpression on the HSC could then result in either a niche-sensitized or niche-resistant HSC, that upon in vivo transplantation with subsequent asymmetric Ap2a2 segregation would mediate differential composition or trafficking of signaling endosomes. In either case, Ap2a2-transduced HSCs seem to maintain a proliferative advantage. Alternatively, the Ap2a2 endocytosis link may also function independently from cell signaling, as other essential cellular functions that can determine cell fate such as cell cycle, apoptosis, and RNAi regulation have been documented within the endocytic trafficking network 41,43. The ability provided by observing asymmetrical Ap2a2 segregation during HSC division delivers a unique opportunity to further investigate some of these aforementioned mechanisms. Instinctively, the Ap2a2-Numb interaction would seem a key mechanism by which Ap2a2 might influence HSC activity given the role of Numb as an inhibitor of Notch signaling. However, the disparity in localization of AP2A2 and NUMB is suggestive of differing and distinct mechanistic pathways for these two proteins in hematopoietic cell fate decisions. In support of this is the absence of hematopoietic stem cell phenotypes in the Numb-Numblike conditional mutant mouse 44, and Notch-signaling mutant mice 45,46. Whether this phenomenon of AP2A2 and NUMB disparity is specific to primitive hematopoietic cells or occurs in other regenerative mammalian tissues remains to be explored. In addition, apkcζ and apkcλ, mammalian homologues of another classic invertebrate cell fate determinant, apkc has been found to be dispensable for mammalian
170 144 hematopoietic stem cell activity 47 suggesting further that ACD in mammalian HSC selfrenewal may involve as yet unidentified cell fate determinants. An important potential perspective relates to cancer, where apart from the possibility of tumors corrupting endosome signaling pathways for unrestrained growth 48, there is significant accumulation of data from the Drosophila system linking perturbation of polarity and ACD at the stem cell level to abnormal cell proliferation and cancer 33,49. Moreover, there is a growing list of regulators of endocytosis that are aberrantly expressed in both human solid tissue and subtypes of hematological cancers 48. Two studies have reported that the balance between asymmetrical versus symmetrical divisions can be altered by respectively, an oncogene (NUP98-HoxA9) in mammalian HSC 18 and by a tumor suppressor (p53) in breast cancer stem cells 34, with the implication that an underlying mechanism of both blood and solid tissue cancers may be a perturbation of ACD. The fact that our mouse leukemias exhibited a symmetrical pattern of Ap2a2 distribution potentially adds to these observations, and the thought that corruption of cell fate mechanisms by cancer stem cells may be a critical tool utilized in oncogenesis.
171 Acknowledgements The authors thank the following for technical assistance: A. Fournier and M. Frechette from the Sauvageau laboratory, D. Gagne from IRIC flow cytomery platform, R.Rossi, V. Milovac and S. Kotsakidis from Peter MacCallum flow cytometry platform, C. Charbonneau from IRIC imagery platform, P. Chagnon and R. Lambert from IRIC genomic platform. The MSCV-Ccne1 vector used in the screen was subcloned by D. Etemadmoghadam from D. Bowtell laboratory, Peter MacCallum Cancer Centre, Melbourne, VIC, Australia. The pcxibsr-venus-numb vector was a gift from D.Solecki, St. Jude Children s Research Hospital, Memphis, TN, USA. This work was supported by the Canadian Institute of Health Research (CIHR) Team Grant in Hematopoietic Stem Cell Self-Renewal: From Genes to Bedside (Grant number , ). S.B.T. is the recipient of National Health and Medical Research Council of Australia (NHM- RC), Royal Australian College of Physicians and CIHR Postdoctoral Fellowships, and received additional support from the Leukemia Foundation of Australia and Peter Mac- Callum Foundation Grant; E.D. is the recipient of a CIHR studentship; J.C. is the recipient of an American Society of Hematology Fellowship; K.H. is the recipient of a CIHR Postdoctoral Fellowship; S.C. is the recipient of a CIHR Clinician Scientist award; E.D.H is the recipient of an NHMRC Fellowship; S.M.R is supported by the NHMRC, Australian Research Council and Leukemia Foundation of Australia. N.N.I. received additional support from the Terry Fox Foundation, the National Cancer Institute of Canada, the Stem Cell Network and the McEwen Centre for Regenerative Medicine and, G.S. holds the Canada Research Chair on Molecular Genetics of Stem Cells.
172 Author Contributions S.B.T., E.D. and G.S. planned and performed the initial screen. All subsequent nonvideo experiments were performed by S.B.T., with significant contributions from E.D., J.C., N.M., K.H., S.C., M.H., and E.D.H. Videomicroscopy experiments were planned by S.B.T., J.D. and P.S.M and performed by S.B.T. J.P.L. constructed and maintains the IRIC self-renewal website. Experiments and data analyses from cycling-quiescent microarrays were performed by the laboratory of N.N.I. Significant intellectual input was provided by S.M.R. G.S. and S.B.T directed the research and S.B.T wrote the manuscript, which all authors have read and approved.
173 Disclosure of Conflicts of Interest The authors declare no competing financial interests.
174 References 1. Jan YN, Jan LY. Asymmetric cell division. Nature Apr 23;392(6678): Betschinger J, Knoblich JA. Dare to be different: asymmetric cell division in Drosophila, C. elegans and vertebrates. Curr Biol Aug 24;14(16):R Knoblich JA. Mechanisms of asymmetric stem cell division. Cell Feb 22;132(4): Zhou Y, Atkins JB, Rompani SB, et al. The mammalian Golgi regulates numb signaling in asymmetric cell division by releasing ACBD3 during mitosis. Cell Apr 6;129(1): Coumailleau F, Furthauer M, Knoblich JA, Gonzalez-Gaitan M. Directional Delta and Notch trafficking in Sara endosomes during asymmetric cell division. Nature Apr 23;458(7241): Chia W, Somers WG, Wang H. Drosophila neuroblast asymmetric divisions: cell cycle regulators, asymmetric protein localization, and tumorigenesis. J Cell Biol Jan 28;180(2): Zhong W. Timing cell-fate determination during asymmetric cell divisions. Curr Opin Neurobiol Oct;18(5): Bowman SK, Neumuller RA, Novatchkova M, Du Q, Knoblich JA. The Drosophila NuMA Homolog Mud regulates spindle orientation in asymmetric cell division. Dev Cell Jun;10(6): Izumi Y, Ohta N, Hisata K, Raabe T, Matsuzaki F. Drosophila Pins-binding protein Mud regulates spindle-polarity coupling and centrosome organization. Nat Cell Biol Jun;8(6): Siller KH, Cabernard C, Doe CQ. The NuMA-related Mud protein binds Pins
175 149 and regulates spindle orientation in Drosophila neuroblasts. Nat Cell Biol Jun;8(6): Suda J, Suda T, Ogawa M. Analysis of differentiation of mouse hemopoietic stem cells in culture by sequential replating of paired progenitors. Blood Aug;64(2): Giebel B, Zhang T, Beckmann J, et al. Primitive human hematopoietic cells give rise to differentially specified daughter cells upon their initial cell division. Blood Mar 1;107(5): Benveniste P, Cantin C, Hyam D, Iscove NN. Hematopoietic stem cells engraft in mice with absolute efficiency. Nat Immunol Jul;4(7): Ema H, Sudo K, Seita J, et al. Quantification of self-renewal capacity in single hematopoietic stem cells from normal and Lnk-deficient mice. Dev Cell Jun;8(6): Dykstra B, Kent D, Bowie M, et al. Long-term propagation of distinct hematopoietic differentiation programs in vivo. Cell Stem Cell Aug 16;1(2): Beckmann J, Scheitza S, Wernet P, Fischer JC, Giebel B. Asymmetric cell division within the human hematopoietic stem and progenitor cell compartment: identification of asymmetrically segregating proteins. Blood Jun 15;109(12): Chang JT, Palanivel VR, Kinjyo I, et al. Asymmetric T lymphocyte division in the initiation of adaptive immune responses. Science Mar 23;315(5819): Wu M, Kwon HY, Rattis F, et al. Imaging hematopoietic precursor division in real time. Cell Stem Cell Nov 15;1(5): Dykstra B, Ramunas J, Kent D, et al. High-resolution video monitoring of h e - matopoietic stem cells cultured in single-cell arrays identifies new features of self-renewal. Proc Natl Acad Sci U S A May 23;103(21): Deneault E, Cellot S, Faubert A, et al. A functional screen to identify novel effectors of hematopoietic stem cell activity. Cell Apr 17;137(2):
176 Faubert A, Lessard J, Sauvageau G. Are genetic determinants of asymmetric stem cell division active in hematopoietic stem cells? Oncogene Sep 20;23(43): Sauvageau G, Thorsteinsdottir U, Eaves CJ, et al. Overexpression of HOXB4 in hematopoietic cells causes the selective expansion of more primitive populations in vitro and in vivo. Genes Dev Jul 15;9(14): Ohta H, Sekulovic S, Bakovic S, et al. Near-maximal expansions of hematopoietic stem cells in culture using NUP98-HOX fusions. Exp Hematol May;35(5): Antonchuk J, Sauvageau G, Humphries RK. HOXB4-induced expansion of adult hematopoietic stem cells ex vivo. Cell Apr 5;109(1): Cellot S, Krosl J, Chagraoui J, Meloche S, Humphries RK, Sauvageau G. Sustained in vitro trigger of self-renewal divisions in Hoxb4hiPbx1(10) hematopoietic stem cells. Exp Hematol May;35(5): Wilson A, Laurenti E, Oser G, et al. Hematopoietic stem cells reversibly switch from dormancy to self-renewal during homeostasis and repair. Cell Dec 12;135(6): Foudi A, Hochedlinger K, Van Buren D, et al. Analysis of histone 2B-GFP retention eveals slowly cycling hematopoietic stem cells. Nat Biotechnol Jan;27(1): Benveniste P, Frelin C, Janmohamed S, et al. Intermediate-term hematopoietic stem cells with extended but time-limited reconstitution potential. Cell Stem Cell. Jan 8;6(1): Boehm M, Bonifacino JS. Adaptins: the final recount. Mol Biol Cell Oct;12(10): Rappoport JZ. Focusing on clathrin-mediated endocytosis. Biochem J Jun 15;412(3): Santolini E, Puri C, Salcini AE, et al. Numb is an endocytic protein. J Cell Biol.
177 Dec 11;151(6): Berdnik D, Torok T, Gonzalez-Gaitan M, Knoblich JA. The endocytic protein alpha-adaptin is required for numb-mediated asymmetric cell division in Drosophila. Dev Cell Aug;3(2): Hawkins ED, Russell SM. Upsides and downsides to polarity and asymmetric cell division in leukemia. Oncogene Nov 24;27(55): Cicalese A, Bonizzi G, Pasi CE, et al. The Tumor Suppressor p53 Regulates Polarity of Self-Renewing Divisions in Mammary Stem Cells. Cell Sep 18;138(6): Hope KJ, Cellot S, Ting SB, et al. An RNAi screen identifies Msi2 and Prox1 as having opposite roles in the regulation of hematopoietic stem cell activity. Cell Stem Cell Jul 2;7(1): Ueno H, Sakita-Ishikawa M, Morikawa Y, Nakano T, Kitamura T, Saito M. A stromal cell-derived membrane protein that supports hematopoietic stem cells. Nat Immunol May;4(5): McKenzie JL, Gan OI, Doedens M, Wang JC, Dick JE. Individual stem cells with highly variable proliferation and self-renewal properties comprise the human hematopoietic stem cell compartment. Nat Immunol Nov;7(11): Hitchcock IS, Chen MM, King JR, Kaushansky K. YRRL motifs in the cytoplasmic domain of the thrombopoietin receptor regulate receptor internalizationand degradation. Blood Sep 15;112(6): Qian H, Buza-Vidas N, Hyland CD, et al. Critical role of thrombopoietin in maintaining adult quiescent hematopoietic stem cells. Cell Stem Cell Dec 13;1(6): Yoshihara H, Arai F, Hosokawa K, et al. Thrombopoietin/MPL signaling regulates hematopoietic stem cell quiescence and interaction with the osteoblastic niche. Cell Stem Cell Dec 13;1(6): Sorkin A, von Zastrow M. Endocytosis and signalling: intertwining molecular networks. Nat Rev Mol Cell Biol Sep;10(9):
178 Gould GW, Lippincott-Schwartz J. New roles for endosomes: from vesicular carriers to multi-purpose platforms. Nat Rev Mol Cell Biol Apr;10(4): Lee YS, Pressman S, Andress AP, et al. Silencing by small RNAs is linked to endosomal trafficking. Nat Cell Biol Sep;11(9): Wilson A, Ardiet DL, Saner C, et al. Normal hemopoiesis and lymphopoiesis in the combined absence of numb and numblike. J Immunol Jun 1;178(11): Mancini SJ, Mantei N, Dumortier A, Suter U, MacDonald HR, Radtke F. Jagged1- dependent Notch signaling is dispensable for hematopoietic stem cell self-renewal and differentiation. Blood Mar 15;105(6): Maillard I, Koch U, Dumortier A, et al. Canonical notch signaling is dispensable for the maintenance of adult hematopoietic stem cells. Cell Stem Cell Apr 10;2(4): Sengupta A DA, Ishikawa E, Florian MC, Dunn SK, Ficker AM, Leitges M, Geiger H, Diaz-Meco M, Moscat J, Cancelas JA. Atypical protein kinase C (apkczeta and apkcdelta) is dispensable for mammalian hematopoietic stem cell activity and blood formation. Proc Natl Acad Sci U S A. 2011; June 14(108(24)): Lanzetti L, Di Fiore PP. Endocytosis and cancer: an insider network with dangerous liaisons. Traffic Dec;9(12): Coumailleau F, Gonzalez-Gaitan M. From endocytosis to tumors through asymmetric cell division of stem cells. Curr Opin Cell Biol Aug;(20):
179 Supplemental Figures and Tables B A C Figure S4.1. Self-renewal of Ap2a2-transduced HSCs in vivo. (A) CD45.1 recipient mice were transplanted with respectively, Vector- and Ap2a2-transduced CD Lin- HSCs from 3 independent cultures. At 20 weeks post-transplantation, three respective recipients from each arm were taken based on % donor CD45.2 reconstitution (as indicated). Bone marrow cells were flow cytometry sorted for CD45.2 donor cells, which were used as donor cells for CD45.1secondary recipient transplantation. (B) Secondary transplant CRU assay: % donor CD45.2 reconstitution for secondary transplant recipients at limiting cell doses (as graphed in Fig. 4.4D of main text). (C) Secondary transplant CRU assay data set (from Fig. S4.1B) as analyzed by WEHI ELDA software ( for respective groups. p value is highly significant. (As graphed in Fig. 4.4C of main text).
180 154 A B C D Figure S4.2. Effect of Ap2a2 shrna in HSCs. (A) Q-RT-PCR of shrnas to Ap2a2 as a %knockdown relative to shluciferase-transduced cell expression. (B) Donor CD45.2 reconstitution at 20 weeks post-transplant after respective HSC-transductions. Results: mean±sem from 2 independent cultures with total of 6 recipients per gene. (C) Microarray data. Mean±SEM ratios from two independent experiments of cdna generated from cells from both IT- and LT-HSC populations. Both in their original quiescent states and in the cycling states after culturing with Kit ligand, Flt3 ligand, IL-11 and IL-7 until at least 50% of the cells had undergone mitosis. Confirmation Q-PCR as per Fig. 4.5E of main text. (D) AP2A2 distribution after transduction with HSC expansion factors, Hoxb4 and NA10HD. CD LSK cells were transduced with MSCV (control), Hoxb4 and NA10HD for 3 days before staining for AP2A2 (see Fig. 4.6J K). Asymmetrical and symmetrical as defined in Fig. 4.6 legend of main text. The graph shows that after transduction with Hoxb4 or NA10HD, AP2A2 distribution becomes more symmetrical. N=total number of cells analysed. Values are mean±sem from 2 independent experiments.
181 155 Table S4.1 Candidates genes for expression profile. For each candidate gene, cdna accession, primersand corresponding universal probe library number (Roche Diagnostics, Applied Biosystems, Foster City, CA, USA) is shown. Note: CD48, used as internal control for hematopoietic stem versus progenitor cell purity. Universal Probe Gene Accession Forward Primer Reverse Primer Library # Akt1 NM_ TCGTGTGGCAGGATGTGTAT ACCTGGTGTCAGTCTCAGAGG 45 Anapc5 NM_ TGCCGCTTCGGTCACTAT GGCAATCCTAATTGCCTCCT 13 Ap2a2 NM_ CTGTCTCGCTAGCTGTCTCG CCTGAAGATCTGTTGATGCAGA 15 Apc NM_ GGAGTGGCAGAAAGCAACAC CCACACGTGTAGCTGGACTC 75 AurkA BC TTGCAGACTTCGGGTGGT TCCAGGGTGCCACACATT 2 AurkB NM_ CCCTACGGCTCAAAGACG AGCAAGCGCAGATGTCGT 12 AurkC NM_ GCCCTCACGCCTTTAGAGTT TGATGGTGAAATGCTTCCTG 103 Bicd1 NM_ AAGATCGGCAGCCCTAAAAT GTGAGCACTGTGGCGGTA 40 Bmp4 NM_ GAGGAGTTTCCATCACGAAGA GCTCTGCCGAGGAGATCA 89 Carm1 NM_ TTCAGTGAGCGGACAGAGG CTGCTGCTGGGATAGGTAGC 73 Ccnb1 NM_ TCTTCTCGAATCGGGGAAC GACCTTGGCCTTATTTTCTGC 25 CD48 NM_ CGAGTTGAA GATAACCCTGGA TCGACGCTTCAGTCTTATTGATT 97 Cdc42 NM_ GCTGTCAAGTATGTGGAGTGCT GGCTCTTCTTCGGTTCTGG 1 Cdcp1 NM_ CTCTTACCCCGAGGACTGTAGA AAACAGCAGCAGAGCTCCA 18 Cdk2 NM_ TGCATCTTTGCTGAAATGGT AGATCCGGAAGAGTTGGTCA 80 Clip1 NM_ AAGGAACGCTGAAAGTAGCAA CTGTCCTGCAGACCAGTGAG 1 Ctnna1 NM_ GGACCATCGCAGACCATT GCGATGCGCTGAAGGTAG 62 Ctnnb1 NM_ GCAGCAGCAGTTTGTGGA TGTGGAGAGCTCCAGTACACC 25 Dctn1 NM_ CCTCAACAAGGGCATCAAGT GGTGAACTTGATGTGGTCAGC 22 Dlg3 NM_ CCCCCTACTCGTTACTCTCCTAT GATCTTGCGGGGCTCTCT 102 Dll1 NM_ ACAGAGGGGAGAAGATGTGC CCCTGGCAGACAGATTGG 20 Dynlt1 NM_ GGAGATGCGTTAAAGATGGAA ACAATGCTGCTCACTTCATCA 82 Ect2 BC ACCTGGTGCTCTGCTTCACT CCAACGTCACCAATTTGACA 63 Egfr NM_ GCCACGCCAACTGTACCTAT GCCACACTTCACATCCTTGA 107 Gfi1 NM_ TCCGAGTTCGAGGACTTTTG GAGCGGCACAGTGACTTCT 7 Gnai2 NM_ TCAATGACTCAGCCGCTTAC GGGATGTAGTCACTCTGTGCAA 50 Gnb2 NM_ GGCAAAAATCTATGCCATGC TGATGAGCTTTCCGTCCTG 66 Gpsm2 NM_ CTGCAGCGGTTCCTTGTT GCAGCACTTCAGCAACATTT 92 Insc NM_ CTGGCCTCTATCTGCTGTGTAG AAGCACAGGATACCGTCCAC 78 Kif3a NM_ GGTGTTGTTGGGCTGCAT CGGCTTCTCCGACTTATTGA 49 Lgl1 NM_ GCGAGAAGCTTAAGCAGGAG ATTGGGGAAGCCATGCTC 97 Mapre3 NM_ TCAATTATACCAAGATTGAACAGCTC CCTTCCTCAAGTGAACACAGC 103 Mark1 NM_ GTTAGTGCTGAATCCCATAAAGC CAACATTCATCCATCGGTCTT 1 Msi1 NM_ GATGCCTTCATGCTGGGTAT CGTAGGTCGTGGCTTGGA 89 Msi2 NM_ CATACACCATGGATGCGTTC TGCCACAAAGTTGGGGTAG 89 Myh10 NM_ AATTGAGACGCTGGATCTGTG AACAGAAGGACCCAAAAGTAATTG 3 Myh11 NM_ CCGGAAAGACAGAGAACACAC TAGAAGCTGCTTTTCCAGCTC 76 Myo6 NM_ GAGGAAGCCGGAAGCACT GCACAGTATTCCAGGGATGG 83 Ncl NM_ CATGGTGAAGCTCGCAAA CACTATCCTCTTCCACCTCCTTT 63 Neurl NM_ GATGCTCTTCAGCCTGCAT GGTGAGCAGGGGAGAGATG 22 Notch1 NM_ ACTATCTCGGCGGCTTTTC GGCACTCGTTGATCTCCTCT 5 Numa1 NM_ GAAAGGCAGAGGTTCCAAGA TGTCAGCTTCTTACTTAGTTCTTCCA 34 Numb NM_ CAGTTGCAAGATGCCAAGAA TGGGGATGGAGCAGTGTT 92 Pard6a NM_ CCAACGATGACAGTTTGCAC GGCCACTCGAGTCACCTTC 81 Pard6b NM_ CCTGGACACAGAGCTGGAA TGATGGTACCGTCTTCCTCTAAG 93 Ppp2r1a NM_ GTGGGAGGGCCTGAGTATG CACTGTGGCCAGTGACTCAA 74 Prkci NM_ ACTGACTACGGCATGTGTAAGG CCGCAGAAAGTGCTGGTT 80 Prkcz NM_ TCATGTTTTCCCAAGCATCC CACGGCGGTAGATGGACT 45 Prom1 NM_ GCGATAGCATCAGACCAAGC TCTATCCACTGATGGGAGCTG 32 Prox1 NM_ TGGAGTCACCAGTACAGAAGAGC CGCAACTTCCAGGAATCTCT 9 Pten NM_ AGGCACAAGAGGCCCTAGAT CTGACTGGGAATTGTGACTCC 60 Ptpn1 NM_ CATCATGGAGAAAGGCTCGT CTCCTTTTCTTCTTGCTGTGG 104 Ptpn2 NM_ GGCTACGACGGCTCAGAA CATTTAGGTGTCTGTCAATCTTGG 84 Rab11Fip1 AK CATCCAACCCCAGCTTTG TGTTCATGGGCTTCACAGG 17 Rab11Fip3 BC GATCGCATGATGAGAAAGTCG TGCACTGTCTGTCACCTCGT 92 RacGap1 NM_ CAAGTGGACGTGGAGATCAAG TCAGCTGAATCTGTTGTTCCA 13 Scrb NM_ GAGGCCTTCGTCTGCAAG CCTCCACTCAAGGCAGACTC 63 Snai1 NM_ CTTGTGTCTGCACGACCTGT CAGGAGAATGGCTTCTCACC 71 Snai2 NM_ GATCTGTGGCAAGGCTTTCT ATTGCAGTGAGGGCAAGAGA 71 Spata2 NM_ AGAAGGAGTTCCGCAGCAT ACCTTAGAATGGCTCGGATG 67 Spin1 NM_ TGCTGGCTCCAAAGTGAAA GCACTCCTAGACCTGGTGTCA 19 Stat3 NM_ TGGCACCTTGGATTGAGAG CAACGTGGCATGTGACTCTT 71 Stau1 NM_ AAGCCAGCACTCAAATCAGAA CTTTCCTTCCGTCTCCTGGT 109 Stau2 NM_ TTCTTTCCTGTTGTGGCTGTT GGGGTTCATTCCTTGACCAT 83 Stx4a NM_ CCATGAGATCTTTACGTTCCTAGC TTCTTCTCGATGCGGTTGAT 10 Tmod1 NM_ CTGGTCGAGCTGAAAATCG TCTCCATTTCCACTTTGTTGC 21 Trim2 BC ACATCATTGTGGCTGACTGG ATGATCCACTCCCATCAAAAA 18 Trim3 NM_ GCCTTGTCTACATACCTTCTGTGA TTCTGGGAGGATGGATGTCT 47 Trim32 BC GTAGGACACGTTGGTCCTCTG GTTAACTGTCCGGGGCTTCT 64 Tuba1a NM_ CTGGAACCCACGGTCATC GTGGCCACGAGCATAGTTATT 88 Ywhab NM_ GCAGGACATCTGCAACGA CCTGGGTGGCATTGAGAAT 67
182 156 Table S4.2 Polarity overexpression screen summary. Data of candidate polarity genes overexpression screen, as depicted in Figure 4.2B. Day 0 refers to the time after the initial 5 days of haematopoietic cell transduction; % of Donor CD45.1 is the mean of 2 mice. Day 7 is the time followed by the subsequent 7 days of in vitro culture; % of Donor CD45.1 is the mean of 3 mice. #, refers to deceased recipient mice and inability for further analyses. Infection Rate Screening Experiment Screening Experiment Group based on % GFP ^ or Day 0 % Donor CD45.1 Day 7 % Donor CD45.1 GO terminology Construct % Cherry * 4 w 8 w 12 w 16 w 4 w 8 w 12 w 16 w Neg Controls ^pkof *MSCV Pos Controls ^HoxB *NA10HD All constructs with pkof backbone, unless asterixed* indicating MSCV backbone I Ccnb Ccne Mapre Spin II *Anapc Pard6b III *Msi Numb *RacGap Spata Tmod IV *Ctnnb Prox V *Ctnna Pard Pard6a Prkci VI Ap2a Cdc *Stx4A VII Myh Kif3a Neurl Tuba1a VIII Gnb Gpsm *Prkcz IX *Ect Gnai Egfr Mark X Snai Snai XI Bicd Stau Stau *Trim XII Dlg *Ppp2r1a Clip *Trim2 22 # # # # Trim XIV Kcnb
183 CHAPITRE 5 ARTICLE A Novel Osteoclastic Network Determines In Vitro Niche for Hematopoietic Stem Cells Soumis dans : Cell Stem Cell le 08 août 2012
184 158 5 A Novel Osteoclastic Network Determines Niche for Mouse Hematopoietic Stem Cells In Vitro Eric Deneault 1, Brian T. Wilhelm 1, Anne Bergeron 2, Sébastien Lemieux 1, Frédéric Barabé 2* and Guy Sauvageau 1,3* 1 Molecular Genetics of Stem Cells Laboratory, Institute of Research in Immunology and Cancer (IRIC), University of Montreal, Montreal, Quebec, Canada, H3C 3J7 2 Centre de recherche du CHUL, Université Laval, Quebec City, Quebec, Canada, G1V 4G2 and Hôpital de l Enfant-Jésus, Quebec City, Quebec, Canada, G1J 1Z4 3 Division of Hematology and Leukemia Cell Bank of Quebec (BCLQ), Maisonneuve- Rosemont Hospital, Montreal, Quebec, Canada, H1T 2M4 *Correspondence: Guy Sauvageau; phone: ; fax: and Frédéric Barabé; phone: ; fax:
185 Contribution des Co-Auteurs Le chapitre 5 représente en fait une suite du chapitre 3. Nous avons exploité le potentiel de certains gènes candidats à forcer l expansion des cellules souches hématopoïétiques de façon extrinsèque. Par le fait même, nous avons découvert un nouveau réseau de régulation transcriptionnelle ostéoclastique responsable de ce phénomène. Ma contribution à cet article est majeure (>95%). Le projet a été développé par Guy Sauvageau et moi-même. La majorité des manipulations et des analyses a été accomplie par moi-même. J ai écrit le manuscrit sous la supervision de Guy Sauvageau. Ma contribution en pourcentage aux différentes figures et tables de l article : Figure 5.1 : 100% Figure 5.2 : 100% Figure 5.3 : 100% Figure S5.1 : 100% Figure S5.2 : 100% Figure S5.3 : 100% Figure S5.4 : 100% Figure S5.5 : 50% Table S5.1 : 100% Table S5.2 : 100%
186 Summary The importance of extrinsic regulation of hematopoietic stem cell activity is increasingly acknowledged. Here we report the generation of a new niche system, which supports expansion of mouse hematopoietic stem cells in vitro. Characterization of this niche revealed a transcriptional regulatory network including four critical factors, namely FOS, SPI1, KLF10 and TFEC. Interestingly, these factors are essential for osteoclastogenesis, thus revealing an osteoclastic network that supports hematopoietic stem cell self-renewal.
187 Introduction Under steady state conditions, HSCs are responsible for the lifelong production of billions of differentiated blood cells (Sharma et al., 2006). This achievement depends on two major attributes, namely multipotency and self-renewal. Quiescent HSCs are physically connected to their niches, which include osteoblasts (Calvi et al., 2003; Zhang et al., 2003), endothelial cells (Kiel et al., 2005) and mesenchymal stem cells and derivatives (Chow et al., 2011; Mendez-Ferrer et al., 2010). Under the control of sympathetic nervous system, niche cells secrete factors that regulate HSC activity. Factors such as ANGPT1 (Arai et al., 2004), CXCL12 (Sugiyama et al., 2006), SPP1 (Stier et al., 2005) and THPO (Yoshihara et al., 2007) are now described. The in vivo microenvironment supporting HSC self-renewal has not been reproduced in culture conditions so far. As a consequence, it remains difficult to expand genetically unmanipulated HSCs in vitro. For example, a modest improvement in the reconstitution of immunodeficient mice is observed when human cord blood (CB) cells are cultured in the presence of ANGPTL5 and IGFBP2 (Zhang et al., 2008), or PTN (Himburg et al., 2010). Co-culture of human CD34 + CB cells with immobilized DLL1 improves activity of short-term but not long-term repopulating cells (Delaney et al., 2010). Amplification of SCID repopulating cells (SRCs) was recently reported with the small molecule StemRegenin1 (SR1), which is an antagonist to the aryl hydrocarbon receptor (AHR) (Boitano et al., 2010). Of interest, inhibition of this transcription factor has little impact on mouse HSC activity, raising the possibility that human specific function for this pathway are at play. HSC amplification obtained with SR1 treatment remains suboptimal since the majority of dividing cells does not self-renew but differentiates (Boitano et al., 2010). This indicates that additional network(s) regulating ex vivo HSC expansion remain to be identified. Towards this goal, we recently developed an in vitro/in vivo screening strategy, which revealed 18 nuclear factors that enhance HSC activity. In these experiments, mouse HSCs were kept for 12 days in mini-cultures that included viral producer cells for each tested factor (Deneault et al., 2009). Interestingly, 4 of the 18 hits identified in this initial screen operated through non-hsc autonomous (NHA) mechanisms, i.e., expanded HSCs were not infected with retrovirus. This suggested that the transfected viral producer cells produced molecules (membrane-bound or soluble) that promote expansion of HSCs included in these cultures. The transcriptional make up and potential convergence of signaling pathways in the newly engineered viral producer cells had not been examined in
188 162 our initial report. Moreover, we had not assessed if any of the other 14 agonists of HSC self-renewal also show NHA activity (at least in part) and if any of these factors are active on human HSCs. These questions are addressed herein and reveal a novel pathway that metamorphoses NIH 3T3 fibroblasts into a niche that supports HSC self-renewal ex vivo. We show that most of the newly identified factors converge to a network known for its function in osteoclasts.
189 Results Uncovering non-hsc autonomous activity for additional nuclear factors Our initial screen of 104 nuclear factors (Figure 5.1A) identified that 4 of them, i.e. FOS, SPI1, TFEC and HMGB1 show NHA activity on mouse HSCs (Deneault et al., 2009). We first examined whether the other most potent factors identified in this initial study also function through NHA effects. For this, we took advantage of our transductionfree system: freshly isolated CD150 + CD48 - Lin - HSCs were co-cultured with NIH 3T3 cells (hereafter called feeder cells ), which were previously engineered to overexpress each of our candidate genes separately (Figure 5.1B). In this system, HSCs do not overexpress candidate genes since feeder cells lack packaging function (Figure 5.1B). Sorted HSCs were maintained in cytokine-supplemented medium for 7 days on transfected feeder cells (Figure 5.1B). Results from these experiments confirmed the NHA function of FOS, TFEC and HMGB1 on HSC activity in vitro (Figure 5.1C). Interestingly, these studies showed that most tested genes, previously believed to function in cell autonomous manner (Deneault et al., 2009), do in fact operate non-hsc autonomously. Indeed, HSCs cultured on feeder cells overexpressing VPS72, SOX4, KLF10, SKI, PRDM16 or ERDR1 reconstituted peripheral blood at levels reaching 23 to 34%, while controls were at 6±2% (Figure 5.1C). Only 2 of the 11 factors, SMARCC1 and TRIM27, did not reach statistical significance for NHA activity, although there was a clear trend towards such a function for these candidates (Figure 5.1C). Together, these findings highlight the unsuspected bias of our initial screen to identify at least 9 transcription factors that function in non-cell autonomous manner to amplify HSC activity in vitro In vivo evaluation of HSC exposed to engineered feeder cells Contribution of HSCs co-cultured with engineered feeder cells (Figure 5.1B) to B-lymphoid (B220 + ) and myeloid (Gr1 + ) bone marrow (BM) chimerism was determined by FACS at 18 weeks after transplantation (Figure 5.1D). As expected, BM cellularity was comparable in all conditions but tissue chimerism was much higher in recipients of cells exposed to feeder cells transduced with each of the 9 NHA factors when compared to control (Figure 5.1D). In addition and in line with NHA effects, no significant skewing in
190 164 A B C GP+E86 = viruses 5'LTR ORF PGK GFP 3'LTR NIH 3T3 = NO virus 5'LTR ORF PGK GFP 3'LTR Culture-derived reconstitution (%CD45.1) vector FOS * * TFEC HMGB1 SMARCC1 VPS72 TRIM27 SOX4 Figure 5.1 Cocultures with feeder cells overexpressing selected genes increase HSC activity. (A) Schematic representation of the strategy used for HSCs infection in our previous screen (Deneault et al., 2009). The retroviral packaging cell line GP+E86 is exploited to produce viruses (in red) carrying our candidate genes individually and to infect HSCs. Both transduced HSCs and GP+E86 cells overexpress the candidate genes along with the Gfp reporter gene (in green). The overexpression of the candidate genes in the GP+E86 cells potentially upregulates the transcription of other factors (named Z, in blue), which in turn can promote non-hsc autonomous expansion of both infected and uninfected HSCs. LTR=long terminal repeats; ORF=open reading frame; PGK=phosphoglycerate kinase promoter. (B) Illustration of the transduction-free system used in these studies. NIH 3T3 cannot encapsidate any virus since they lack packaging function. However, putative upregulation of target factors Z (in blue) in response to overexpression of the candidate genes can drive the expansion of uninfected HSCs extrinsically. Sorted HSCs (n=1,500 CD150 + CD48 - Gr1 - B200 - Ter119 - ) are cocultured for 7 days with previously (4 days) transfected feeder cells, prior to being transplanted in syngenic animals along with 2x10 5 syngenic cells. LTR=long terminal repeats; ORF=open reading frame; PGK=phosphoglycerate kinase promoter. (C) Reconstitution levels of donorderived blood cells at 16 weeks post-transplantation in recipients of cells from individual wells as shown in B. The gray dotted line represents the reconstitution level observed with control vector and serves as a baseline reference value. Values are presented as mean±sem. Number of independent experiments (n) per candidate gene equals 3, except for control vector: n=4; FOS, TFEC and HMGB1: n=5 [n=3 merged with n=2 from (Deneault et al., 2009)]. A minimum of 9 mice per gene was evaluated; *=significant p values ( 0.05), which were established at the 16 week post-transplantation time point. Bars in gray represent genes already known for non-hsc autonomous activity (Deneault et al., 2009). (D) Evaluation of reconstitution levels (18 weeks post-injection) by culture-derived HSCs. Data is presented as proportion of CD cells in each compartment: CD150 + CD48 - KIT + Lin - SCA1 + cells (herein called HSCs) in the bone marrow (BM) (yellow); BM B220 + cells (blue); BM Gr1 + cells (red); total BM cells (green); total peripheral blood (PB) cells (charcoal). * * virus Z Z * * KLF10 Infected mhsc Uninfected mhsc Uninfected mhsc * * * SKI PRDM16 ERDR1 D 100 Culture-derived reconstitution (%CD45.1) vector VPS72 FOS SOX4 KLF10 SKI PRDM16 ERDR1 TFEC BM mhscs BM B220 + BM Gr1 + BM total PB total HMGB1 lymphoid or myeloid differentiation was observed for all genes tested (blue and red bars in Figure 5.1D). Moreover, BM HSC chimerism was much high for all test conditions (18
191 165 to 49%, yellow bars in Figure 5.1D) when compared to control (2.1±0.9%) Assessment of soluble versus cell-cell contact determinants One possible explanation for the observed NHA effects is the production of soluble molecules originating from engineered feeder cells. To test this possibility, we performed nanopore membrane transwell culture experiments (Figure S5.1A). Transwell cultures reduced HSC activity to about 30% of the level seen in contact cultures with control feeder cells (data not shown). This suggests that NIH 3T3 cells contribute to HSC maintenance in a contact-dependent manner. Moreover, transwell cultures clearly prevented TFEC and HMGB1 engineered feeder cells to non-cell autonomously enhance HSC activity above values determined for control cultures (Figure S5.1B). In contrast, KLF10 transduced feeder cells significantly enhanced HSC activity in transwell to levels similar to those observed in contact cultures (Figure S5.1B), suggesting that a soluble factor is at play. The situation with the other factors (i.e., FOS, VPS72, SOX4, SKI, PRDM16 and ERDR1) is ambiguous with levels of activity not reaching statistical significance with this sampling size (Figure S5.1B) Identification of NHA networks agonists of HSC activity We used 2 different approaches to identify NHA networks that lead to enhancement of HSC non-cell autonomous activity. Firstly, we analyzed, by Q-RT-PCR, cross-regulation among 11 candidate genes in feeder cells engineered to overexpress these genes separately. The results obtained in these experiments are depicted in Figure S5.2 as the average expression levels (dct values) and in Figure 5.2A as relative fold differences (RQ values). The diagonal red line on these heatmaps relates high transcript levels for all tested factors, except HMGB1, in engineered feeder cells with relative expression values ranging from 3.6-fold for SMARCC1 to 7.1x10 4 -fold for TFEC. Furthermore, we shed light on inter-regulation of NHA factors and on potential convergence of signaling pathways in the engineered feeder cells. As illustrated in Figure 5.2B, a major transcriptional regulatory network emerged from Q-RT-PCR analyses. In this network, the expression level of SPI1 is elevated by 40-fold following overexpression of PRDM16 (Figure 5.2B). SPI1 is in turn responsible for increased expression levels of both FOS and TFEC by 31-fold. In parallel, KLF10 increases the expression of TFEC by 15-fold. Hence, TFEC and FOS represent the ultimate downstream effectors in this network. Strikingly, most constituents of this network play critical roles in the regulation of osteoclasts, i.e., SPI1 (Tondravi et al., 1997), KLF10 (Cicek et al., 2011), FOS (Grigoriadis et al., 1994) and TFEC (Mansky et al., 2002). According to our expression results, PRDM16 is the most upstream factor of the osteoclastic network (Figure 5.2B).
192 166 A Sample PRDM16 TFEC FOS SPI1 SKI SMARCC1 KLF10 SOX4 VPS72 ERDR1 HMGB1 Target RQ PRDM16 TFEC FOS SPI1 SKI SMARCC1 KLF10 SOX4 VPS72 ERDR1 HMGB B feeder cell PRDM16 40x 31x SPI1 FOS osteoclastic network 31x KLF10 15x TFEC Figure 5.2 Identification of an osteoclastic network in engineered feeder cells. (A) Quantitative analysis of geneexpression levels in feeder cells singly overexpressing 11 candidate factors, determined by Q-RT-PCR. RNA was extracted from engineered feeder cells cultured for 7 days. Relative fold differences (RQ) were determined using control cells as reference calibrator for each candidate gene. Reactions were done in triplicate, and average values were calculated for three independent experiments. Maximum RQ values in the right panel is arbitrarily set at 15. Numeric values are available upon request. White squares in last column (HMGB1 target gene) refers to unavailable data. (B) Integrative diagram presenting mrna transcript upregulation by overexpression of a candidate gene (black arrows), as determined by Q-RT-PCR expression profiling in (A). One possible explanation for the observed NHA effect is the production of a soluble factor originating from the engineered feeder cells. This possibility was confirmed by the demonstration that feeder cells transduced with Spi1 express high levels of leukemia inhibitory factor (LIF) mrna and secrete large amount of this protein (Figure 5.3A-B). LIF was previously shown to support mouse HSC activity in vitro (Escary et al., 1993). The second approach used to reveal NHA networks that increase HSC activity included microarray expression analysis of the engineered feeder cells. Gene-expression profiles of single hit-engineered cells were compared to control cells in both NIH 3T3 and GP+E86 cells. We focused on a set of genes whose expression was upregulated more than 3-fold after transduction of Tfec (see orange and red dots in Figure 5.3C; Table S5.1), as this factor corresponds to the main downstream component of the osteoclastic network in our engineered feeder cells (see yellow in Figure 5.2B). A supplemental stringent round of sorting was based on gene-ontology terms: we focused only on factors known to be secreted, membrane-bound or localized in the extracellular region (Figure 5.3C on top; Table S5.1), which were considered as potential NHA factors. These experiments revealed a set of 13 membrane-bound and secreted/matrix factors (Figure 5.3C on top) whose expression were upregulated by the osteoclastic network. Among the newly identified membrane factors, we found LYPD5, GPR110 and BAALC (Table S5.1, 5 th column). Similarly, the soluble factors include AGT, IL1A, LCN2 and OLFM1 (extracellular space), which are secreted by osteoclasts in vivo (Table S5.1, 5 th column). Secreted/matrix factors also include MAMDC2 (extracellular matrix), PTGDS, and WFDC1 (extracellular
193 167 A LIF mrna (relative quantification) C vector FOS SKI KLF10 SPI1 TFEC PRDM16 SOX4 ERDR1 VPS72 TRIM27 SMARCC1 HMGB1 * SPI1 FOS TFEC secreted EC AGT IL1A LCN2 PTGDS OLFM1 WFDC1 MAMDC2 BAALC B LIF concentration (pg/ml) membrane GPR110 LYPD MRGPRX4 PROM2 RGS16 vector * + control 2- to 2.9-fold 3- to 4.9-fold >5-fold * SPI1 FOS TFEC Figure 5.3 Osteoclastic network is responsible for production of putative HSC growth factors. (A) Q-RT-PCR evaluation of leukemia inhibitory factor (LIF) mrna levels in transduced feeder cells. RQ (relative quantification) values are presented as mean±sd of LIF levels in test cells over controls (transduced with control pkof vector). N= 3 biological replicates with triplicate PCR reaction per replicate; b-actin was used as internal control; *=p (B) ELISA determination of LIF protein levels in conditioned supernatants harvested 7 days after transduction of NIH 3T3 cells by indicated genes. Values are presented as mean±sem. N= 6-12 biological replicates each tested twice by ELISA. Positive control represents recombinant LIF provided by manufacturer; *=p (C) Microarray expression analysis of engineered feeder cells singly overexpressing 12 candidate factors (y-axis). Target genes presented on the x-axis have met our selection criteria, i.e., mrna expression levels of more than 3-fold in TFEC-feeders compared to control, and factor normally secreted or found in the extracellular region or bound to the plasma membrane. yellow=2- to 2.9-fold; orange=3- to 4.9-fold; red=>5-fold. All experiments were performed in biological duplicates. region), most of which are expressed by other niche cells, e.g., osteoblasts (Table S5.1, 4 th and 5 th column). The correlation between osteoclastic genes (Figure 5.2B) and extrinsic regulation of HSC activity was further explored by determining the concentration of some identified proteins secreted in the culture media, using enzyme-linked immunosorbent assay (ELISA). We evaluated the concentration of AGT, IL1A and LCN2, which were increased several fold over control values for SPI1 and TFEC (Figure S5.3). However, when tested as recombinant proteins, none of these reagents significantly induced human HSC expansion ex vivo so far (Figure S5.4). This suggests that the NHA osteoclastic network operates through a combination of factors, which could not be characterized by our ap-
194 168 proach. Of importance, this osteoclastic network seems specific to mouse HSCs, since human CD34 + cord blood cells failed to expand when exposed to feeder cells engineered to overexpress each of the NHA factors, except for VPS72 (Figure S5.5).
195 Discussion In a previous report, we have identified four nuclear factors that increase HSC activity through non-cell autonomous mechanism(s), namely SPI1, FOS, TFEC and HMGB1 (Deneault et al., 2009). Now, we reveal six additional NHA factors, i.e., VPS72, SOX4, KLF10, SKI, PRDM16 and ERDR1. Several of these factors, namely SPI1, FOS, KLF10, TFEC and potentially PRDM16, are involved in a transcriptional regulatory network typically associated with osteoclastogenesis (Cicek et al., 2011; Grigoriadis et al., 1994; Mansky et al., 2002; Tondravi et al., 1997). These results highlight a converging NHA network that induce mouse HSC expansion and document a bias of our screen methodology towards such factors. So far, PRDM16 has not clearly been associated with osteoclastogenesis. However, previous work demonstrated that PRDM16 improves the transcriptional activity of peroxisome proliferator-activated receptor-gamma (PPARG) in hematopoietic progenitors (Avagyan et al., 2011). Moreover, PPARG represents a specific marker of osteoclast progenitors (Wei et al., 2011), raising the hypothesis that PRDM16 might also be an important component of osteoclasts regulators. Osteoclasts are responsible for the bone matrix resorption and release high levels of hydroxyapatite-bound calcium interacting with calcium-sensing receptors on HSCs, which are important to retain HSCs in close proximity to the endosteal surface (Adams et al., 2006). Osteoclasts are also directly involved in the mobilization of HSCs into the circulation through the cleavage of CXCL12 by cathepsin K (Kollet et al., 2006). Moreover, osteoclasts can maintain co-cultured leukemic cells in dormancy in vitro, possibly through the secretion of TGFB (Yokota et al., 2010). Inhibition of osteoclasts function using bisphosphonates, an antiresorptive agent that selectively induce apoptosis of osteoclasts, is responsible for a significant loss in HSC numbers in vivo (Lymperi et al., 2011). In this case, elimination of osteoclasts might lead to a reduction of the available space in the BM niche below the minimum required to maintain adequate HSC numbers. This phenomenon is commonly observed in osteopetrotic mice (Wiktor-Jedrzejczak et al., 1982). Furthermore, disruption of osteoclast function is responsible for a loss in osteoblast activity and niche formation, hence preventing colonization of the BM by HSCs (Mansour et al., 2012). The transcriptional activity of SPI1, FOS, KLF10 and TFEC is necessary for adequate osteoclast function (Cicek et al., 2011; Grigoriadis et al., 1994; Mansky et al., 2002; Tondravi et al., 1997). Many downstream factors involved in osteoclast activity are also activated by these transcription factors, including MITF, CTSK, NFATC1, TNFRSF11A
196 170 (RANK) and ACP5 (TRAP) (Table S5.2). Selected recombinant proteins, such as AGT, IL1A and LCN2, corresponding to those secreted by cells in which this osteoclastic network is active did not induce HSC expansion in vitro. This suggests that a more complex combination of secreted proteins might be necessary, potentially involving membrane-bound proteins as well. The specific activity of our NHA factors to mouse, by opposition to human, HSC highlights mouse vs human specific genes that determine HSC self-renewal. Indeed, previous work with HOXB4 indicates activity restricted to mouse -not human- HSC (Csaszar et al., 2012; Krosl et al., 2003a; Sauvageau et al., 1995), while the opposite activity was noted with the aryl hydrocarbon receptor antagonist SR1 (Boitano et al., 2010). Furthermore, HMGB1 is a non-histone chromatin protein that bends DNA and promotes assembly of transcription factors (Bonaldi et al., 2003). HMGB1 is also an inflammatory protein produced and secreted by innate immune cells in response to infection or injury (Gardella et al., 2002). The possibility that HMGB1 directly acts as the mediator between engineered feeder cells and extrinsic expansion of HSCs will need to be investigated in follow-up studies. Together, our results show that the osteoclastic network in the feeder cells is responsible for increasing HSC activity in culture. Future studies will determine the downstream mediators of this newly identified non-cell autonomous network that mediates expansion of mouse HSC.
197 Experimental Procedures Retroviral vectors Construction of vectors for all candidate genes was described previously (Deneault et al., 2009) Animals (C57Bl/6J-CD45.2 x C3H/HeJ) F1 recipient mice and (C57Bl/6J-CD45.1-Pep3b x C3H/ HeJ) F1 congenic donor mice were bred at a specific pathogen-free (SPF) animal facility at IRIC in Montreal. Bnx/NOD-SCID mice (reference , ) were bred at CHUL (Quebec City) and maintained in a sterile environment Hematopoietic cell culture, retroviral infection and transplantation NIH 3T3 cells were engineered as previously described for GP+E-86 (Krosl et al., 2003b) and seeded in a 96 well plate format, enabling overexpression of a single gene per well. See supplemental experimental procedures for details Flow cytometry assessment of donor-derived hematopoiesis The contribution of donor cells to peripheral blood reconstitution was determined at regular intervals following transplantation in individual recipients. See supplemental experimental procedures for details Microarray hybridization and analyses Microarray expression analysis was performed essentially as described in (Krosl et al., 2010). All experiments were performed in biological duplicates and all microarray data are available upon request. See supplemental experimental procedures for details Statistical analysis The significance of differences was determined by a two-tailed Student s t test.
198 Acknowledgments The authors thank Christian Charbonneau from IRIC imagery platform, Danièle Gagné from IRIC flow cytometry platform, and Dr. Pierre Chagnon and Raphaëlle Lambert from IRIC genomic platform for their expertise with quantitative RT-PCR. This work was supported by the Fonds de Recherche en Santé du Québec (FRSQ) grant Médecine transfusionnelle et hémovigilance. E.D. is recipient of a CIHR studentship award; B.T.W. is a recipient of a Cole Foundarion fellowship; F.B. is supported by Canadian Institute of Health Research (CIHR) clinician scientist and FRSQ awards; G.S. holds a Canada Research Chair on molecular genetics of stem cells
199 References Adams, G.B., Chabner, K.T., Alley, I.R., Olson, D.P., Szczepiorkowski, Z.M., Poznansky, M.C., Kos, C.H., Pollak, M.R., Brown, E.M., and Scadden, D.T. (2006). Stem cell engraftment at the endosteal niche is specified by the calcium-sensing receptor. Nature 439, Arai, F., Hirao, A., Ohmura, M., Sato, H., Matsuoka, S., Takubo, K., Ito, K., Koh, G.Y., and Suda, T. (2004). Tie2/angiopoietin-1 signaling regulates hematopoietic stem cell quiescence in the bone marrow niche. Cell 118, Avagyan, S., Aguilo, F., Kamezaki, K., and Snoeck, H.W. (2011). Quantitative trait mapping reveals a regulatory axis involving peroxisome proliferator-activated receptors, PRDM16, transforming growth factor-beta2 and FLT3 in hematopoiesis. Blood 118, Boitano, A.E., Wang, J., Romeo, R., Bouchez, L.C., Parker, A.E., Sutton, S.E., Walker, J.R., Flaveny, C.A., Perdew, G.H., Denison, M.S., et al. (2010). Aryl hydrocarbon receptor antagonists promote the expansion of human hematopoietic stem cells. Science 329, Bonaldi, T., Talamo, F., Scaffidi, P., Ferrera, D., Porto, A., Bachi, A., Rubartelli, A., Agresti, A., and Bianchi, M.E. (2003). Monocytic cells hyperacetylate chromatin protein HMGB1 to redirect it towards secretion. EMBO J 22, Calvi, L.M., Adams, G.B., Weibrecht, K.W., Weber, J.M., Olson, D.P., Knight, M.C., Martin, R.P., Schipani, E., Divieti, P., Bringhurst, F.R., et al. (2003). Osteoblastic cells regulate the haematopoietic stem cell niche. Nature 425, Chow, A., Lucas, D., Hidalgo, A., Mendez-Ferrer, S., Hashimoto, D., Scheiermann, C., Battista, M., Leboeuf, M., Prophete, C., van Rooijen, N., et al. (2011). Bone marrow CD169+ macrophages promote the retention of hematopoietic stem and progenitor cells in the mesenchymal stem cell niche. J Exp Med 208, Cicek, M., Vrabel, A., Sturchio, C., Pederson, L., Hawse, J.R., Subramaniam, M., Spels-
200 174 berg, T.C., and Oursler, M.J. (2011). TGF-beta inducible early gene 1 regulates osteoclast differentiation and survival by mediating the NFATc1, AKT, and MEK/ERK signaling pathways. PLoS One 6, e Csaszar, E., Kirouac, D.C., Yu, M., Wang, W., Qiao, W., Cooke, M.P., Boitano, A.E., Ito, C., and Zandstra, P.W. (2012). Rapid expansion of human hematopoietic stem cells by automated control of inhibitory feedback signaling. Cell Stem Cell 10, Delaney, C., Heimfeld, S., Brashem-Stein, C., Voorhies, H., Manger, R.L., and Bernstein, I.D. (2010). Notch-mediated expansion of human cord blood progenitor cells capable of rapid myeloid reconstitution. Nat Med 16, Deneault, E., Cellot, S., Faubert, A., Laverdure, J.P., Frechette, M., Chagraoui, J., Mayotte, N., Sauvageau, M., Ting, S.B., and Sauvageau, G. (2009). A functional screen to identify novel effectors of hematopoietic stem cell activity. Cell 137, Escary, J.L., Perreau, J., Dumenil, D., Ezine, S., and Brulet, P. (1993). Leukaemia inhibitory factor is necessary for maintenance of haematopoietic stem cells and thymocyte stimulation. Nature 363, Gardella, S., Andrei, C., Ferrera, D., Lotti, L.V., Torrisi, M.R., Bianchi, M.E., and Rubartelli, A. (2002). The nuclear protein HMGB1 is secreted by monocytes via a non-classical, vesicle-mediated secretory pathway. EMBO Rep 3, Grigoriadis, A.E., Wang, Z.Q., Cecchini, M.G., Hofstetter, W., Felix, R., Fleisch, H.A., and Wagner, E.F. (1994). c-fos: a key regulator of osteoclast-macrophage lineage determination and bone remodeling. Science 266, Himburg, H.A., Muramoto, G.G., Daher, P., Meadows, S.K., Russell, J.L., Doan, P., Chi, J.T., Salter, A.B., Lento, W.E., Reya, T., et al. (2010). Pleiotrophin regulates the expansion and regeneration of hematopoietic stem cells. Nat Med 16, Kiel, M.J., Yilmaz, O.H., Iwashita, T., Terhorst, C., and Morrison, S.J. (2005). SLAM family receptors distinguish hematopoietic stem and progenitor cells and reveal endothelial niches for stem cells. Cell 121, Kollet, O., Dar, A., Shivtiel, S., Kalinkovich, A., Lapid, K., Sztainberg, Y., Tesio, M., Samstein, R.M., Goichberg, P., Spiegel, A., et al. (2006). Osteoclasts degrade endosteal components and promote mobilization of hematopoietic progenitor cells. Nat Med 12,
201 Krosl, J., Austin, P., Beslu, N., Kroon, E., Humphries, R.K., and Sauvageau, G. (2003a). In vitro expansion of hematopoietic stem cells by recombinant TAT-HOXB4 protein. Nat Med 9, Krosl, J., Beslu, N., Mayotte, N., Humphries, R.K., and Sauvageau, G. (2003b). The competitive nature of HOXB4-transduced HSC is limited by PBX1: the generation of ultracompetitive stem cells retaining full differentiation potential. Immunity 18, Krosl, J., Mamo, A., Chagraoui, J., Wilhelm, B.T., Girard, S., Louis, I., Lessard, J., Perreault, C., and Sauvageau, G. (2010). A mutant allele of the Swi/Snf member BAF250a determines the pool size of fetal liver hemopoietic stem cell populations. Blood 116, Lymperi, S., Ersek, A., Ferraro, F., Dazzi, F., and Horwood, N.J. (2011). Inhibition of osteoclast function reduces hematopoietic stem cell numbers in vivo. Blood 117, Mansky, K.C., Sulzbacher, S., Purdom, G., Nelsen, L., Hume, D.A., Rehli, M., and Ostrowski, M.C. (2002). The microphthalmia transcription factor and the related helix-loophelix zipper factors TFE-3 and TFE-C collaborate to activate the tartrate-resistant acid phosphatase promoter. J Leukoc Biol 71, Mansour, A., Abou-Ezzi, G., Sitnicka, E., Jacobsen, S.E., Wakkach, A., and Blin-Wakkach, C. (2012). Osteoclasts promote the formation of hematopoietic stem cell niches in the bone marrow. J Exp Med 209, Mendez-Ferrer, S., Michurina, T.V., Ferraro, F., Mazloom, A.R., Macarthur, B.D., Lira, S.A., Scadden, D.T., Ma ayan, A., Enikolopov, G.N., and Frenette, P.S. (2010). Mesenchymal and haematopoietic stem cells form a unique bone marrow niche. Nature 466, Sauvageau, G., Thorsteinsdottir, U., Eaves, C.J., Lawrence, H.J., Largman, C., Lansdorp, P.M., and Humphries, R.K. (1995). Overexpression of HOXB4 in hematopoietic cells causes the selective expansion of more primitive populations in vitro and in vivo. Genes Dev 9, Sharma, S., Gurudutta, G.U., Satija, N.K., Pati, S., Afrin, F., Gupta, P., Verma, Y.K.,
202 176 Singh, V.K., and Tripathi, R.P. (2006). Stem cell c-kit and HOXB4 genes: critical roles and mechanisms in self-renewal, proliferation, and differentiation. Stem Cells Dev 15, Stier, S., Ko, Y., Forkert, R., Lutz, C., Neuhaus, T., Grunewald, E., Cheng, T., Dombkowski, D., Calvi, L.M., Rittling, S.R., et al. (2005). Osteopontin is a hematopoietic stem cell niche component that negatively regulates stem cell pool size. J Exp Med 201, Sugiyama, T., Kohara, H., Noda, M., and Nagasawa, T. (2006). Maintenance of the hematopoietic stem cell pool by CXCL12-CXCR4 chemokine signaling in bone marrow stromal cell niches. Immunity 25, Tondravi, M.M., McKercher, S.R., Anderson, K., Erdmann, J.M., Quiroz, M., Maki, R., and Teitelbaum, S.L. (1997). Osteopetrosis in mice lacking haematopoietic transcription factor PU.1. Nature 386, Wei, W., Zeve, D., Wang, X., Du, Y., Tang, W., Dechow, P.C., Graff, J.M., and Wan, Y. (2011). Osteoclast progenitors reside in the peroxisome proliferator-activated receptor gamma-expressing bone marrow cell population. Mol Cell Biol 31, Wiktor-Jedrzejczak, W.W., Ahmed, A., Szczylik, C., and Skelly, R.R. (1982). Hematological characterization of congenital osteopetrosis in op/op mouse. Possible mechanism for abnormal macrophage differentiation. J Exp Med 156, Yokota, A., Kimura, S., Tanaka, R., Takeuchi, M., Yao, H., Sakai, K., Nagao, R., Kuroda, J., Kamitsuji, Y., Kawata, E., et al. (2010). Osteoclasts are involved in the maintenance of dormant leukemic cells. Leuk Res 34, Yoshihara, H., Arai, F., Hosokawa, K., Hagiwara, T., Takubo, K., Nakamura, Y., Gomei, Y., Iwasaki, H., Matsuoka, S., Miyamoto, K., et al. (2007). Thrombopoietin/MPL signaling regulates hematopoietic stem cell quiescence and interaction with the osteoblastic niche. Cell Stem Cell 1, Zhang, C.C., Kaba, M., Iizuka, S., Huynh, H., and Lodish, H.F. (2008). Angiopoietin-like 5 and IGFBP2 stimulate ex vivo expansion of human cord blood hematopoietic stem cells as assayed by NOD/SCID transplantation. Blood 111, Zhang, J., Niu, C., Ye, L., Huang, H., He, X., Tong, W.G., Ross, J., Haug, J., Johnson, T.,
203 177 Feng, J.Q., et al. (2003). Identification of the haematopoietic stem cell niche and control of the niche size. Nature 425,
204 Supplemental Figures and Tables A B 90 * Uninfected mhscs Y Z Engineered NIH 3T3 FOS VPS72 SOX4 KLF10 SKI PRDM16 ERDR1 TFEC Transwell membrane HMGB vector Culture-derived reconstitution (%CD45.1) Figure S5.1 Cell-cell contact prevention reveals secreted factors. (A) Design of transwell culture experiments as per (Gupta et al., 1998). Y factors: membrane bound; Z factors: secreted in supernatant by feeder cells. (B) Proportion of 16-week donorderived peripheral blood cell reconstitution of mice transplanted with the output of individual well seeded with n=400 CD150 + CD48 - Gr1 - B200 - Ter119 - sorted cells harvested after 7 days of non-cell contact cultures described in A. Values indicate mean±sem. N=2-4 independent experiments with 4 biological replicates per experiment. *=p 0.05.
205 179 Sample PRDM16 TFEC FOS SPI1 SKI SMARCC1 KLF10 SOX4 VPS72 ERDR1 HMGB1 Target dct PRDM16 TFEC FOS SPI1 SKI SMARCC1 KLF10 SOX4 VPS72 ERDR1 HMGB Figure S5.2 Candidate factors are overexpressed in feeder cells. Quantitative analysis of geneexpression levels in feeder cells singly overexpressing 11 candidate genes, determined by Q-RT-PCR. RNA was extracted from engineered feeder cells cultured for 7 days. Average Ct values (representative of expression level) were determined with β-actin serving as endogenous control to normalize levels of target gene expression. Reactions were done in triplicate, and average values were calculated for three independent experiments. White squares in last column (HMGB1 target gene) refer to unavailable data.
206 180 A C Agt concentration (ng/ml) Lcn2 concentration (ng/ml) Agt vector SPI1 SMARCC1 FOS HMGB1 TFEC KLF10 SOX4 VPS72 ERDR1 PRDM16 SKI 160 Lcn2 vector SPI1 SMARCC1 FOS HMGB1 TFEC KLF10 SOX4 VPS72 ERDR1 PRDM16 SKI B Il1a concentration (ng/ml) Il1a vector SPI1 SMARCC1 FOS HMGB1 TFEC KLF10 SOX4 VPS72 ERDR1 PRDM16 SKI Figure 5.3 Osteoclastic network is responsible for production of putative HSC growth factors. (A) Q-RT-PCR evaluation of leukemia inhibitory factor (LIF) mrna levels in transduced feeder cells. RQ (relative quantification) values are presented as mean±sd of LIF levels in test cells over controls (transduced with control pkof vector). N= 3 biological replicates with triplicate PCR reaction per replicate; b-actin was used as internal control; *=p (B) ELISA determination of LIF protein levels in conditioned supernatants harvested 7 days after transduction of NIH 3T3 cells by indicated genes. Values are presented as mean±sem. N= 6-12 biological replicates each tested twice by ELISA. Positive control represents recombinant LIF provided by manufacturer; *=p (C) Microarray expression analysis of engineered feeder cells singly overexpressing 12 candidate factors (y-axis). Target genes presented on the x-axis have met our selection criteria, i.e., mrna expression levels of more than 3-fold in TFEC-feeders compared to control, and factor normally secreted or found in the extracellular region or bound to the plasma membrane. yellow=2- to 2.9-fold; orange=3- to 4.9-fold; red=>5-fold. All experiments were performed in biological duplicates.
207 181 Number of CD34 + CD45RA - cells buffer * SR1 AGT_3 ng/ml AGT_6 ng/ml AGT_12 ng/ml Figure S5.4 Expansion of human CD34 + CD45RA - cord blood cell numbers in vitro. AGT_24 ng/ml Human CD34 + cord blood cells were cultured for 10 days in the presence of several indicated concentrations of recombinant AGT, IL1A or LCN2. At the end of the culture period, CD34 + CD45RA - cell numbers were counted by FACS. Values are presented as mean±sd. Number of replicates equals 12 for buffer and SR1, and 8 for each concentration of tested recombinant proteins. SR1 (StemRegenin1) from (Boitano et al., 2010) was used as positive control. *=p 0.05 IL1A_10 ng/ml IL1A_50 ng/ml IL1A_200 ng/ml IL1A_1000 ng/ml LCN2_10 ng/ml LCN2_50 ng/ml LCN2_200 ng/ml LCN2_1000 ng/ml
208 182 A NIH 3T3 = NO virus 5'LTR ORF PGK GFP 3'LTR Z Uninfected human CD34 + CB cells Cs Bnx/NOD-SCID B % increase over control * -80 PRDM16 SMARCC1 TFEC ERDR1 FOS HMGB1 VPS72 SKI SOX4 KLF10 Figure S5.5 Amplification of human HSC activity in co-cultures with engineered feeder cells. Percentages of increase over control of the reconstitution levels observed by human bone marrow cells at 10 weeks post-transplantation in primary Bnx/NOD-SCID mice recipients of day 10 co-culture cells. Values are presented as mean±sem. Number of mice (n) per candidate gene is: 67 for control vector, 17 for PRDM16, 15 for SMARCC1, 13 for TFEC, 11 for ERDR1, 21 for FOS, 16 for HMGB1, 25 for VPS72, 13 for SKI, 16 for SOX4 and 12 for KLF10. Five independent experiments have been performed for VPS72; four for FOS; three for SKI, SOX4 and KLF10; and two for PRDM16, SMARCC1, TFEC, ERDR1 and HMGB1; *=p 0.05
209 183 Tableau S5.1 Description of genes that meet our selection criteria after analysis of microarray expression profiles in engineered feeder cells. mrna expression levels of more than 3-fold in TFEC-feeders compared to control, and factor normally bound to the plasma membrane or secreted or found in the extracellular region. The results are presented as the gene symbols (1 st column), the gene names (2 nd column), the gene Entrez identification numbers (3 rd column), the type of cells in which they are normally expressed (4 th column), the Gene Ontology terms used for selection (5 th column) and the name of the corresponding known receptors (6 th column). Symbol Name ENTREZ Expressed by Gene Ontology Receptor AGT angiotensinogen all tested tissues secreted AGTR IL1A interleukin 1 alpha all tested tissues secreted IL1R1 LCN2 lipocalin bone marrow secreted SLC22A17 PTGDS prostaglandin D2 synthase (brain) nervous system secreted/membrane PTGDR OLFM1 olfactomedin osteoclast/osteoblast/macrophage extracellular space WFDC1 WAP four-disulfide core domain umbilical cord extracellular region MAMDC2 MAM domain containing macrophage/osteoblast ec matrix/membrane BAALC brain and acute leukemia, cytoplasmic all tested tissues membrane GPR110 G protein-coupled receptor all tested tissues membrane LYPD5 Ly6/Plaur domain containing all tested tissues (very low) membrane MRGPRX4 MAS-related GPR, member A ? membrane PROM2 prominin prostate membrane RGS16 regulator of G-protein signaling osteoblast membrane
210 184 Tableau S5.2 Genes upregulated at least 2-fold (2 nd column) following overexpression of NHA factors (1 st column) in engineered feeder cells. O/E=overexpressed; Up=upregulated O/E factors SPI1 KLF10 FOS TFEC Up genes MITF CTSK NFAT1 TNFRSF11A NFATC1 ACP5 NFATC1
211 Supplemental Experimental Procedures Animals Animals were housed in ventilated cages and provided with sterilized food and acidified water under veterinary supervision. Experimental procedures were revised and approved by University of Montreal animal ethics committee (Comité de Déontologie de l Expérimentation sur les Animaux de l Université de Montréal) and by the local animal ethics committee (CPA-CHUL) Hematopoietic stem cell isolation BM cells harvested from C57Bl/6J-CD45.1-Pep3b mice were stained with allophycocyanin (APC)-conjugated primary antibodies recognizing differentiation specific cell surface markers [Gr-1, B220 and Ter119 (BioLegend, San Diego, CA)]. Cells were washed, pelleted, and stained with anti-apc magnetic MicroBeads according to manufacturer guidelines (Miltenyi Biotec Inc, Auburn, CA, Order no ). Depletion of the lineage positive cells was achieved using the AUTO-MACS magnetic cell separator system (Becton-Dickinson, San Jose, CA, USA). The lineage negative cell fraction was subsequently stained with fluorescein isothiocyanate (FITC)-conjugated anti-cd48 and phycoerythrin (PE)-conjugated anti-cd150 antibodies (BioLegend, San Diego, CA). This step was followed by purification of the PE-CD150 + /FITC-CD48 - /APC-Gr1 - /APC-B200 - / APC-Ter119 - stem cell enriched subpopulation by flow cytometry using the FACSAria cell sorter (Becton-Dickinson, San Jose, CA, USA). Human CD34 + cord blood cells were purchased from StemCell Technologies (Vancouver, BC, Canada) Hematopoietic cell culture, retroviral infection and transplantation Freshly sorted CD150 + CD48 - Gr1 - B200 - Ter119 - CD BM cells were plated at a density of 1,500 (co-culture experiments) or 400 (transwell experiments) cells per well, and co-cultured for 5 days on confluent and irradiated (2,100 cgy of 137 Cs gamma radiation) NIH 3T3 cells in the presence of Dulbecco s modified Eagle s medium (DMEM) supplemented with 15% fetal bovine serum (FBS), 10 ng/ml human interleukin-6 (IL-6), 6 ng/ ml murine interleukin-3 (IL-3), 100 ng/ml murine stem cell factor (SF), and 6 µg/ml polybrene, 10 µg/ml ciprofloxacin and 10-4 M β-mercaptoethanol. Upon this stimulation interval (day 0), contents from each well were harvested by trypsinization and the retrieved cell volume was partitioned between cell culture and transplantation requirements
212 186 (for co-culture experiments). For every candidate gene, one half of the cell suspension remained in culture for an additional 7 day period, at the end of which (day 7), 3 independent C57Bl/6J-CD45.2 recipient mice were sublethally irradiated (800 cgy of 137 Cs gamma radiation) and were transplanted with a graft equivalent to 1/8 of the original cell input, along with 2x10 5 whole BM competitor cells (CD ). For transwell experiments, cells were not harvested upon stimulation interval and were let in culture for an additional 7 day period, at the end of which (day 7), one C57Bl/6J-CD45.2 recipient mouse per well was sublethally irradiated (800 cgy of 137 Cs gamma radiation) and was transplanted with a graft equivalent to 4/5 of the original cell input, along with 4x10 5 whole BM competitor cells (CD ). For human experiments, 50,000 CD34 + cord blood cells were plated on confluent irradiated NIH 3T3 cells (previously transduced with gene of interest) in 12-well plates with 10% FCS, 10 ng/ml IL-6, 100 ng/ml FMS-like tyrosine kinase 3 ligand (Flt3L), 100 ng/ml SCF, 10 ng/ml Granulocyte-Colony Stimulating Factor (G-CSF) and 15 ng/ml thrombopoietin (TPO). Cells were co-cultured for 10 days with half media change every other day. At the end of co-culture, cells were harvested and counted. 1/5 of each well (starting equivalent of 10,000 CD34 + cells) was injected per mouse. Bnx NOD/ SCID mice were sub-lethally irradiated (200 cgy) and cells were injected intra-femorally. Mice were analyzed for human engraftment 10 weeks after transplantation Flow cytometry assessment of donor-derived hematopoiesis A 50 µl blood sample obtained from tail vein puncture was incubated with excess ammonium chloride (StemCell Technologies, Vancouver, BC, Canada) to favour lysis of erythrocytes. The washed cell pellet was then stained with a primary PE-conjugated antibody recognizing the CD (donor-derived) leucocyte cell surface marker (BioLegend, San Diego, CA), as described (see HSC isolation section above). Immunophenotype was determined by flow cytometry (BD LSR II flow cytometer, BD Biosciences, San Jose, CA, USA) and data analyzed using FlowJo software (Tree Star Inc., Ashland, OR, USA). Similarly, at 18 weeks post-transplantation, cells isolated from blood and BM were stained with a cocktail of antibodies directed against various cell surface markers [APC-conjugated anti-b220, APC-conjugated anti-gr-1, APC-conjugated anti-ter-119, FITC-conjugated anti-cd48, PE-conjugated anti-cd150, PE-Cy5-conjugated anti-sca-1 and PE-Cy7-conjugated anti-c-kit (BioLegend, San Diego, CA)] and analyzed by flow cytometry. In xeno-transplantation experiments, both femurs were collected and cells flushed out of the BM into single cell suspension. Human cell engraftment in the BM was defined by the proportion of human cells (the sum of glycophorin A + erythroid cells and CD45 + glycophorin A - human leukocytes) within the live gate by flow cytometry (FACS Calibur and FlowJo Software).
213 Q-RT-PCR expression studies After 3 days of retroviral infection, engineered NIH 3T3 cells were irradiated (2,100 cgy of 137 Cs gamma radiation) and cultured for an additional 4 days in the presence of Dulbecco s modified Eagle s medium (DMEM) supplemented with 15% fetal bovine serum (FBS), 10 ng/ml human interleukin-6 (IL-6), 6 ng/ml murine interleukin-3 (IL-3), 100 ng/ml murine stem cell factor (SF), and 6 µg/ml polybrene, 10 µg/ml ciprofloxacin. At the end of this culture period, engineered NIH 3T3 cells were directly collected in Trizol solution to isolate total RNA, according to the manufacturer s protocol (Invitrogen, Burlington, ON, Canada). Reverse transcription of total RNA was performed using the MMLV-reverse transcriptase (RT) and random hexamers according to manufacturer s guidelines (Invitrogen, Burlington, ON, Canada). Resulting cdnas were analysed using the ABI Gene Expression Assay in order to measure gene expression levels using primer and probe sets from Applied Biosystems (primer and probe sequences are available on request). Q-RT-PCR reactions were done on a high-throughput ABI 7900HT Fast Real-Time PCR System (Applied Biosystems). Briefly, from a given test sample, the Ct (threshold cycle) values for each gene were normalized to the endogenous control gene GAPDH or β-actin (Applied Biosystems; CT = Ct target - Ct endogenous ) and compared to the mean CT from control sample (calibrator) using the Ct method ( CT = Ct Sample - Ct Calibrator ). Q-RT-PCR cycling conditions were as follows: 2 minutes at 50 C and 10 minutes at 95 C, followed by 40 cycles of 15 seconds at 95 C and 1 minute at 59 C Microarray hybridization and analyses Briefly, 10 µg of total RNA was isolated from Trizol (Invitrogen, Burlington, ON, Canada) samples of either NIH 3T3 cells or GP+E86 cells 3-7 days after transfection with either empty vector or vectors overexpressing individual factors. RNA was reverse transcribed using SuperScript Double-Stranded cdna Synthesis Kit (Invitrogen, Burlington, ON, Canada) according to the manufacturer s instructions. 1 µg of purified cdna was labeled with either Cy5 or Cy3 labeled 9mers (TriLink BioTechnologies, San Diego, CA, USA) using 3-5 exo-klenow fragment (New England Biolabs, Unit 6 Pickering, ON, Canada). 6 µg of labelled cdnas from cells over-expressing factors was competitively hybridized with 6 µg of labelled cdna from cells transfected with an empty vector for the same time period. Hybridizations were performed using NimbleGen mouse microarrays _MM8_60mer_expr and hybridization kit as recommended by the manufacturer (Roche NimbleGen, Madison, WI, USA). Arrays were scanned at 5-µm resolution using a GenePix4000B scanner (Molecular Devices, Sunnyvale, CA, USA) and resulting images were analyzed using NimbleScan 2.5 extraction software (Roche NimbleGen, Madison, WI, USA). Gene expression data were subsequently processed using custom Perl scripts and Genespring7.3 (Agilent Technologies, Mississauga, ON, Canada).
214 Detection of secreted factors in culture media At the end of the culture period described in the section Q-RT-PCR expression studies of experimental procedures, supernatants from each culture of engineered NIH 3T3 cells were collected, passed through a 0.22 µm MILLEX GV filter (Millipore, Billerica, MA, USA), aliquoted and frozen at -20 C. Detection of secreted factors was performed on thawed samples using enzyme-linked immunosorbent assay (ELISA) kits for mouse leukemia inhibitory factor (LIF; R&DSystems, Minneapolis, MN, USA), mouse angiotensinogen (Ang; Immuno-Biological Laboratories, Takasaki-Shi, Gunma, Japan). Absorbance was measured at 450 nm using a microplate reader GENios plus (Tecan Group, Männedorf, Switzerland).
215 Supplemental References Bankers-Fulbright, J.L., Kalli, K.R., and McKean, D.J. (1996). Interleukin-1 signal transduction. Life Sci 59, Boitano, A.E., Wang, J., Romeo, R., Bouchez, L.C., Parker, A.E., Sutton, S.E., Walker, J.R., Flaveny, C.A., Perdew, G.H., Denison, M.S., et al. (2010). Aryl hydrocarbon receptor antagonists promote the expansion of human hematopoietic stem cells. Science 329, Constine, L.S., Harwell, S., Keng, P., Lee, F., Rubin, P., and Siemann, D. (1991). Interleukin 1 alpha stimulates hemopoiesis but not tumor cell proliferation and protects mice from lethal total body irradiation. Int J Radiat Oncol Biol Phys 20, de Revel, T., Becard, N., Sorg, T., Rousseau, S., Spano, J.P., Thiebot, H., Methali, M., Gras, G., Le Grand, R., and Dormont, D. (2002). Retroviral interleukin 1alpha gene transfer in bone marrow stromal cells in a primate model: induction of myelopoiesis stimulation. Br J Haematol 118, Fuchs, S., Frenzel, K., Xiao, H.D., Adams, J.W., Zhao, H., Keshelava, G., Teng, L., and Bernstein, K.E. (2004). Newly recognized physiologic and pathophysiologic actions of the angiotensin-converting enzyme. Curr Hypertens Rep 6, Gupta, P., Blazar, B.R., Gupta, K., and Verfaillie, C.M. (1998). Human CD34(+) bone marrow cells regulate stromal production of interleukin-6 and granulocyte colony-stimulating factor and increase the colony-stimulating activity of stroma. Blood 91, Jokubaitis, V.J., Sinka, L., Driessen, R., Whitty, G., Haylock, D.N., Bertoncello, I., Smith, I., Peault, B., Tavian, M., and Simmons, P.J. (2008). Angiotensin-converting enzyme (CD143) marks hematopoietic stem cells in human embryonic, fetal, and adult hematopoietic tissues. Blood 111, Miyamoto, K., Araki, K.Y., Naka, K., Arai, F., Takubo, K., Yamazaki, S., Matsuoka, S., Miyamoto, T., Ito, K., Ohmura, M., et al. (2007). Foxo3a is essential for maintenance of the hematopoietic stem cell pool. Cell Stem Cell 1,
216 190 Park, S., Guo, J., Kim, D., and Cheng, J.Q. (2009). Identification of 24p3 as a direct target of Foxo3a regulated by interleukin-3 through the phosphoinositide 3-kinase/Akt pathway. J Biol Chem 284, Rodgers, K.E., Xiong, S., Steer, R., and dizerega, G.S. (2000). Effect of angiotensin II on hematopoietic progenitor cell proliferation. Stem Cells 18, Schmidt-Ott, K.M., Mori, K., Li, J.Y., Kalandadze, A., Cohen, D.J., Devarajan, P., and Barasch, J. (2007). Dual action of neutrophil gelatinase-associated lipocalin. J Am Soc Nephrol 18,
217 CHAPITRE 6 DISCUSSION
218 192 6 Discussion Une des plus grandes découvertes médicales du 20 e siècle est la transplantation de HSCs. La greffe de HSCs peut permettre de reconstituer le système sanguin au complet d un receveur. Toutefois, des milliers de patients dans le monde attendent en vain ce type de greffe par manque de donneur compatible. Le sang de cordon ombilical humain représente une source alternative de HSCs, qui présentent un degré d incompatibilité moins élevé qu avec des HSCs adultes. Par contre, le nombre de cellules souches n est pas assez élevé dans la plupart des unités de sang de cordon pour se traduire en une greffe réussie. Ainsi, une expansion du nombre de cellules souches, avant la greffe, aurait un impact majeur sur le nombre de patients qui pourraient profiter de cette thérapie. Dans le but d en apprendre davantage sur les mécanismes moléculaires de l autorenouvellement des HSCs, j ai d abord effectué un criblage fonctionnel de gènes candidats pouvant potentiellement stimuler une expansion du nombre de HSCs murines in vitro. Ces travaux ont été présentés aux chapitres 3 et 4 ainsi qu à l annexe 1. Ils ont été conduits en collaboration avec différents laboratoires universitaires de recherche sur les cellules souches situés à Montréal, Toronto, Vancouver et Seattle (États-Unis). En fait, ce projet s inscrivait à l intérieur d une subvention d équipe octroyée par les Instituts de Recherche en Santé du Canada (IRSC). C est la première fois qu une collaboration de cette ampleur se déployait au Canada en matière de recherche sur les cellules souches. Parmi plus de sept cents candidats au total, j ai identifié 24 gènes positifs, dont 18 ont été présentés au chapitre 3, cinq au chapitre 4, et un en annexe 1. Ces 24 gènes sont naturellement exprimés à l intérieur des HSCs et peuvent être surexprimés pour forcer ces cellules à s auto-renouveler. Ce qui est d autant plus intéressant, c est que la plupart d entres eux exercent leur effet sur les HSCs de manière extrinsèque, c est-à-dire que l effet provient de la niche modifiée qui produit de nouveaux facteurs de croissance (chapitre 5). Ces découvertes ont permis d accélérer la mise au point de protocoles d expansion de HSCs ex vivo. Ensuite, il était important de démontrer que mes résultats sont transposables chez l humain. Pour l instant, au moins un (Vps72) des 24 gènes identifiés précédemment s avère également capable d accroître l activité des HSCs humaines de manière extrinsèque. Cette étape a été effectuée en étroite collaboration avec Dr Frédéric Barabé au Centre de Recherche du Centre Hospitalier de l Université Laval à Québec (chapitre 5). L identification de facteur(s) extrinsèque(s) responsable(s) de l expansion du nombre de
219 193 HSCs représente un potentiel considérable en médecine translationnelle puisqu ils permettent l expansion de HSCs non modifiées génétiquement. Pour l instant, les efforts que j ai entrepris pour identifier ces facteurs extrinsèques n ont pas livré les résultats escomptés. En fait, j ai identifié certaines protéines potentielles sécrétées par les cellules nourricières modifiées comme AGT, IL1A et LCN2. Toutefois, lorsque je les ai ajoutées aux cultures de HSCs sous forme de protéines recombinantes, aucune expansion significative n a été détectée. Il est possible qu une combinaison de ces protéines soient nécessaires pour l expansion du nombre de HSCs, et non seulement une à la fois. Cette possibilité reste à être testée. 6.1 Choix d un Débit de Criblage Gain-de-Fonction Modéré Depuis quelques années seulement, les criblages génétiques et chimiques à haut débit ont vu le jour grâce à de nouvelles technologies comme la robotisation et l assemblage de collections de plusieurs milliers de molécules d ARN interférant (ARNi) et de petites molécules chimiques. Il est maintenant possible de cribler plusieurs centaines de milliers de candidats quotidiennement. À l époque où j ai entrepris le démarrage du criblage présenté au chapitre 3, c està-dire en 2005, les collections d ARNi ou de petites molécules chimiques prêtes à utiliser n étaient pas encore facilement accessibles. De plus, mon but principal était d identifier des facteurs nucléaires qui augmentent l activité des HSCs murines comme Hoxb4, donc en surexpression. Il est alors devenu évident qu il pourrait être très utile de tailler de toute pièce un nouveau criblage, en surexpression d ADNc cette fois. Le protocole de transduction qui fonctionnait le mieux dans le laboratoire impliquait l utilisation de rétrovirus. Par contre, il n existait aucune collection d ADNc disponible dans des vecteurs rétroviraux. Cette lacune nécessitait donc le sous-clonage, dans des vecteurs rétroviraux adaptés à notre criblage, de chacun des ADNc que je voulais cribler. Cela rendait techniquement impossible le criblage du génome en entier. Je me suis alors tourné vers une liste de 689 facteurs nucléaires candidats qui avait été préalablement conçue par Amélie Faubert. Les gènes de cette liste étaient classés en ordre d importance potentielle, avec une cote de 1 (moins important) à 10 (plus important), suivant un algorithme qui tenait compte principalement de leur niveau d expression dans des cellules souches de différents systèmes. J ai alors décidé de sous-cloner les 139 candidats ayant la meilleure cote, correspondant à une cote de 6 à 10. Pour des raisons de disponibilité, de taille ou autre problème technique, 104 ADNc candidats sur 139 ont été correctement sous-clonés dans mes vecteurs rétroviraux. J ai également inclus une liste de 41 facteurs de division asymétrique, dont 32 ont été sous-clonés et criblés. Les résultats du criblage des facteurs de division asymétrique ont été présentés au chapitre 4.
220 194 Par ailleurs, la transduction de rétrovirus dans le laboratoire se fait habituellement dans des boîtes de Pétri individuelles de 10 cm de diamètre, un gène par boîte, dans 10 ml de milieu de culture. La densité optimale de cellules de moelle osseuse non enrichies requise pour une culture saine se situe aux environs de 8x10 5 à 2x10 6 cellules par ml. De plus, la moelle osseuse d une souris normale C57Bl/6J contient environ une LT-HSC sur 2x10 4 cellules totales. Donc, entre 400 et 1000 LT-HSCs sont mises en culture par boîte de Pétri. Cependant, le criblage simultané d une centaine de gènes nécessite l utilisation de plaques de culture multi-puits. Un puits d une plaque à 96 puits contient seulement 100 µl de milieu de culture. Par conséquent, seules 4 à 10 LT-HSCs sont mises en culture par puits dans une plaque à 96 puits. Cette quantité est insuffisante pour une reconstitution hématopoïétique efficace étant donné que seulement un huitième de chaque puits est finalement transplanté par souris. C est pourquoi il fallait enrichir la population en LT- HSCs. Pour ce faire, j ai choisi de trier par FACS la sous-population CD150 + CD48 - Lin - des cellules de moelle osseuse afin d obtenir une proportion d environ une LT-HSC sur 24 cellules. En déposant 1500 cellules CD150 + CD48 - Lin - par puits, j obtiens environ 8 LT-HSCs à être transplantées par souris. En compétition contre 20 LT-HSCs rivales, ces 8 LT-HSCs génèrent un niveau basal de reconstitution hématopoïétique d environ 13%. Ce niveau de reconstitution ferme, mais plutôt bas, laisse place à une expansion du nombre de LT-HSCs en culture, dépendamment du gène surexprimé. 6.2 Méthode de Détection du Criblage Le choix de la méthode utilisée pour détecter les candidats positifs lors d un criblage est crucial afin de créer le moins d ambiguïté possible quant aux résultats obtenus. Une bonne méthode permet d augmenter la spécificité du criblage et de réduire le taux de faux résultats positifs et négatifs générés. Le repérage des limites inférieure et supérieure de détection des hits permet aussi d apprécier le pouvoir du criblage. En général, plus le débit d un criblage est élevé, plus nous avons tendance à choisir une méthode de détection simple et rapide afin de sauver du temps. Cependant, la spécificité du criblage risque d être grandement affectée par ce choix. Par exemple, le marquage d un antigène à l aide d un anticorps couplé à un fluorochrome peut permettre de détecter très rapidement la présence de cellules exprimant l antigène en question. Toutefois, lorsque les HSCs sont isolées et mises en culture, elles font face à des conditions excessives de stress et de pression sélective qui peuvent modifier le spectre de marqueurs exprimés sur la surface cellulaire (Uchida et al., 2004). Ces changements de phénotype inopportuns peuvent survenir indépendamment du potentiel souche des HSCs et saboter la fiabilité de la méthode de détection. C est la raison pour laquelle j ai choisi une méthode de détection basée sur la fonction principale des HSCs, c est-à-dire la capacité
221 195 de reconstitution du système sanguin d une souris préalablement irradiée, au lieu d être basée sur le phénotype membranaire. 6.3 Améliorer la Spécificité du Criblage Lors de l analyse des données obtenues au moment du criblage primaire, j ai réalisé que la différence entre les niveaux de reconstitution des contrôles négatif (vecteur vide) et positif (HOXB4) était plutôt faible chez les souris transplantées immédiatement à la fin de la période d infection des HSCs, c est-à-dire à jour 0. Par contre, cette différence était substantiellement augmentée en laissant les HSCs en co-culture pour une période supplémentaire de 7 jours avant la transplantation. Je suppose qu une majorité des divisions cellulaires, forcées par une concentration élevée de cytokines, engendraient des cellules-filles différenciées en présence du vecteur contrôle. Un taux majoritaire de différenciation épuise la réserve de HSCs dans le temps et la rend moins compétitive pour reconstituer le système sanguin des souris receveuses. Par contre, la surexpression de HOXB4 bloque la différenciation lors de la majorité des divisions et cause ainsi une expansion de la taille de la réserve de HSCs, la rendant plus compétitive. En d autres termes, la co-culture additionnelle de 7 jours augmentait considérablement le rapport signal sur bruit, ou la spécificité du criblage. Pour cette raison, j ai décidé d effectuer le criblage avec les cellules récupérées à la fin de la période de co-culture de 7 jours. 6.4 Biais Insoupçonné vers l Identification de Facteurs Aug- mentant l Activité des HSCs de Manière Extrinsèque Parmi les candidats révélés positifs lors du criblage initial, au moins quatre stimulent l activité des HSCs de façon extrinsèque, c est-à-dire FOS, SPI1, TFEC et HMGB1. Cette constatation a pu être mise en lumière grâce à l établissement d un nouveau système de co-culture «sans transduction», impliquant cette fois la lignée cellulaire NIH 3T3, dépourvue de toute capacité d encapsidation de rétrovirus. L hypothèse était donc lancée quant à la possibilité que les autres hits aient également un effet extrinsèque sur l activité des HSCs. Surprise fut de constater qu au moins six facteurs additionnels parmi les hits du criblage initial, c est-à-dire VPS72, SOX4, KLF10, SKI, PRDM16 et ERDR1, opèrent aussi de manière extrinsèque, alors que je croyais que leur effet était intrinsèque aux HSCs. Cette découverte me fit réaliser que le criblage était sans doute biaisé en direction de l identification de facteurs qui agissent de manière extrinsèque sur l augmentation de l activité des HSCs, pour deux raisons : 1) le fait que les gènes candidats sont également surexprimés dans les cellules encapsidatrices (GP+E86) et potentiellement à l origine d une modification de leur environnement extérieur et 2) la possibilité que la surexpression d un gène candidat à l intérieur des HSCs soit à l origine de leur extinction
222 196 pour cause de surabondance néfaste. 6.5 Quantifier l Expansion Extrinsèque du Nombre de HSCs Le succès de la reconstitution d un système hématopoïétique à long terme dépend de deux facteurs importants : le nombre de HSCs transplantées et la persistance de leur potentiel de prolifération dans le temps. Avec le système de co-culture utilisé lors de mes expériences d expansion extrinsèque des HSCs (cellules nourricières transduites + HSCs), le nombre de HSCs transplantées dépend de la quantité de divisions symétriques d auto-renouvellement qui ont lieu durant la période de co-culture in vitro, donc avant la transplantation. La persistance du potentiel de prolifération implique que le gène candidat demeure continuellement surexprimé à l intérieur même des HSCs. Cependant, étant donné que mon système d expansion extrinsèque ne permet pas le transfert de gène aux HSCs à aucun moment, il semble improbable que seul le potentiel de prolifération in vivo soit affecté dans ce cas-ci. Par conséquent, je considère que l augmentation de la capacité de reconstitution des HSCs a été acquise exclusivement en présence des cellules nourricières transduites lors de la période de co-culture in vitro. Cette hypothèse implique une expansion nette du nombre de HSCs fonctionnelles in vitro. Dans ces conditions, le nombre de HSCs qui persistent dans les souris primaires ne peut pas être déterminé de manière précise en utilisant des méthodes classiques de dilution limite, qui requièrent des transplantations secondaires, puisque les HSCs ne sont plus en contact avec les cellules nourricières depuis une longue période de temps. En conséquence, ces HSCs ne seront vraisemblablement pas plus compétitives que les HSCs contrôles pour reconstituer le système sanguin des souris secondaires, sauf en cas de modification permanente et héritable de la chromatine acquise lors de la période de co-culture. 6.6 Divergence Inter-Espèces Des études sur la surexpression d HOXB4 ont permis de révéler une grande efficacité d expansion du nombre de HSCs murines (Antonchuk et al., 2002). En revanche, l efficacité d HOXB4 sur l expansion du nombre de HSCs est beaucoup moins prononcée chez l humain. Inversement, la petite molécule chimique SR1 promeut une importante expansion du nombre de HSCs chez l humain, mais pas chez la souris (Boitano et al., 2010). Ces divergences soulignent la possibilité qu il pourrait exister des différences substantielles entre la souris et l humain quant à la biologie des HSCs. Un autre exemple de différence entre les HSCs murines et humaines est l expression du marqueur de surface CD34. Cette protéine membranaire semble agir comme molécule d adhésion entre les HSCs et la niche. D une stabilité exemplaire lors de culture in vitro, CD34 est très utilisée comme marqueur de HSCs humaines en culture (Boitano
223 197 et al., 2010). Par contre, les LT-HSCs n expriment pas CD34 chez la souris (Figure 2.1). La raison de cette divergence inter-espèces demeure encore obscure aujourd hui. Il est possible qu une ou plusieurs autres molécules compensent pour la perte de CD34 au niveau de l activité des HSCs chez la souris. Dans le même ordre d idées, un seul des facteurs extrinsèques identifiés au chapitre 5 chez la souris, c est-à-dire VPS72, a également un effet sur l expansion du nombre de HSCs chez l humain. Ces résultats suggèrent qu il y a beaucoup plus de différence qu on peut penser entre la biologie des HSCs murines et humaines. 6.7 Co-Surexpression pour une Synergie d Expansion Tel que décrit au chapitre 1, il existe de nombreux exemples de coopération entre facteurs responsables de la reprogrammation du destin cellulaire : la co-surexpression de POU5F1, SOX2, MYC et KLF4 pour reprogrammer des fibroblastes adultes en cellules ips (Takahashi and Yamanaka, 2006), la co-surexpression de NEUROG3, PDX1 et MAFA pour convertir des cellules exocrines pancréatiques en cellules beta productrices d insuline (Zhou et al., 2008), ou encore la co-surexpression de ASCL1, POU3F2 et MYT1L pour reconfigurer des fibroblastes adultes en neurones fonctionnels (Vierbuchen et al., 2010). Ces exemples de collaboration soulèvent l hypothèse que certains des facteurs identifiés dans cette thèse pourraient interagir ensemble pour augmenter encore plus l activité des HSCs s ils étaient co-surexprimés. Dans cette optique, j ai effectué quelques tentatives de co-surexpression, quatre facteurs à la fois : SOX4, HNRPDL, AP2A2 et XBP1; TMOD1, TFEC, HOXA9 et KLF10; FOS, GPX3, SPI1 et SMARCC1; VPS72, ERDR1, TRIM27 et CNBP; HMGB1, PRDM16, HDAC1 et GPSM2; SOX4, KLF10, FOS et TRIM27; AP2A2, HOXA9, TFEC et CNBP; HNRPDL, TMOD1, GPX3 et ERDR1; XBP1, PRDM16, SPI1 et SMARCC1. Malheureusement, aucune augmentation significative de l activité des HSCs n a été conférée par ces différentes combinaisons, comparé aux facteurs en solo. Il est possible que la bonne combinaison de facteurs n ait pas encore été testée. Il se peut également que certains facteurs testés en combinaison agissent au sein de la même voie de signalisation, ou encore au sein de différentes voies de signalisation qui n ont pas d effet additif sur l activité des HSCs. 6.8 Intégration de Facteurs Déterminants en Différents Ré- seaux Les facteurs nucléaires FOS, SPI1, TFEC, KLF10 et possiblement PRDM16, jouent un rôle déterminant dans l ostéoclastogénèse, comme mentionné au chapitre 5 (Cicek et al., 2011; Grigoriadis et al., 1994; Mansky et al., 2002; Tondravi et al., 1997). Il est in-
224 198 téressant de constater que ces 5 facteurs augmentent tous de façon significative l activité des HSCs lorsqu ils sont surexprimés dans les cellules nourricières en co-culture. De plus, ils s imbriquent en un réseau de régulation transcriptionnelle ostéoclastique, qui semble être à l origine de la production de facteurs extrinsèques responsables de l augmentation de l activité des HSCs. Les autres facteurs extrinsèques identifiés ne semblent pas être impliqués dans ce réseau ostéoclastique. Néanmoins, une analyse profonde du profil d expression génétique de 41 lignées de cellules leucémiques humaines dans notre laboratoire a permis d associer au moins deux autres des facteurs que j ai identifiés à un nouveau réseau de régulation transcriptionnelle. En effet, l expression de SOX4 et de SMARCC1 corrèle de façon remarquable entre les différentes lignées de cellules leucémiques analysées, avec un coefficient de corrélation (r) de 0,77 (Figure 6.1A). De plus, l expression de SOX4 corrèle tout aussi bien avec celle de trois autres facteurs déterminants de l activité des HSCs, identifiés précédemment par d autres membres de notre laboratoire, c est-à-dire BMI1 (Lessard and Sauvageau, 2003) avec r=0,8, MSI2 (Hope et al., 2010) avec r=0,76 et KDM5B (Cellot Figure 6.1 A Identification d un SOX4 nouveau réseau B r=0,77 r=0,8 r=0,76 r=0,76 r=0,77 SMARCC1 r=0,73 r=0,68 r=0,69 BMI1 C Fold enrichment r=0,8 r=0,73 r=0,64 r=0,55 MSI2 r=0,76 r=0,68 r=0,64 r=0,84 r=0,76 r=0,69 r=0,55 r=0,84 KDM5B SOX4 conserved regions -10kb/+10kb 3,0 2,5 2,0 1,5 1,0 0,5 0 75% 85% 90% 95% de régulation transcriptionnelle SOX4. (A) Le profil d expression génétique de 41 lignées de cellules AML a été établi par séquençage d ARN de nouvelle génération. Le coefficient de corrélation (r) de l expression des gènes indiqués, dans les 41 lignées, est présenté dans chaque graphique. (B) Illustration du site consensus de liaison de SOX4 aux bases azotées de l ADN. (C) Analyse de l enrichissement (en axe des y) du site consensus SOX4, selon le pourcentage de fidélité de la séquence (en axe des x), dans la région ±10kb du site de départ de la transcription des 80 gènes dont l expression corrèle le plus avec celle de SOX4 dans les différentes lignées cellulaires AML. et coll., publication en cours de révision) avec r=0,76. D autre part, les 80 gènes dont
225 199 les niveaux d expression corrèlent le plus avec ceux de Sox4 dans les différentes lignées leucémiques présentent un enrichissement significatif de sites consensus SOX4 dans la région ±10kb du site d initiation de la transcription. En effet, le site consensus SOX4, illustré à la Figure 6.1B, se trouve de plus en plus enrichi à mesure qu on augmente la rigueur concernant la fidélité de la séquence (Figure 6.1C). Par exemple, les sites contenant 75% de la séquence consensus sont enrichis d environ 1,7 fois et les sites contenant 95% de la séquence consensus sont enrichis de près de 2,4 fois. Ces résultats suggèrent que SOX4 se trouve à la tête d un nouveau réseau de régulation transcriptionnelle impliquant au moins quatre facteurs déterminants de l activité des HSCs identifiés dans notre laboratoire. En outre, Sox4 a récemment été identifié comme une cible directe d HOXB4 (Lee et al., 2010). Par conséquent, il est possible qu HOXB4 se trouve en amont de ce nouveau réseau. Les autres facteurs identifiés dans cette thèse n ont pu être associés à aucun réseau de régulation jusqu à maintenant. Cependant, HMGB1 représente un cas particulier. Bien qu elle soit une protéine nucléaire qui se lie à l ADN et facilite l assemblage de facteurs de transcription (Bonaldi et al., 2003), HMGB1 est également une protéine associée à l inflammation qui est sécrétée par des cellules immunitaires en réponse à une infection ou à une lésion (Gardella et al., 2002). Il est donc possible que HMGB1 soit sécrétée par les cellules nourricières modifiées dans mon système de co-culture et qu elle agisse directement comme facteur extrinsèque d expansion du nombre de HSCs. Cette hypothèse sera à confirmer dans des expériences futures. 6.9 GPX3 La glutathion peroxydase 3 (GPX3) est une enzyme plasmatique de lutte contre le stress oxydatif qui, si trop intense, affecte le potentiel d auto-renouvellement des HSCs (Shao et al., 2011). L analyse du profil d expression de deux leucémies générées dans notre laboratoire a révélé une plus grande expression de GPX3 dans la lignée FLA2, qui a une fréquence en cellules souches leucémiques (LSCs) de 1 sur 1,4, comparé à la lignée FLB1, qui a une fréquence en LSCs de 1 sur 347 (Wilhelm et al., 2011). C est la raison pour laquelle j ai décidé d inclure GPX3 dans la liste de facteurs candidats pour le criblage présenté au chapitre 3. De toute évidence, la surexpression de GPX3 stimule l activité des HSCs, alors que sa sous-expression diminue l activité des HSCs. De plus, la surexpression de PRDM16 ou de HOXB4, deux facteurs positifs lors du criblage, augmente l expression de GPX3 dans les HSCs. Bref, tous ces résultats sont présentés à l annexe 1 de la présente thèse sous forme d article scientifique publié.
226 Facteurs Sécrétés par le Réseau Ostéoclastique L analyse de la relation entre les facteurs ostéoclastiques présentés au chapitre 5 et la régulation extrinsèque de l activité des HSCs a conduit à l identification de quelques protéines sécrétées par les cellules nourricières modifiées, par exemple AGT, IL1A et LCN2. J ai ensuite approfondi cette analyse en déterminant la concentration réelle de ces protéines sécrétées dans les milieux de culture, par la méthode d ELISA. AGT est membre du système rénine-angiotensine (RAS) qui inclut AGT, AGT I et AGT II. AGT I est obtenu suite au clivage d AGT par la rénine, et AGT II est obtenu sur au clivage d AGT I par ACE. AGT II est un vasoconstricteur et un mitogène qui favorise la prolifération des cellules progénitrices hématopoïétiques par l intermédiaire de son récepteur AGTR1 (Rodgers et al., 2000). Toutefois, aucun rôle dans le système hématopoïétique n a été signalé à ce jour ni pour AGT ni pour AGT I. Avec la possibilité qu une Agt concentration (ng/ml) Agt I concentration (ng/ml) 20 Agt Agt I Agt II vector Sfpi1 Smarcc1 Fos Hmgb1 Tfec Klf10 Sox4 Vps72 Erdr1 Prdm16 Ski vector Sfpi1 Smarcc1 Fos Hmgb1 Tfec Klf10 Sox4 Vps72 Erdr1 Prdm16 Ski vector Sfpi1 Smarcc1 Fos Hmgb1 Tfec Klf10 Sox4 Vps72 Erdr1 Prdm16 Ski Figure 6.2 Évaluation de la présence de membres du système rénine-angiotensine dans les milieux conditionnés. La concentration des protéines AGT (panneau gauche), AGT I (panneau central) et AGT II (panneau droit) dans les milieux conditionnés par la surexpression des facteurs NHA dans les cellules nourricières a été déterminée par ELISA. Les valeurs sont présentées en tant que moyenne±sem. Le nombre de cultures indépendantes (n), testées en duplicatas, par gène égal 3, sauf pour FOS, HMGB1, KLF10 and SKI: n=2; SMARCC1, SOX4, VPS72, ERDR1 and PRDM16: n=1. Agt II concentration (ng/ml) ou plusieurs des protéines AGT, AGT I et AGT II agissent sur l activité des HSCs, j ai déterminé la concentration de chacune de ces protéines dans les milieux de culture conditionnés par les cellules nourricières modifiées. Comme démontré à la Figure 6.2, AGT est la seule protéine détectée à des niveaux élevés suite à la surexpression de TFEC, c està-dire à 40 ng/ml, comparé à ceux obtenus avec le vecteur contrôle. Aucune élévation des niveaux d AGT I (Figure 6.2, panneau du milieu) ou d AGT II (Figure 6.2, panneau de droite) n a été détectée dans les milieux conditionnés. À partir de ces observations, je spécule que la rénine n est pas présente ou active dans les milieux de culture et que l AGT pourrait avoir un effet positif sur l activité des HSCs murines in vitro. Certains récepteurs des protéines sécrétées sont normalement exprimés à la surface
227 201 des HSCs in vivo. Par exemple, IL1A peut se lier à son récepteur IL1R1, qui est exprimé par les HSCs (Orelio et al., 2009). D autres récepteurs sont aussi exprimés par différents types cellulaires. Par exemple, AGT se lie à son récepteur spécifique AGTR, qui est exprimé à la surface des cellules placentaires et des cellules épithéliales du tubule proximal rénal (Pan et al., 2006). En outre, PTGDR est le récepteur de PTGDS et est exprimé par les cellules épithéliales des bronches (Chiba et al., 2007). Par ailleurs, LCN2 se lie à son récepteur SLC22A17, qui est notamment exprimé dans le système nerveux (Miyamoto et al., 2011). Toutefois, l ajout de protéines recombinantes AGT, IL1A ou LCN2 directement au milieu de culture n a pas contribué à stimuler l activité des HSCs humaines, selon les conditions utilisées jusqu à maintenant. Plusieurs possibilités peuvent être à l origine de cette constatation. Par exemple, il est possible que ces protéines soient effectives seulement chez la souris. Il se peut aussi que les concentrations des protéines recombinantes testées jusqu à maintenant ne soient pas appropriées. Une combinaison de ces protéines pourrait également être nécessaire pour stimuler l activité des HSCs. De plus, la stabilité des protéines recombinantes dans le milieu de culture représente potentiellement un facteur limitant. En fin de compte, tous les facteurs produits par le réseau ostéoclastique et qui se retrouvent à l extérieur des cellules nourricières sont considérés comme des agonistes potentiels de l auto-renouvellement des HSCs. De nouvelles expérimentations seront nécessaires pour déterminer le véritable impact de chacun d entre eux sur l expansion du nombre de HSCs in vitro à des fins thérapeutiques.
228 Conclusion, Impact et Perspective En conclusion, les 24 nouveaux facteurs identifiés dans cette thèse stimulent l activité des HSCs murines in vitro. Plusieurs de ces facteurs interagissent ensemble dans différents réseaux et s ajoutent à la liste de facteurs déterminants connus jusqu à maintenant, démontrant l impact de cette thèse sur le tableau global de la régulation de l activité des HSCs (Figure 6.3). Pour apprécier le véritable impact de chacun de ces facteurs sur l expansion du nombre de cellules souches, il sera nécessaire éventuellement de déterminer la fréquence des cellules souches à différents moments lors de la culture in vitro. Réseau Osteoclastique PRDM16 HOXB4 SOX4 MSI2 Figure 6.3 Casse-tête dont les pièces représentent les facteurs déterminants de l activité des HSCs. Les 24 facteurs stimulant l activité des HSCs, identifiés dans cette thèse, en plus de trois autres facteurs préalablement identifiés dans le laboratoire, c est-à-dire HOXB4, MSI2 et KDM5B (en bleu, jaune, rouge et vert), s intègrent dans le réseau global de régulation de l auto-renouvellement des HSCs (panneau droit). En fait, ils viennent rejoindre les facteurs déterminants déjà connus (en gris foncé) et tous ceux qui ne sont pas encore identifiés (n=?; gris pâle). KLF10 SPI1 Réseau HOXB4 SMARCC1 KDM5B AHR IL6 FOS TFEC ID1 THPO GPX3 MYC SCF VPS72 HMGB1 Aucun Réseau Associé TRIM27 ZFP472 STAT Notch SKI CNBP BMI1 ERDR1 HNRPDL PML XBP1 Facteurs de Division Asymétrique GPSM2 AP2A2 KIF3A TMOD1 CCNB1 Non Identifiés MLL MOZ CBP GFI1 Wnt Smad ANGPT1 FOXO IL3 Déterminants Connus de l'activité des HSCs FGF AHR IL6 Réseau Global de l'activité des HSCs HOXB4 SOX4 MSI2 SMARCC1 PRDM16 KDM5B KLF10 GPSM2 SPI1 FOS AP2A2 KIF3A TFEC TMOD1 CCNB1 ID1 THPO MYC SCF STAT Notch BMI1 Wnt MLL Smad VPS72 MOZ ANGPT1 TRIM27 SKI HNRPDL GPX3 HMGB1 XBP1 CNBP CBP FOXO GFI1 IL3 ERDR1 ZFP472 PML FGF Bien qu une expansion robuste puisse être utile en recherche, une expansion légère est suffisante en clinique. D autre part, au moins neuf de ces facteurs fonctionnent de manière extrinsèque, écartant du coup tout problème potentiel associé à l insertion rétrovirale dans les HSCs. Au moins un de ces facteurs, VPS72, augmente l activité des HSCs
229 203 humaines extrinsèquement. Ainsi, VPS72 pourrait être utile en thérapie clinique dans le but d améliorer l efficacité des transplantations de moelle osseuse et de sang de cordon ombilical. Il sera également profitable d identifier les facteurs produits par les cellules nourricières modifiées et qui sont responsables de l expansion extrinsèque des cellules souches. Ces facteurs sécrétés pourraient être utilisés directement comme facteurs de croissance des HSCs en culture. L objectif éventuel est de comprendre le mode d action de chacun des facteurs identifiés dans cette thèse et de révéler les partenaires avec lesquels ils interagissent en réseau dans différentes voies de signalisation. Le développement de nouvelles technologies en biologie moléculaire contribuera sans doute, un jour, à atteindre cet objectif.
230 Sources Documentaires Antonchuk, J., Sauvageau, G., and Humphries, R.K. (2002). HOXB4-induced expansion of adult hematopoietic stem cells ex vivo. Cell 109, Boitano, A.E., Wang, J., Romeo, R., Bouchez, L.C., Parker, A.E., Sutton, S.E., Walker, J.R., Flaveny, C.A., Perdew, G.H., Denison, M.S., et al. (2010). Aryl hydrocarbon receptor antagonists promote the expansion of human hematopoietic stem cells. Science 329, Bonaldi, T., Talamo, F., Scaffidi, P., Ferrera, D., Porto, A., Bachi, A., Rubartelli, A., Agresti, A., and Bianchi, M.E. (2003). Monocytic cells hyperacetylate chromatin protein HMGB1 to redirect it towards secretion. EMBO J 22, Chiba, T., Kanda, A., Ueki, S., Ito, W., Yamaguchi, K., Kamada, Y., Takeda, M., Tanigai, T., Oyamada, H., Kayaba, H., et al. (2007). Possible novel receptor for PGD2 on human bronchial epithelial cells. Int Arch Allergy Immunol 143 Suppl 1, Cicek, M., Vrabel, A., Sturchio, C., Pederson, L., Hawse, J.R., Subramaniam, M., Spelsberg, T.C., and Oursler, M.J. (2011). TGF-beta inducible early gene 1 regulates osteoclast differentiation and survival by mediating the NFATc1, AKT, and MEK/ERK signaling pathways. PLoS One 6, e Gardella, S., Andrei, C., Ferrera, D., Lotti, L.V., Torrisi, M.R., Bianchi, M.E., and Rubartelli, A. (2002). The nuclear protein HMGB1 is secreted by monocytes via a non-classical, vesicle-mediated secretory pathway. EMBO Rep 3, Grigoriadis, A.E., Wang, Z.Q., Cecchini, M.G., Hofstetter, W., Felix, R., Fleisch, H.A., and Wagner, E.F. (1994). c-fos: a key regulator of osteoclast-macrophage lineage determination and bone remodeling. Science 266, Hope, K.J., Cellot, S., Ting, S.B., MacRae, T., Mayotte, N., Iscove, N.N., and Sauvageau, G. (2010). An RNAi screen identifies Msi2 and Prox1 as having opposite roles in the regulation of hematopoietic stem cell activity. Cell Stem Cell 7, Lee, H.M., Zhang, H., Schulz, V., Tuck, D.P., and Forget, B.G. (2010). Downstream tar-
231 205 gets of HOXB4 in a cell line model of primitive hematopoietic progenitor cells. Blood 116, Lessard, J., and Sauvageau, G. (2003). Bmi-1 determines the proliferative capacity of normal and leukaemic stem cells. Nature 423, Mansky, K.C., Sulzbacher, S., Purdom, G., Nelsen, L., Hume, D.A., Rehli, M., and Ostrowski, M.C. (2002). The microphthalmia transcription factor and the related helix-loophelix zipper factors TFE-3 and TFE-C collaborate to activate the tartrate-resistant acid phosphatase promoter. J Leukoc Biol 71, Miyamoto, T., Asaka, R., Suzuki, A., Takatsu, A., Kashima, H., and Shiozawa, T. (2011). Immunohistochemical detection of a specific receptor for lipocalin2 (solute carrier family 22 member 17, SLC22A17) and its prognostic significance in endometrial carcinoma. Exp Mol Pathol 91, Orelio, C., Peeters, M., Haak, E., van der Horn, K., and Dzierzak, E. (2009). Interleukin-1 regulates hematopoietic progenitor and stem cells in the midgestation mouse fetal liver. Haematologica 94, Pan, N., Luo, J., Kaiser, S.J., Frome, W.L., Dart, R.A., and Tewksbury, D.A. (2006). Specific receptor for angiotensinogen on human renal cells. Clin Chim Acta 373, Rodgers, K.E., Xiong, S., Steer, R., and dizerega, G.S. (2000). Effect of angiotensin II on hematopoietic progenitor cell proliferation. Stem Cells 18, Shao, L., Li, H., Pazhanisamy, S.K., Meng, A., Wang, Y., and Zhou, D. (2011). Reactive oxygen species and hematopoietic stem cell senescence. Int J Hematol 94, Takahashi, K., and Yamanaka, S. (2006). Induction of pluripotent stem cells from mouse embryonic and adult fibroblast cultures by defined factors. Cell 126, Tondravi, M.M., McKercher, S.R., Anderson, K., Erdmann, J.M., Quiroz, M., Maki, R., and Teitelbaum, S.L. (1997). Osteopetrosis in mice lacking haematopoietic transcription factor PU.1. Nature 386, Uchida, N., Dykstra, B., Lyons, K., Leung, F., Kristiansen, M., and Eaves, C. (2004). ABC transporter activities of murine hematopoietic stem cells vary according to their developmental and activation status. Blood 103,
232 206 Vierbuchen, T., Ostermeier, A., Pang, Z.P., Kokubu, Y., Sudhof, T.C., and Wernig, M. (2010). Direct conversion of fibroblasts to functional neurons by defined factors. Nature 463, Wilhelm, B.T., Briau, M., Austin, P., Faubert, A., Boucher, G., Chagnon, P., Hope, K., Girard, S., Mayotte, N., Landry, J.R., et al. (2011). RNA-seq analysis of 2 closely related leukemia clones that differ in their self-renewal capacity. Blood 117, e Zhou, Q., Brown, J., Kanarek, A., Rajagopal, J., and Melton, D.A. (2008). In vivo reprogramming of adult pancreatic exocrine cells to beta-cells. Nature 455,
233 ANNEXE 1 ARTICLE A Role for GPX3 in Activity of Normal and Leukemia Stem Cells Publié dans: J Exp Med 2012 May 7;209(5): PMID:
234 xxvii Contribution des Co-Auteurs J ai aussi identifié GPX3 lors du criblage décrit au chapitre 3. Ma participation à cet article se limite à la Figure 5. Ma contribution en pourcentage aux différentes figures et tables de l article : Figure 1 : 0% Figure 2 : 0% Figure 3 : 0% Figure 4 : 0% Figure 5 : 75% Figure S1 : 0% Table S1 : 0%
235 xxviii
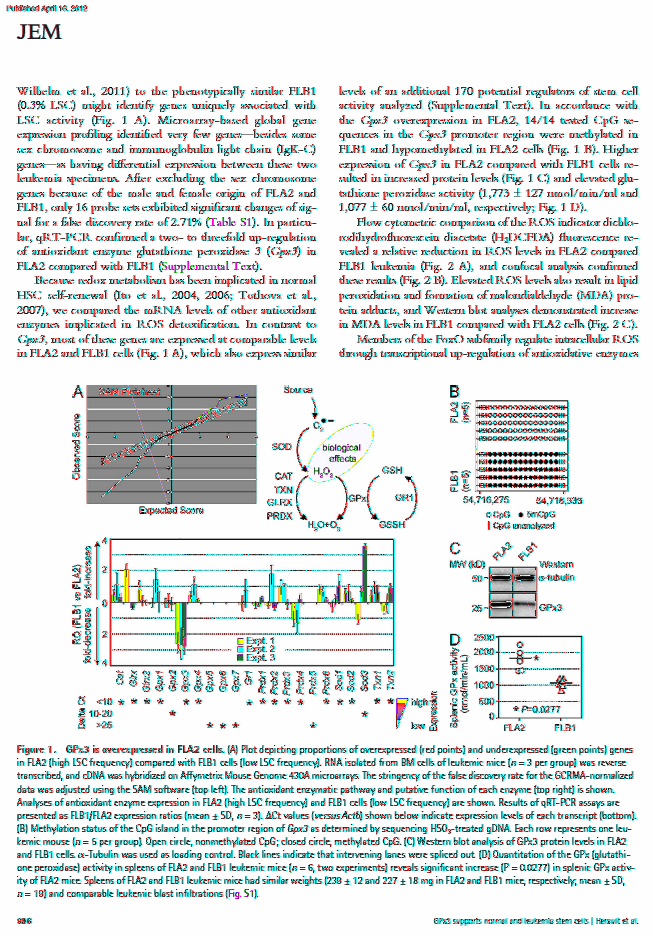
236 xxix

237 xxx

238 xxxi
239 xxxii
240 xxxiii
241 xxxiv

242 xxxv
Les OGM. 5 décembre 2008. Nicole Mounier
 Les OGM 5 décembre 2008 Nicole Mounier Université Claude Bernard Lyon 1 CGMC, bâtiment Gregor Mendel 43, boulevard du 11 Novembre 1918 69622 Villeurbanne Cedex OGM Organismes Génétiquement Modifiés Transfert
DIAPOSITIVE 1 Cette présentation a trait à la réglementation sur les thérapies cellulaires.
 Produits de thérapie cellulaire DIAPOSITIVE 1 Cette présentation a trait à la réglementation sur les thérapies cellulaires. DIAPOSITIVE 2 La fabrication des thérapies cellulaires est examinée par la Division
PRINCIPALES ETAPES DE L'HEMATOPOIESE MEDULLAIRE (lignées, maturation, voies de domiciliation tissulaire) Partie II
 Partie II") Le 23/09/13 SOGHOMONIAN Astrid, L2 Tissu sanguin et système immunitaire Pr Baccini 22 pages PRINCIPALES ETAPES DE L'HEMATOPOIESE MEDULLAIRE (lignées, maturation, voies de domiciliation tissulaire) Partie
Le 23/09/13 SOGHOMONIAN Astrid, L2 Tissu sanguin et système immunitaire Pr Baccini 22 pages PRINCIPALES ETAPES DE L'HEMATOPOIESE MEDULLAIRE (lignées, maturation, voies de domiciliation tissulaire) Partie
Les Applications industrielles et commerciales des cellules souches. Inserm Transfert Pôle Création d Entreprises
 Les Applications industrielles et commerciales s cellules souches Inserm Transfert Pôle Création d Entreprises Matthieu COUTET, Responsable du Pôle Jean-François RAX, Business Analyst 1 Plan Cellules souches
Les cytokines et leurs récepteurs. Laurence Guglielmi laurence.guglielmi@univ-montp1.frli
 Les cytokines et leurs récepteurs Laurence Guglielmi laurence.guglielmi@univ-montp1.frli l i@ i 1 Les cytokines et leurs récepteurs 2 mécanismes principaux d interactions cellulaires : - contact membranaire
Biomarqueurs en Cancérologie
 Biomarqueurs en Cancérologie Définition, détermination, usage Biomarqueurs et Cancer: définition Anomalie(s) quantitative(s) ou qualitative(s) Indicative(s) ou caractéristique(s) d un cancer ou de certaines
Plateforme Transgenèse/Zootechnie/Exploration Fonctionnelle IBiSA. «Anexplo» Service Transgenèse. Catalogue des prestations
 Plateforme Transgenèse/Zootechnie/Exploration Fonctionnelle IBiSA «Anexplo» Service Transgenèse Catalogue des prestations 04/01/12 - Page 1 sur 8 Présentation du service de Transgenèse Le service de Transgenèse
Cytokines & Chimiokines
 Cytokines & Chimiokines I. (D après Förster, R. et al. (1999) Cell 99:23) Dans le but d étudier la régulation de la circulation des leucocytes dans l organisme, des souris déficientes pour le récepteur
Dr E. CHEVRET UE2.1 2013-2014. Aperçu général sur l architecture et les fonctions cellulaires
 Aperçu général sur l architecture et les fonctions cellulaires I. Introduction II. Les microscopes 1. Le microscope optique 2. Le microscope à fluorescence 3. Le microscope confocal 4. Le microscope électronique
EXERCICES : MECANISMES DE L IMMUNITE : pages 406 407 408 409 410
 EXERCICES : MECANISMES DE L IMMUNITE : pages 406 407 408 409 410 EXERCICE 1 PAGE 406 : EXPERIENCES A INTERPRETER Question : rôles respectifs du thymus et de la moelle osseuse dans la production des lymphocytes.
TD de Biochimie 4 : Coloration.
 TD de Biochimie 4 : Coloration. Synthèse de l expérience 2 Les questions posées durant l expérience 2 Exposé sur les méthodes de coloration des molécules : Générique Spécifique Autres Questions Pourquoi
ANTICORPS POLYCLONAUX ANTI IMMUNOGLOBULINES
 L OUTIL IDEAL POUR TOUTES LES DETECTIONS IMMUNOCHIMIQUES pour toutes les techniques immunodosages (EIA/ELISA) dot/ westernblot immunohistochimie immunocytochimie cytométrie en flux quel que soit le système
Vue d ensemble : Office of Cellular, Tissue and Gene Therapies
 Vue d ensemble : Office of Cellular, Tissue and Gene Therapies DIAPOSITIVE 1 Cette présentation fournit une vue d ensemble de l Office of Cellular, Tissue, and Gene Therapies (bureau des thérapies cellulaires,
Cytokines ; Chimiokines
 Cytokines ; Chimiokines I. Dans le but d étudier la régulation de la circulation des leucocytes dans l'organisme, des souris déficientes pour le récepteur CCR7 de chimiokine ont été générées par recombinaison
Cibles et mécanismes d action des traitements par cytokines et anti-cytokines
 Cibles et mécanismes d action des traitements par cytokines et anti-cytokines Jean Daniel Lelièvre, Yves Lévy, Pierre Miossec I-Introduction... 2 II-Les interférons... 2 II-1.L interféron... 3 II-1-a.
L INSUFFISANCE CARDIAQUE
 L INSUFFISANCE CARDIAQUE EXISTE-T-IL DES TRAITEMENTS À BASE DE CELLULES SOUCHES POUR L INSUFFISANCE CARDIAQUE? Bien qu aucun traitement à base de cellules souches pour l insuffisance cardiaque n ait encore
Cellules souches hématopoïétiques
 Cellules souches hématopoïétiques Pr Bernard Klein INSERM-UM1 U1040: BIOTHERAPY OF NORMAL AND CANCER STEM CELLS INSTITUTE FOR RESEARCH IN BIOTHERAPY http://irb.chu-montpellier.fr Hématopoïèse! Plaquettes
MAB Solut. vos projets. MABLife Génopole Campus 1 5 rue Henri Desbruères 91030 Evry Cedex. www.mabsolut.com. intervient à chaque étape de
 Mabsolut-DEF-HI:Mise en page 1 17/11/11 17:45 Page1 le département prestataire de services de MABLife de la conception à la validation MAB Solut intervient à chaque étape de vos projets Création d anticorps
Thérapies par cellules souches dans la SEP
 Thérapies par cellules souches dans la SEP Rédigé en partenariat avec Sommaire Introduction 3 Qu est-ce que la SEP? 4 Que sont les cellules souches? 5 Qu est-ce qu une thérapie par cellules souches? 6
PLAN. Intérêt des cellules souches exogènes (hématopoïétiques ou mésenchymateuses) dans la réparation/régénération
 dans la réparation/régénération") Cellules souches & appareil respiratoire : Perpectives thérapeutiques Pr Carole Planès Physiologie SMBH Bobigny EA 2363, UFR SMBH, Université Paris 13 carole.planes@avc.aphp.fr Master 2 B2PCR Respiration
Cellules souches & appareil respiratoire : Perpectives thérapeutiques Pr Carole Planès Physiologie SMBH Bobigny EA 2363, UFR SMBH, Université Paris 13 carole.planes@avc.aphp.fr Master 2 B2PCR Respiration
Principales causes de décès selon le groupe d âge. 0 24 25 44 45 64 65 84 85 et plus
 Module 2 Exercice 1: Cellules souches hématopoïétiques 1. Causes de décès en Suisse (2010) La figure suivante montre les causes de décès les plus fréquentes en Suisse en 2010, telles qu elles ont été relevées
Les plateformes de génétique
 Thérapies ciblées : de l anatomopathologie th l à la biothérapie i Les plateformes de génétique moléculaire PO Schischmanoff UF Génétique moléculaire et oncogénétique CHU Avicenne ACP FHF 29 mars 2012
Première partie: Restitution + Compréhension (08 points)
") Lycée M hamdia Année scolaire : 2011/2012 Prof : Saïd Mounir Date : 17/05/2012 Première partie: Restitution + Compréhension (08 points) EXERCIE N O 1: (4 points) : 1 : a-b 2 : b 3 : a-b 4 : d 5 : d 6 :
Lycée M hamdia Année scolaire : 2011/2012 Prof : Saïd Mounir Date : 17/05/2012 Première partie: Restitution + Compréhension (08 points) EXERCIE N O 1: (4 points) : 1 : a-b 2 : b 3 : a-b 4 : d 5 : d 6 :
Photoactivatable Probes for Protein Labeling
 Photoactivatable Probes for Protein Labeling THÈSE N O 4660 (2010) PRÉSENTÉE LE 26 MARS 2010 À LA FACULTÉ SCIENCES DE BASE LABORATOIRE D'INGÉNIERIE DES PROTÉINES PROGRAMME DOCTORAL EN CHIMIE ET GÉNIE CHIMIQUE
AMAMI Anaïs 3 C LORDEL Maryne. Les dons de cellules & de tissus.
 AMAMI Anaïs 3 C LORDEL Maryne Les dons de cellules & de tissus. Introduction : Une greffe (don) de cellules consiste à administrer à un patient dont un organe vital ne fonctionne plus correctement, une
Innovations thérapeutiques en transplantation
 Innovations thérapeutiques en transplantation 3èmes Assises de transplantation pulmonaire de la région Est Le 16 octobre 2010 Dr Armelle Schuller CHU Strasbourg Etat des lieux en transplantation : 2010
INSUFFISANCE HÉPATIQUE
 INSUFFISANCE HÉPATIQUE EXISTE-T-IL DES TRAITEMENTS À BASE DE CELLULES SOUCHES POUR L INSUFFISANCE HÉPATIQUE? Bien qu aucun traitement à base de cellules souches pour l insuffisance hépatique ne soit approuvé
IMMUNOLOGIE. La spécificité des immunoglobulines et des récepteurs T. Informations scientifiques
 IMMUNOLOGIE La spécificité des immunoglobulines et des récepteurs T Informations scientifiques L infection par le VIH entraîne des réactions immunitaires de l organisme qui se traduisent par la production
Transgene accorde une option de licence exclusive pour le développement et la commercialisation de son produit d immunothérapie TG4010
 Parc d Innovation d Illkirch, France, le 10 mars 2010 Transgene accorde une option de licence exclusive pour le développement et la commercialisation de son produit d immunothérapie TG4010 Transgene (Euronext
3: Clonage d un gène dans un plasmide
 3: Clonage d un gène dans un plasmide Le clonage moléculaire est une des bases du génie génétique. Il consiste à insérer un fragment d'adn (dénommé insert) dans un vecteur approprié comme un plasmide par
Profil médico-économique de plerixafor en remobilisation dans le myélome multiple
 Profil médico-économique de plerixafor en remobilisation dans le myélome multiple Aline Voidey Soirée de la Société de Médecine de Franche-Comté Jeudi 27 novembre 2014 L hématopoièse Une seule et unique
Hépatite chronique B Moyens thérapeutiques
 Hépatite chronique B Moyens thérapeutiques Dr Olfa BAHRI Laboratoire de Virologie Clinique Institut Pasteur de Tunis INTRODUCTION Plus de 300. 10 6 porteurs chroniques de VHB dans le monde Hépatite chronique
ANEMIE ET THROMBOPENIE CHEZ LES PATIENTS ATTEINTS D UN CANCER
 ANEMIE ET THROMBOPENIE CHEZ LES PATIENTS ATTEINTS D UN CANCER Dr Michael Hummelsberger, Pr Jean-Gabriel Fuzibet, Service de Médecine Interne, Hôpital l Archet, CHU Nice 1. ANEMIE L étiologie de l anémie
COUSIN Fabien KERGOURLAY Gilles. 19 octobre 2007. de l hôte par les. Master 2 MFA Responsable : UE Incidence des paramètres environnementaux
 COUSIN Fabien KERGOURLAY Gilles 19 octobre 2007 Inhibition des défenses de l hôte par les bactéries pathogènes Master 2 MFA Responsable : UE Incidence des paramètres environnementaux Gwennola ERMEL I Détection
Qu est-ce qu un sarcome?
 Qu est-ce qu un sarcome? Qu est-ce qu une tumeur? Une tumeur est une prolifération anormale de cellules. Les tumeurs ne devraient donc pas automatiquement être associées à un cancer. Certaines tumeurs
ROTARY INTERNATIONAL District 1780 Rhône-Alpes Mont-Blanc Don volontaire de cellules souches
 ROTARY INTERNATIONAL District 1780 Rhône-Alpes Mont-Blanc Don volontaire de cellules souches Le don de cellules souches Jean VIVIN 04/2013 1-Nature du problème : 2- Technique Les leucémies représentent
CHAPITRE 3 LA SYNTHESE DES PROTEINES
 CHAITRE 3 LA SYNTHESE DES ROTEINES On sait qu un gène détient dans sa séquence nucléotidique, l information permettant la synthèse d un polypeptide. Ce dernier caractérisé par sa séquence d acides aminés
Chapitre II La régulation de la glycémie
 Chapitre II La régulation de la glycémie Glycémie : concentration de glucose dans le sang valeur proche de 1g/L Hypoglycémie : perte de connaissance, troubles de la vue, voire coma. Hyperglycémie chronique
Rôle des acides biliaires dans la régulation de l homéostasie du glucose : implication de FXR dans la cellule bêta-pancréatique
 Rôle des acides biliaires dans la régulation de l homéostasie du glucose : implication de FXR dans la cellule bêta-pancréatique Tuteur : Anne Muhr-Tailleux cardiovasculaires et diabète (Equipe 1) Institut
Item 127 : Transplantation d'organes
 Item 127 : Transplantation d'organes Date de création du document 2008-2009 Table des matières * Introduction... 1 1 Allogreffe de moelle ou de cellules souches...1 2 Transplantation d'organes... 2 3 Diagnostic...3
Résumé de la thèse de Salma Hasan
 Résumé de la thèse de Salma Hasan Les Néoplasies Myéloproliferatives JAK2 V617F : Modélisation chez la souris knock- In, thérapie par l Interféron α et mesure de l architecture des clones JAK2 V617F chez
Greffe des cellules souches hématopoïétiques : Avancée actuelles POUR L OBTENTION DU DOCTORAT EN PHARMACIE
 UNIVERSITE MOHAMMED V FACULTE DE MEDECINE ET DE PHARMACIE -RABAT- ANNEE : 2011 THESE N : 68 Greffe des cellules souches hématopoïétiques : Avancée actuelles THESE Présentée et soutenue publiquement le
Le rôle de l endocytose dans les processus pathologiques
 UE7 Cours n 9 C. LAMAZE 24.11.11 Elise GODEAU (partie1) Guillaume MERGENTHALER (partie2) Le rôle de l endocytose dans les processus pathologiques SOMMAIRE : I. L endocytose à récepteurs : la voie des clathrines
Reprogrammation nucléaire de cardiomyocytes vers un stade progéniteur par fusion partielle avec des cellules souches adultes
 Reprogrammation nucléaire de cardiomyocytes vers un stade progéniteur par fusion partielle avec des cellules souches adultes Adrien Acquistapace, Adrien Acquistapace To cite this version: Adrien Acquistapace,
5.5.5 Exemple d un essai immunologique
 5.5.5 Exemple d un essai immunologique Test de grossesse Test en forme de bâtonnet destiné à mettre en évidence l'hormone spécifique de la grossesse, la gonadotrophine chorionique humaine (hcg), une glycoprotéine.
QU EST-CE QUE LA PROPHYLAXIE?
 QU EST-CE QUE LA PROPHYLAXIE? TABLES DES MATIÈRES Publié par la Fédération mondiale de l hémophilie (FMH) Fédération mondiale de l hémophilie, 2014 La FMH encourage la traduction et la redistribution de
Annales du Contrôle National de Qualité des Analyses de Biologie Médicale
 Annales du Contrôle National de Qualité des Analyses de Biologie Médicale ARN du virus de l hépatite C : ARN-VHC ARN-VHC 03VHC1 Novembre 2003 Edité : mars 2006 Annales ARN-VHC 03VHC1 1 / 8 ARN-VHC 03VHC1
chronique La maladie rénale Un risque pour bon nombre de vos patients Document destiné aux professionnels de santé
 Document destiné aux professionnels de santé Agence relevant du ministère de la santé La maladie rénale chronique Un risque pour bon nombre de vos patients Clés pour la dépister et ralentir sa progression
Conception de Médicament
 Conception de Médicament Approche classique HTS Chimie combinatoire Rational Drug Design Ligand based (QSAR) Structure based (ligand et ou macromolec.) 3DQSAR Docking Virtual screening Needle in a Haystack
SERVICE PUBLIC FEDERAL, SANTE PUBLIQUE, SECURITE DE LA CHAINE ALIMENTAIRE ET ENVIRONNEMENT COMMISSION DE BIOLOGIE CLINIQUE RAPPORT GLOBAL
 SERVICE PUBLIC FEDERAL, SANTE PUBLIQUE, SECURITE DE LA CHAINE ALIMENTAIRE ET ENVIRONNEMENT COMMISSION DE BIOLOGIE CLINIQUE SERVICE DES LABORATOIRES DE BIOLOGIE CLINIQUE COMITE DES EXPERTS RAPPORT GLOBAL
La Greffe de Cellules Souches Hématopoïétiques
 La Greffe de Cellules Souches Hématopoïétiques Professeur Ibrahim Yakoub-Agha CHRU de LILLE (Illustration de J. Cloup, extraite du CD-Rom «greffe de Moelle» réalisé par la société K Noë) La moelle osseuse
Consensus Scientifique sur. les. Champs statiques
 page 1/8 Consensus Scientifique sur Source : OMS (2006) les Champs statiques Résumé & Détails: GreenFacts Contexte - Les équipements d imagerie médicale par résonance magnétique (IRM), les trains et les
La lutte contre la tuberculose est régie par l arrêté royal du 17 octobre 2002.
 Le diagnostic de la tuberculose bovine La lutte contre la tuberculose est régie par l arrêté royal du 17 octobre 2002. 1. Tuberculination Dans la première phase d une infection de tuberculose bovine (Mycobacterium
Introduction générale
 Introduction générale Touchant près de 600 nouvelles personnes chaque année en France, la leucémie myéloïde chronique est une maladie affectant les cellules du sang et de la moelle osseuse (située au cœur
Dystrophies Musculaires Thérapie génique et Thérapie cellulaire
 Dystrophies Musculaires Thérapie génique et Thérapie cellulaire Pr. François Rivier Service de Neuropédiatrie CHU de Montpellier EA 701 - Université Montpellier I Plan q Les dystrophies musculaires q Prise
L immunoenzymologie. Technique puissante couramment utilisée e en recherche et en diagnostic cificité des anticorps pour leurs nes
 L immunoenzymologie Technique puissante couramment utilisée e en recherche et en diagnostic Basée e sur la très s grande spécificit cificité des anticorps pour leurs antigènes nes Test qualitatif Détection
Les renseignements suivants sont destinés uniquement aux personnes qui ont reçu un diagnostic de cancer
 Information importante pour les personnes atteintes d un cancer du poumon non à petites cellules de stade avancé Les renseignements suivants sont destinés uniquement aux personnes qui ont reçu un diagnostic
DON DE SANG. Label Don de Soi
 DON DE SANG Label Don de Soi 2015 SOMMAIRE Les différents types de dons p.3 Le don de sang total Le don de plasma Le don de plaquettes Le don de moelle osseuse Que soigne-t-on avec un don de sang? p.7
Accrédité par l AABB. www.progenicscryobank.com
 La conservation du sang ombilical de votre bébé à la naissance pourrait bien plus tard sauver la vie de votre enfant et celle d autres membres de votre famille www.progenicscryobank.com Accrédité par l
ACTUALITES THERAPEUTIQUES. Dr Sophie PITTION (CHU Nancy) Metz, le 2 Juin 2012
 Metz, le 2 Juin 2012") ACTUALITES THERAPEUTIQUES Dr Sophie PITTION (CHU Nancy) Metz, le 2 Juin 2012 Traitement de fond Objectifs: Réduire le nombre de poussées Arrêter ou freiner la progression du handicap Les traitements disponibles
ACTUALITES THERAPEUTIQUES Dr Sophie PITTION (CHU Nancy) Metz, le 2 Juin 2012 Traitement de fond Objectifs: Réduire le nombre de poussées Arrêter ou freiner la progression du handicap Les traitements disponibles
TEST ELISA (ENZYME-LINKED IMMUNOSORBENT ASSEY)
") TEST ELISA (ENZYME-LINKED IMMUNOSORBENT ASSEY) Lise Vézina, technicienne de laboratoire Michel Lacroix, agronome-phytopathologiste Direction de l innovation scientifique et technologique Au Laboratoire
TEST ELISA (ENZYME-LINKED IMMUNOSORBENT ASSEY) Lise Vézina, technicienne de laboratoire Michel Lacroix, agronome-phytopathologiste Direction de l innovation scientifique et technologique Au Laboratoire
Les cellules souches du cordon ombilical
 Gymnase Cantonal du Bugnon, Lausanne Travail de Maturité 2013 Les cellules souches du cordon ombilical Léo Corsini et Tutrice : Madame Françoise Jaunin Résumé Léo Corsini Pour traiter les maladies comme
Montréal, 24 mars 2015. David Levine Président et chef de la direction DL Strategic Consulting. DL Consulting Strategies in Healthcare
 Montréal, 24 mars 2015 David Levine Président et chef de la direction DL Strategic Consulting 1 RSSPQ, 2013 2 MÉDECINE INDIVIDUALISÉE Médecine personnalisée Médecine de précision Biomarqueurs Génomique
Docteur Laurent PELLETIER
 Biologie Cellulaire Chapitre 2 : Méthodes d études en biologie cellulaire Docteur Laurent PELLETIER MED@TICE PCEM1 - Année 2006/2007 Faculté de Médecine de Grenoble - Tous droits réservés. Méthodes d études
Le don de cellules souches. M.Lambermont Pascale Van Muylder
 Le don de cellules souches M.Lambermont Pascale Van Muylder 1 Pourquoi avons-nous recours à la greffe de CSH? Certaines maladies causent la destruction ou un fonctionnement anormal de la moelle osseuse.
Les facteurs de croissance lignée blanche Polynucléaires neutrophiles Grastims
 Les facteurs de croissance lignée blanche Polynucléaires neutrophiles Grastims 12 2014 HEMATOPOIESE Progéniteurs puis précurseurs Stimulation par facteur : activation spécifique de leur récepteur Moelle
Consolidation osseuse et biotechnologies État des lieux. Prof. L. GALOIS Centre Hospitalier Universitaire de NANCY
 Consolidation osseuse et biotechnologies État des lieux Prof. L. GALOIS Centre Hospitalier Universitaire de NANCY La problématique Tissu osseux : forte aptitude à se réparer MAIS Situations cliniques particulières
Anémie et maladie rénale chronique. Phases 1-4
 Anémie et maladie rénale chronique Phases 1-4 Initiative de qualité en matière d issue des maladies rénales de la National Kidney Foundation Saviez-vous que l initiative de qualité en matière d issue des
Science et technique. La température et la durée de stockage sont des facteurs déterminants. Viande bovine et micro-organisme pathogène
 Science et technique Viande bovine et micro-organisme pathogène La température et la durée de stockage sont des facteurs déterminants La contamination des carcasses lors des opérations d abattage et la
F.Benabadji Alger 22.11.13
 F.Benabadji Alger 22.11.13 ALLERGIE DANS LE MONDE 4ÉME RANG MONDIAL (OMS) PROBLÈME DE SANTÉ PUBLIQUE LES CAUSES Notre environnement (industriel, technologique, scientifique et climatique) * Allergènes
www.gbo.com/bioscience 1 Culture Cellulaire Microplaques 2 HTS- 3 Immunologie/ HLA 4 Microbiologie/ Bactériologie Containers 5 Tubes/ 6 Pipetage
 2 HTS 3 Immunologie / Immunologie Informations Techniques 3 I 2 ELISA 96 Puits 3 I 4 ELISA 96 Puits en Barrettes 3 I 6 en Barrettes de 8 Puits 3 I 7 en Barrettes de 12 Puits 3 I 8 en Barrettes de 16 Puits
Chapitre III Le phénotype immunitaire au cours de la vie
 Chapitre III Le phénotype immunitaire au cours de la vie Le phénotype immunitaire d un individu caractérise sa capacité à répondre, grâce aux effecteurs de l immunité adaptative, aux différents agents
Enseignement de Virologie (part. 2) Pr. Y. BAKRI Plan du cours
 Pr. Y. BAKRI Plan du cours") Université Mohammed V-Agdal Département de Biologie Faculté des Sciences Filière SVI Semestre 4 Année Universitaire : 2009-2010 Module optionnel: Biologie Humaine (M 16.1) Elément : Parasitologie - Virologie
Université Mohammed V-Agdal Département de Biologie Faculté des Sciences Filière SVI Semestre 4 Année Universitaire : 2009-2010 Module optionnel: Biologie Humaine (M 16.1) Elément : Parasitologie - Virologie
Tableau récapitulatif : composition nutritionnelle de la spiruline
 Tableau récapitulatif : composition nutritionnelle de la spiruline (Valeur énergétique : 38 kcal/10 g) Composition nutritionnelle Composition pour 10 g Rôle Protéines (végétales) 55 à 70 % Construction
Les tests de génétique moléculaire pour l accès aux thérapies ciblées en France en 2011
 Mesure 21 SOINS ET VIE DES MALADES Les tests de génétique moléculaire pour l accès aux thérapies ciblées en France en 2011 COLLECTION Rapports & synthèses POUR UN ACCÈS AUX THÉRAPIES CIBLÉES : - LES PLATEFORMES
Compléments - Chapitre 5 Spectroscopie
 ompléments - hapitre 5 Spectroscopie Spectroscopie par résonance magnétique nucléaire (RMN 13 ) Tandis que la spectroscopie RMN 1 H fournit des données sur la disposition des atomes d'hydrogène dans une
Les grandes voies de transmission du signal en cancérologie : où en sommes-nous?
 Les grandes voies de transmission du signal en cancérologie : où en sommes-nous? Dynamique des réseaux de signalisation et réponse aux thérapies ciblées Pascal GAUDUCHON Unité "Biologie et Thérapies Innovantes
Le don de moelle osseuse :
 DON DE MOELLE OSSEUSE Le don de moelle osseuse : se décider aujourd hui, s engager pour longtemps LA MOELLE OSSEUSE ET SA GREFFE La moelle osseuse C est le tissu mou dans le centre du corps des os qui
Enseignement de Virologie (part. 2) Pr. Y. BAKRI Plan du cours
 Pr. Y. BAKRI Plan du cours") Université Mohammed V-Agdal Département de Biologie Faculté des Sciences Filière SVI Semestre 4 Année Universitaire : 2004-2005 Module optionnel: Biologie Humaine (M 16.1) Elément : Parasitologie - Virologie
Université Mohammed V-Agdal Département de Biologie Faculté des Sciences Filière SVI Semestre 4 Année Universitaire : 2004-2005 Module optionnel: Biologie Humaine (M 16.1) Elément : Parasitologie - Virologie
Information à un nouveau donneur de cellules souches du sang
 Information à un nouveau donneur de cellules souches du sang Pour des raisons de simplification, les dénominations masculines s appliquent également aux femmes. La transplantation de cellules souches du
à Mulhouse un centre pionnier de recherche médicale
 à Mulhouse un centre pionnier de recherche médicale 25 ans de lutte contre les leucémies et l infarctus du myocarde Fondé en 1987 par le Professeur Philippe Hénon et localisé au sein de l Hôpital du Hasenrain
Information génétique
 chapitre 3 Information génétique et division cellulaire L étude de la division cellulaire est abordée pour découvrir comment est transmise et conservée l information génétique portée par les chromosomes.
De la physico-chimie à la radiobiologie: nouveaux acquis (I)
") De la physico-chimie à la radiobiologie: nouveaux acquis (I) Collaboration: - Laboratoire de Radiotoxicologie et Oncologie (L. Sabatier) CEA, DSV - Laboratoire de Génotoxicité et Modulation de l Expression
De la physico-chimie à la radiobiologie: nouveaux acquis (I) Collaboration: - Laboratoire de Radiotoxicologie et Oncologie (L. Sabatier) CEA, DSV - Laboratoire de Génotoxicité et Modulation de l Expression
Explorations des réponses Immunitaires. L3 Médecine
 2012 Explorations des réponses Immunitaires L3 Médecine Rappel sur les réponses Immunitaires DIFFERENTS TYPES DE REPONSES IMMUNITAIRES Naturelle = innée Adaptative Non spécifique Spécifique Immédiate Barrière
2.0 Interprétation des cotes d évaluation des risques relatifs aux produits
 2.0 Interprétation des cotes d évaluation des risques relatifs aux produits L interprétation des cotes attribuées dans le cadre des évaluations des risques relatifs aux produits décrite plus loin repose
Les tests génétiques à des fins médicales
 Les tests génétiques à des fins médicales Les tests génétiques à des fins médicales Nous avons tous hérité d une combinaison unique de gènes de la part de nos parents. Cette constitution originale et l
Biologie Appliquée. Dosages Immunologiques TD9 Mai 2015. Stéphanie Sigaut INSERM U1141 stephanie.sigaut@inserm.fr
 Biologie Appliquée Dosages Immunologiques TD9 Mai 2015 Stéphanie Sigaut INSERM U1141 stephanie.sigaut@inserm.fr 1 ELISA 2 3 4 [Ac] 5 6 7 8 9 Correction : Faire la moyenne D0-1 et D0-2 pour toute les valeurs
Contrôle de l'expression génétique : Les régulations post-transcriptionnelles
 Contrôle de l'expression génétique : Les régulations post-transcriptionnelles http://perso.univ-rennes1.fr/serge.hardy/ utilisateur : biochimie mot de passe : 2007 L'ARNm, simple intermédiaire entre le
QUELLES SONT LES OPTIONS DU TRAITEMENT DE LA LMC?
 QUELLES SONT LES OPTIONS DU TRAITEMENT DE LA LMC? On vous a diagnostiqué une leucémie myéloïde chronique (LMC) et il se peut que vous ayez déjà débuté un traitement. Le traitement de la LMC dépend largement
Bases moléculaires des mutations Marc Jeanpierre
 Bases moléculaires des mutations Marc Jeanpierre Chaque enfant qui naît hérite de 10 à 30 nouvelles mutations ponctuelles. L essentiel des ces mutations sont heureusement des variations neutres de séquence
Semestre 2 Spécialité «Analyse in silico des complexes macromolécules biologiques-médicaments»
 Master In silico Drug Design Semestre 2 Spécialité «Analyse in silico des complexes macromolécules biologiques-médicaments» 30NU01IS INITIATION A LA PROGRAMMATION (6 ECTS) Responsables : D. MESTIVIER,
Introduction aux bases de données: application en biologie
 Introduction aux bases de données: application en biologie D. Puthier 1 1 ERM206/Technologies Avancées pour le Génome et la Clinique, http://tagc.univ-mrs.fr/staff/puthier, puthier@tagc.univ-mrs.fr ESIL,
CONTROVERSE : IDR OU QUANTIFERON LORS D'UN CONTAGE EN EHPAD?
 CONTROVERSE : IDR OU QUANTIFERON LORS D'UN CONTAGE EN EHPAD? Hélène MANGEARD François MALADRY Tuberculose : infection mycobactérienne Infection mycobactérienne chronique (M. Tuberculosis ++ ou bacille
Mise en place d une solution automatique de stockage et de visualisation de données de capture des interactions chromatiniennes à l échelle génomique
 Rapport de stage de deuxième année de DUT Génie Biologique option Bioinformatique Mise en place d une solution automatique de stockage et de visualisation de données de capture des interactions chromatiniennes
- 2 - faire industriel dans la mise au point des produits biologiques. L Institut Roche de Recherche et Médecine Translationnelle (IRRMT, basé à
 Information presse Roche, l Agence Nationale de Recherches sur le Sida et les hépatites virales (ANRS), le Baylor Research Institute (BRI) et Inserm Transfert mettent en place une coopération stratégique
LES DÉFICITS IMMUNITAIRES COMBINÉS SÉVÈRES
 LES DÉFICITS IMMUNITAIRES COMBINÉS SÉVÈRES Le présent livret a été rédigé à l attention des patients et de leurs familles. Il ne doit pas remplacer les conseils d un spécialiste en immunologie. 1 Egalement
Guide à l intention des patients sur les thérapies à base de cellules souches
 Guide à l intention des patients sur les thérapies à base de cellules souches Appendice I des Lignes directrices pour l application en clinique des cellules souches Traduction fournie par le Réseau de
Gènes de prédisposition au diabète, une belle avancée!
 imprimer la page Gènes de prédisposition au diabète, une belle avancée! Philippe Froguel, directeur de l'umr 8090, Institut Pasteur de Lille La question du diabète est actuellement très préoccupante, partout
Génétique et génomique Pierre Martin
 Génétique et génomique Pierre Martin Principe de la sélections Repérage des animaux intéressants X Accouplements Programmés Sélection des meilleurs mâles pour la diffusion Index diffusés Indexation simultanée